Footprint Charts Explained: How to Read Bid x Ask
How to read a footprint chart: bid x ask volume at each price, delta, the bar POC, diagonal and stacked imbalances, absorption, unfinished auctions and limits.
By TickMint Team Published 8 min read Intermediate
Key takeaways
- A footprint splits each bar into price rows and shows how many contracts traded at the bid (aggressive sellers) and at the ask (aggressive buyers) on each row.
- Imbalances are compared diagonally: ask volume at one price against bid volume one tick lower, and the reverse for selling.
- The bar POC is the row with the most volume, and bar delta is total ask volume minus total bid volume.
- Footprint patterns describe what already happened; they mean most next to a key level and depend on clean tick data.
On this page
- What does a footprint chart show?
- How do you read a bid x ask footprint?
- Why compare diagonally?
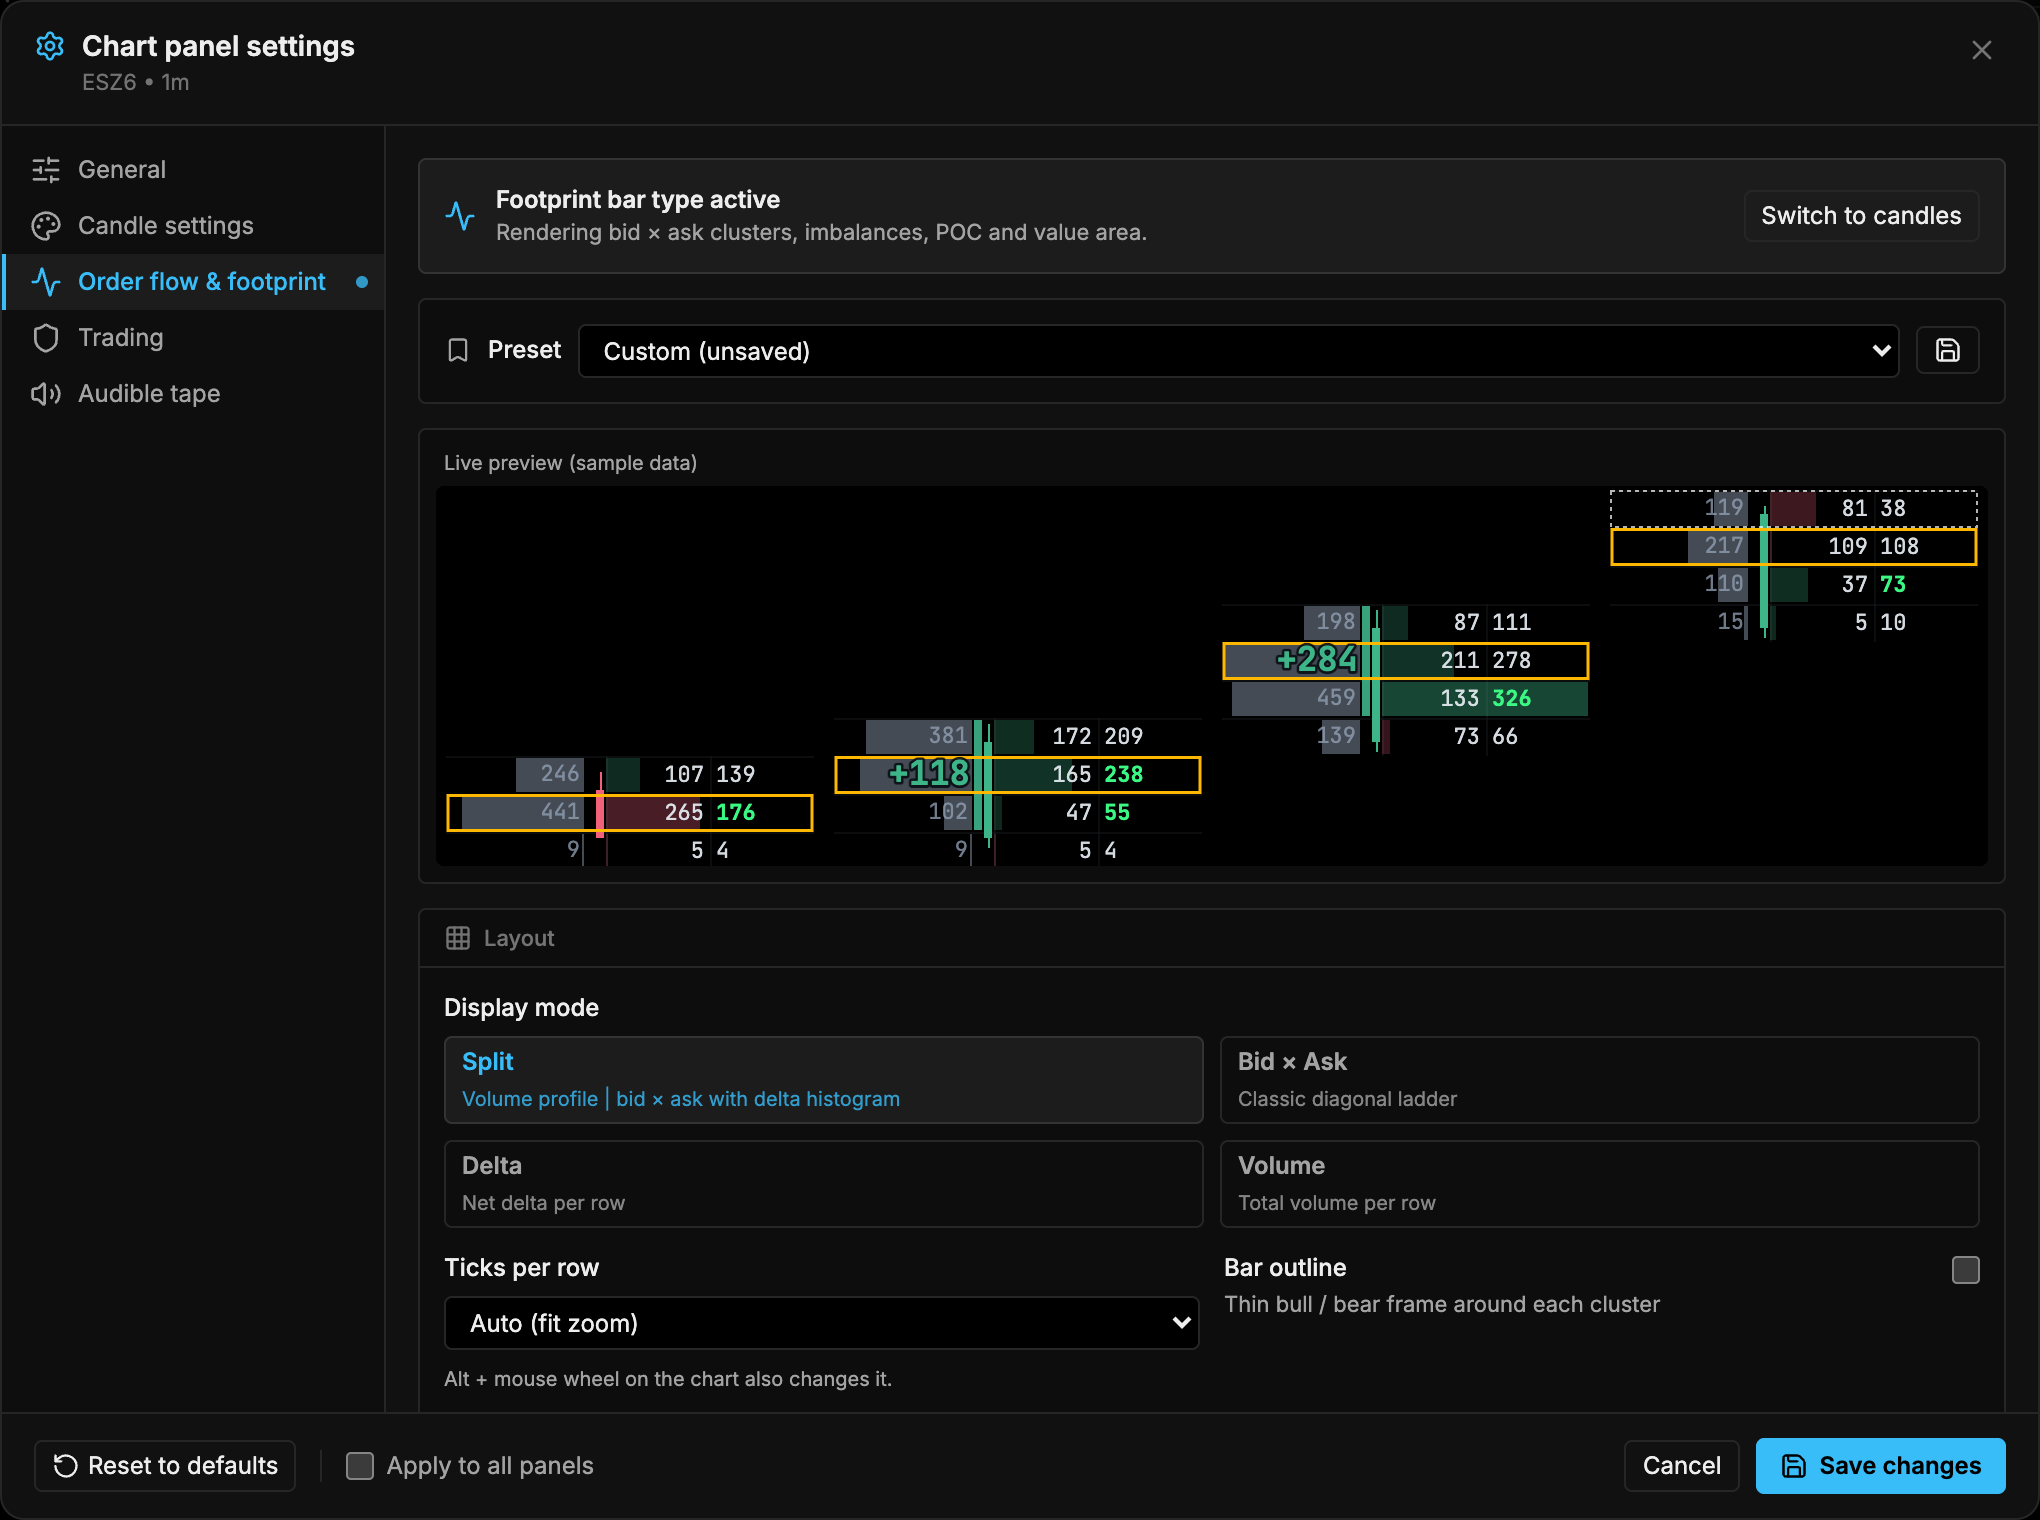
- What are bid x ask, delta and volume footprints?
- What is the bar POC?
- What are diagonal and stacked imbalances?
- What do absorption and exhaustion look like?
- Absorption
- Exhaustion
- What is an unfinished auction?
- How do you use footprints with context?
- What are the limitations of footprint charts?
- Putting it together
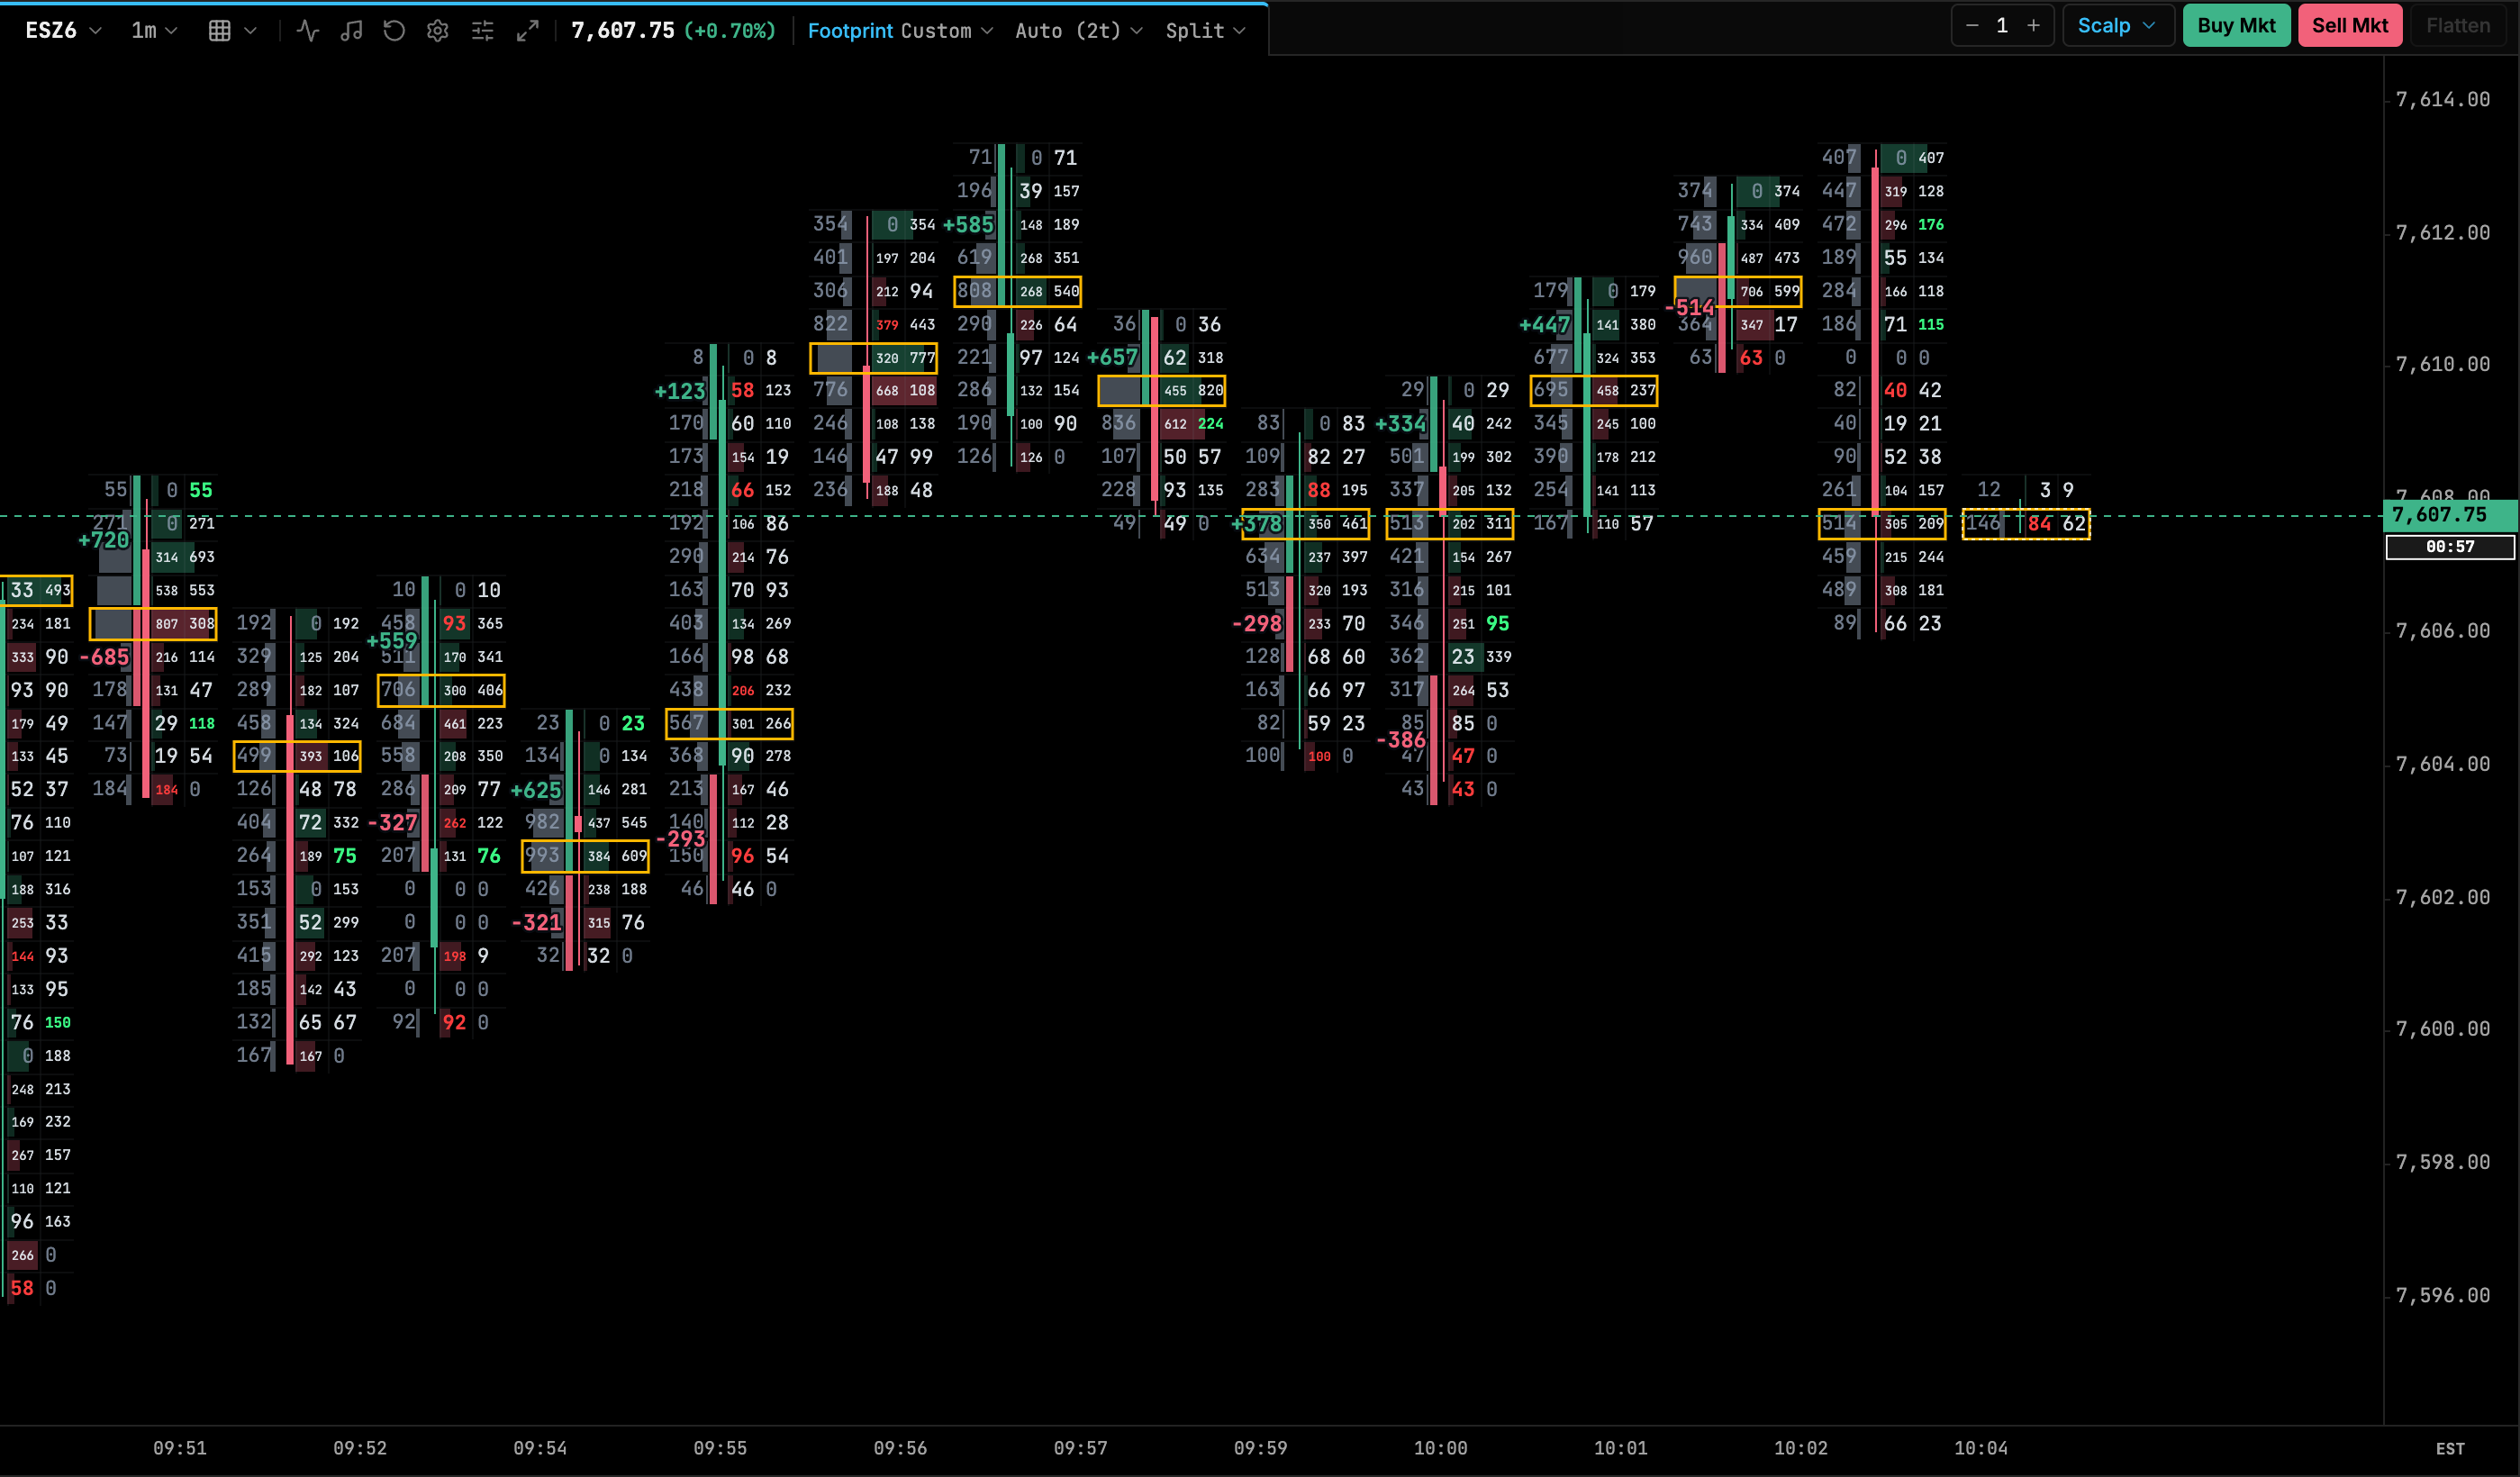
A footprint chart shows how much volume traded at each price inside a bar, split into trades at the bid and trades at the ask. In a bid x ask footprint, the left number on each row is contracts sold at the bid by aggressive sellers, and the right number is contracts bought at the ask by aggressive buyers. From those two columns you can read the bar’s delta, its point of control, diagonal imbalances and signs of absorption or exhaustion at the high and low.
What does a footprint chart show?
A normal candlestick tells you four prices: open, high, low and close. A footprint chart opens the candle up and shows the trading at every price in between.
Each trade in futures has two sides: a resting limit order and an aggressive order that crossed the spread to fill against it. Footprints classify every trade by which side was aggressive:
- Trades at the bid: a seller used a market order (or a marketable limit order) and hit a resting buy order. These count as aggressive selling.
- Trades at the ask: a buyer used a market order and lifted a resting sell order. These count as aggressive buying.
Passive limit orders are on the other side of every one of these trades. The footprint doesn’t show who was passive, only which side initiated.
How do you read a bid x ask footprint?
Here is one illustrative ES-style bar, one row per 0.25-point tick.
Read it row by row. At 5011.25, 47 contracts traded at the bid and 168 at the ask. Buyers were far more aggressive than sellers at that price.
Why compare diagonally?
At any moment the market has a best bid and a best ask one tick apart. Say it’s quoted 5011.00 bid and 5011.25 ask. An aggressive buyer pays 5011.25, and an aggressive seller sells at 5011.00. Those two competing orders print on different rows.
So to compare buyers with sellers at the same moment, you compare the ask at one price with the bid one tick lower. That diagonal comparison is the basis of footprint imbalances.
What are bid x ask, delta and volume footprints?
Most platforms let you switch what each row shows. The underlying data is the same; only the summary changes.
| Mode | What each row shows | Good for |
|---|---|---|
| Bid x ask | Bid volume and ask volume side by side | Reading imbalances, absorption and auction details |
| Delta | Ask volume minus bid volume for that row | Seeing quickly where buyers or sellers dominated |
| Volume | Total contracts traded at that price | Seeing where activity concentrated, like a mini volume profile |
Delta is the difference between ask volume and bid volume. Per row it shows local pressure, and per bar it summarizes the whole bar. Summed across bars, it becomes cumulative delta. Some platforms also offer hybrid modes, such as a small volume profile beside the bid x ask numbers, as in the screenshot above.
What is the bar POC?
The bar POC (point of control) is the price row with the most total volume in that bar. In the diagram it’s 5010.75, with 446 contracts.
The POC shows where the bar did most of its business. Where it sits within the bar adds context:
- A POC near the bottom of an up bar means most trading happened at lower prices before the push higher.
- A POC near the high or low means heavy trading at an extreme, which some traders read as either strong participation or potential absorption.
This is the same idea as the POC on a session profile, applied to a single bar. For the session-level version, see volume profile explained.
What are diagonal and stacked imbalances?
A diagonal imbalance is flagged when one side’s aggressive volume beats the other side’s by a set ratio on the diagonal:
- Buy imbalance: ask volume at a price is at least the ratio times the bid volume one tick lower.
- Sell imbalance: bid volume at a price is at least the ratio times the ask volume one tick higher.
A ratio of 3:1 (300%) is a common default, and most platforms let you change it. Many also apply a minimum volume, so that 6 against 2 at a quiet price doesn’t count. In TickMint, for example, the default ratio is 3.0× with a minimum volume of 10.
A stacked imbalance is several consecutive rows of imbalances in the same direction. In the diagram, 5011.50 and 5011.25 stack. Some traders require two rows and others three or more, so check your settings before comparing notes.
Traders often treat the zone of a stacked buy imbalance as an area where buyers were aggressive and may defend on a return. That’s a reading of past behavior, not a promise. Stacked imbalances can fail, especially when they form into a nearby level where sellers are waiting.
What do absorption and exhaustion look like?
Both are read at the extremes of a bar, its high and low.
Absorption
Absorption is heavy aggressive volume that fails to move price. For example, a bar shows large ask volume on its top few rows but closes well below them. Buyers were aggressive, and passive sellers absorbed it all with limit orders. The mirror case is heavy bid volume at the low with the bar closing higher.
Platforms that flag absorption automatically usually compare volume at the extreme rows with the bar’s average volume per row, and check where the bar closed. Thresholds vary, so learn what your platform is measuring.
Exhaustion
Exhaustion is the opposite pattern: aggressive volume dries up at the extreme. Volume on the last rows of a move falls to small numbers, which suggests fewer participants were willing to keep pushing price.
The diagram shows a mild version. Ask volume of 142 to 168 at 5011.00–5011.50 thins to 41 at 5011.75 and 15 at the high of 5012.00. Whether that matters depends on what happens next and where the bar sits.
What is an unfinished auction?
This is a concept from auction market theory, and definitions vary slightly between traders and platforms. Treat it as a way of describing a bar, not a rule.
The common definition looks at the very top and bottom rows of a bar:
- Finished auction: one side shows zero at the extreme. At a high, that’s volume at the bid but zero at the ask, meaning no buyer was willing to pay that price aggressively. At a low, it’s zero at the bid. This is often called a zero print.
- Unfinished auction: both sides traded at the extreme. Aggressive buyers were still lifting offers at the high (or sellers still hitting bids at the low) when the bar ended.
Some traders expect price to revisit an unfinished high or low later, because the auction there didn’t complete. That’s a tendency some traders observe, not something that always happens. In the diagram, both extremes traded on both sides: 12 x 15 at the high and 30 x 31 at the low. By the common definition, both are unfinished.
How do you use footprints with context?
A footprint pattern on its own, in the middle of nowhere, tells you very little. Most order flow traders read footprints only at places they already care about:
- Prior session high, low and close.
- The overnight high and low.
- Session volume profile levels such as the POC, value area high and value area low.
- VWAP and its bands.
- Clear swing highs and lows.
The question then becomes specific. Price reaches yesterday’s high: are buyers still aggressive with stacked buy imbalances, or does heavy ask volume get absorbed and the bar close back below? The footprint helps you answer that, and the level tells you why it matters.
Context also includes the trend, the time of day and scheduled news. A large delta in the first minute after the 8:30 a.m. CT (9:30 a.m. ET) equity open means something different from the same delta at lunchtime. For how footprints fit with the tape, the DOM and cumulative delta, see the order flow trading guide.
What are the limitations of footprint charts?
- Data quality. A footprint is only as good as its tick data. It needs every trade with its aggressor side. Feeds or history that are aggregated, filtered or rebuilt from bars give an approximate footprint.
- Aggressor classification. Some data comes with the exchange’s aggressor flag. Where it doesn’t, platforms estimate it, for example by comparing the trade price with the last bid and ask or by a tick rule. Estimates can misclassify trades, especially in fast markets.
- Settings change the picture. Imbalance ratio, minimum volume, ticks per row and bar type all change which signals appear. The same market can look very different with different settings.
- It shows the past. Every number on a footprint is a trade that has already happened. Patterns such as stacked imbalances or unfinished auctions describe behavior; they don’t predict the next move.
- Hidden intent. You see aggressive orders, not the reasons behind them. A large print at the ask could be a new buyer or a short seller covering a position.
- Noise on small bars. On very short timeframes or quiet instruments, volume per row can be too thin for ratios to mean much.
Putting it together
Start with the basics on every bar: which side was aggressive on each row, the bar delta and where the POC sits. Then look for diagonal and stacked imbalances, and check the extremes for absorption, exhaustion and unfinished auctions. Read all of it at a level you’ve marked in advance, and remember it describes what already happened.
Next steps:
- See how footprints fit with other tools in the order flow trading guide.
- Learn the session-level version of the POC in volume profile explained.
- If you’re comparing platforms with footprint support, use the checklist in how to choose a futures trading platform.
Frequently asked questions
What does bid x ask mean on a footprint chart?
Each price row shows two numbers. The left number is volume that traded at the bid, meaning sellers hit the bid with market orders, and the right number is volume that traded at the ask, meaning buyers lifted the offer.
Why are footprint imbalances compared diagonally?
Because aggressive buyers and sellers trade at different prices at the same moment. With the market quoted 5011.00 bid and 5011.25 ask, buyers trade at 5011.25 and sellers at 5011.00, so the ask at one price is compared with the bid one tick lower.
What is a stacked imbalance?
Several consecutive price rows that each show an imbalance in the same direction. Traders often watch the zone they create, but the number of rows required, commonly two or three, and the ratio are settings that vary between platforms.
Do footprint charts predict where price will go?
No. A footprint records trades that have already happened. Traders use it to judge how other participants reacted at a level, alongside context such as key levels and the trend.