Order Flow Footprint
A footprint chart splits every bar into price rows and shows how much volume traded at the bid and at the ask on each row. TickMint builds footprints from tick data with aggressor side, so you can see delta, imbalances, absorption and the point of control (POC) form in real time.
New to this concept? ReadFootprint Charts Explained: How to Read Bid x Ask.
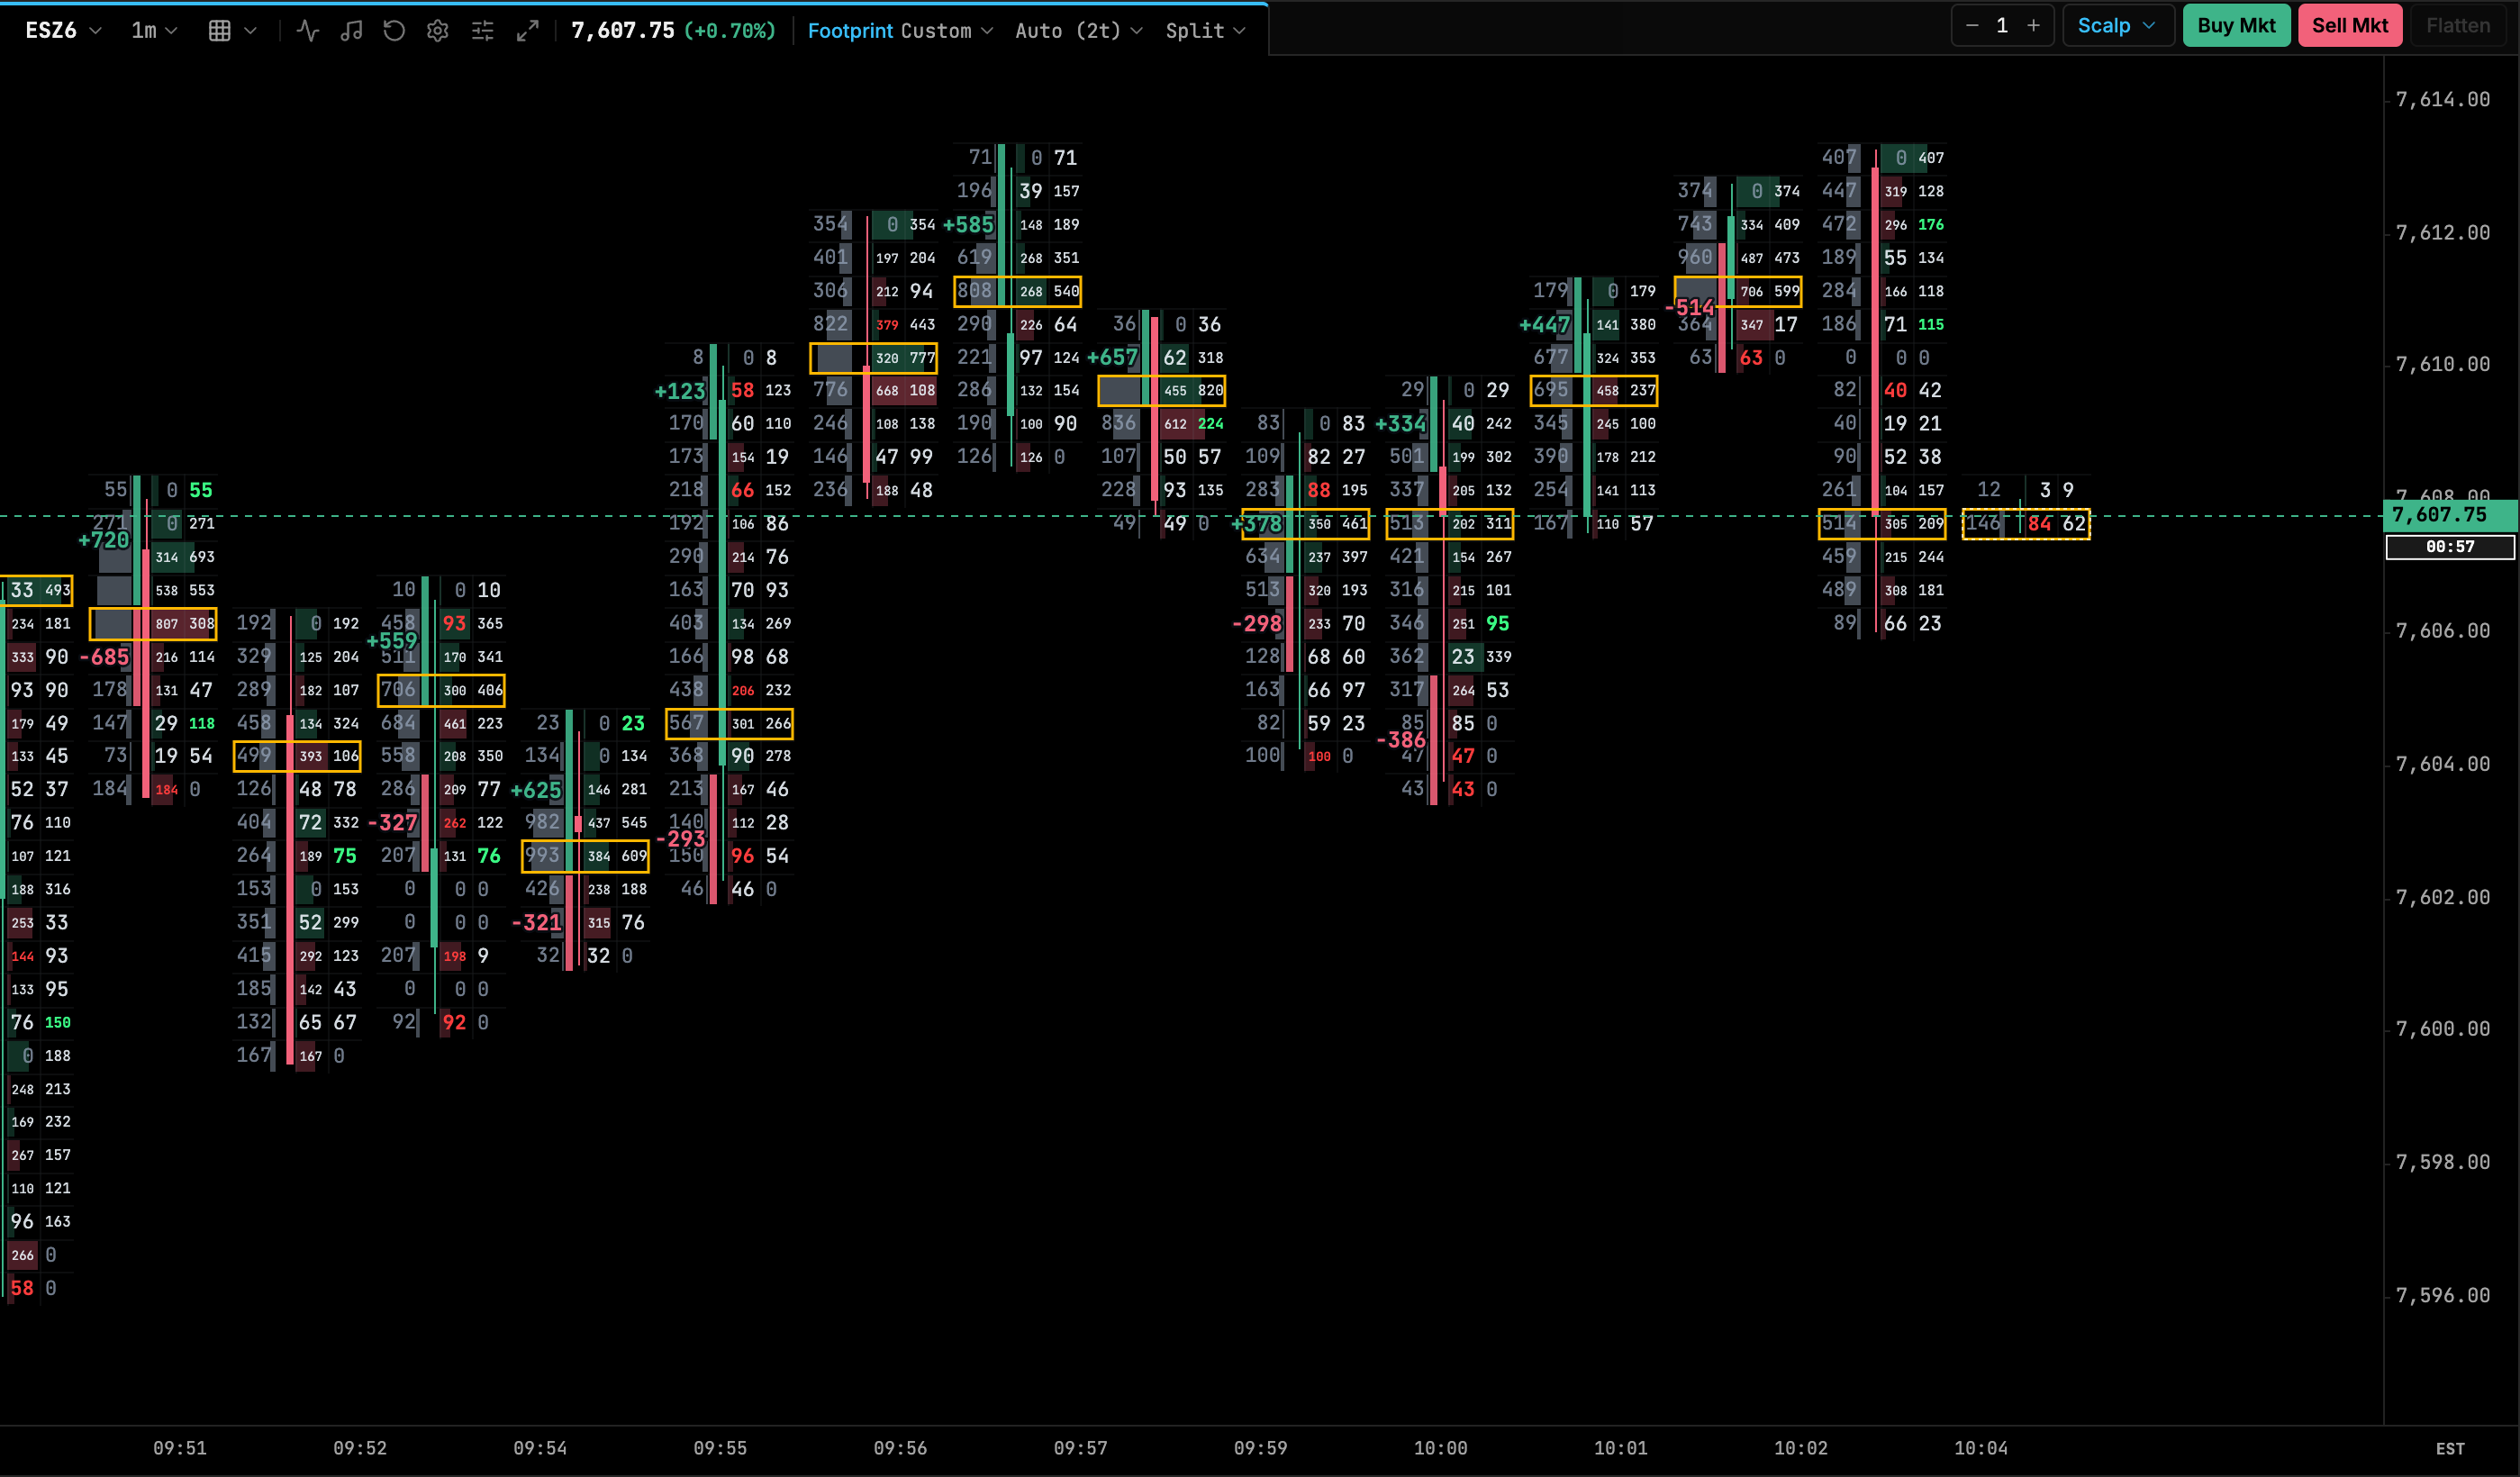
Turn on the footprint
- Open the panel’s Candle Type menu in the header (see Chart Panel & Navigation).
- Choose Footprint. The panel loads tick history for the visible range and starts building rows from the live feed.
- Use the header controls to pick a preset, row size and display mode.
Footprints work on any bar type (time, tick, range, and so on). Tick history goes back up to 10 days. When the footprint opens or you reset the view, the right-hand padding is capped so the latest bar stays close to the price axis instead of drifting toward the middle of the chart.
Header controls

- Footprint preset: switch between built-in and your saved presets.
- Ticks per row: Auto (shows the resolved size, for example Auto (2t)) or a fixed number of ticks.
- Display mode: Split, Bid × Ask, Delta or Volume.
Click (1) to change the overall look, (2) to merge price rows when bars get crowded, and (3) to change what each row shows.
Presets
| Preset | What it emphasizes |
|---|---|
| Split (default) | Volume profile on one side, bid × ask over a delta histogram on the other, delta-block labels, POC, absorption and delta zones. |
| Classic | Diagonal bid × ask ladder with stacked imbalance zones and a value area bracket. |
| Delta Scalper | Net delta per row, delta blocks and naked POC rays. |
| Clusters | Total volume with volume-heat coloring normalized to the session, cluster highlighting and large-lot highlights. |
| Imbalance Hunter | Bid × ask with imbalance-only coloring, stacked imbalance zones, filtered single imbalances, zero prints and absorption. |
| Minimal | Numbers only. |
Change any setting and save it as your own preset from the settings panel. Custom presets appear in the preset menu and can be deleted there.
Footprint settings
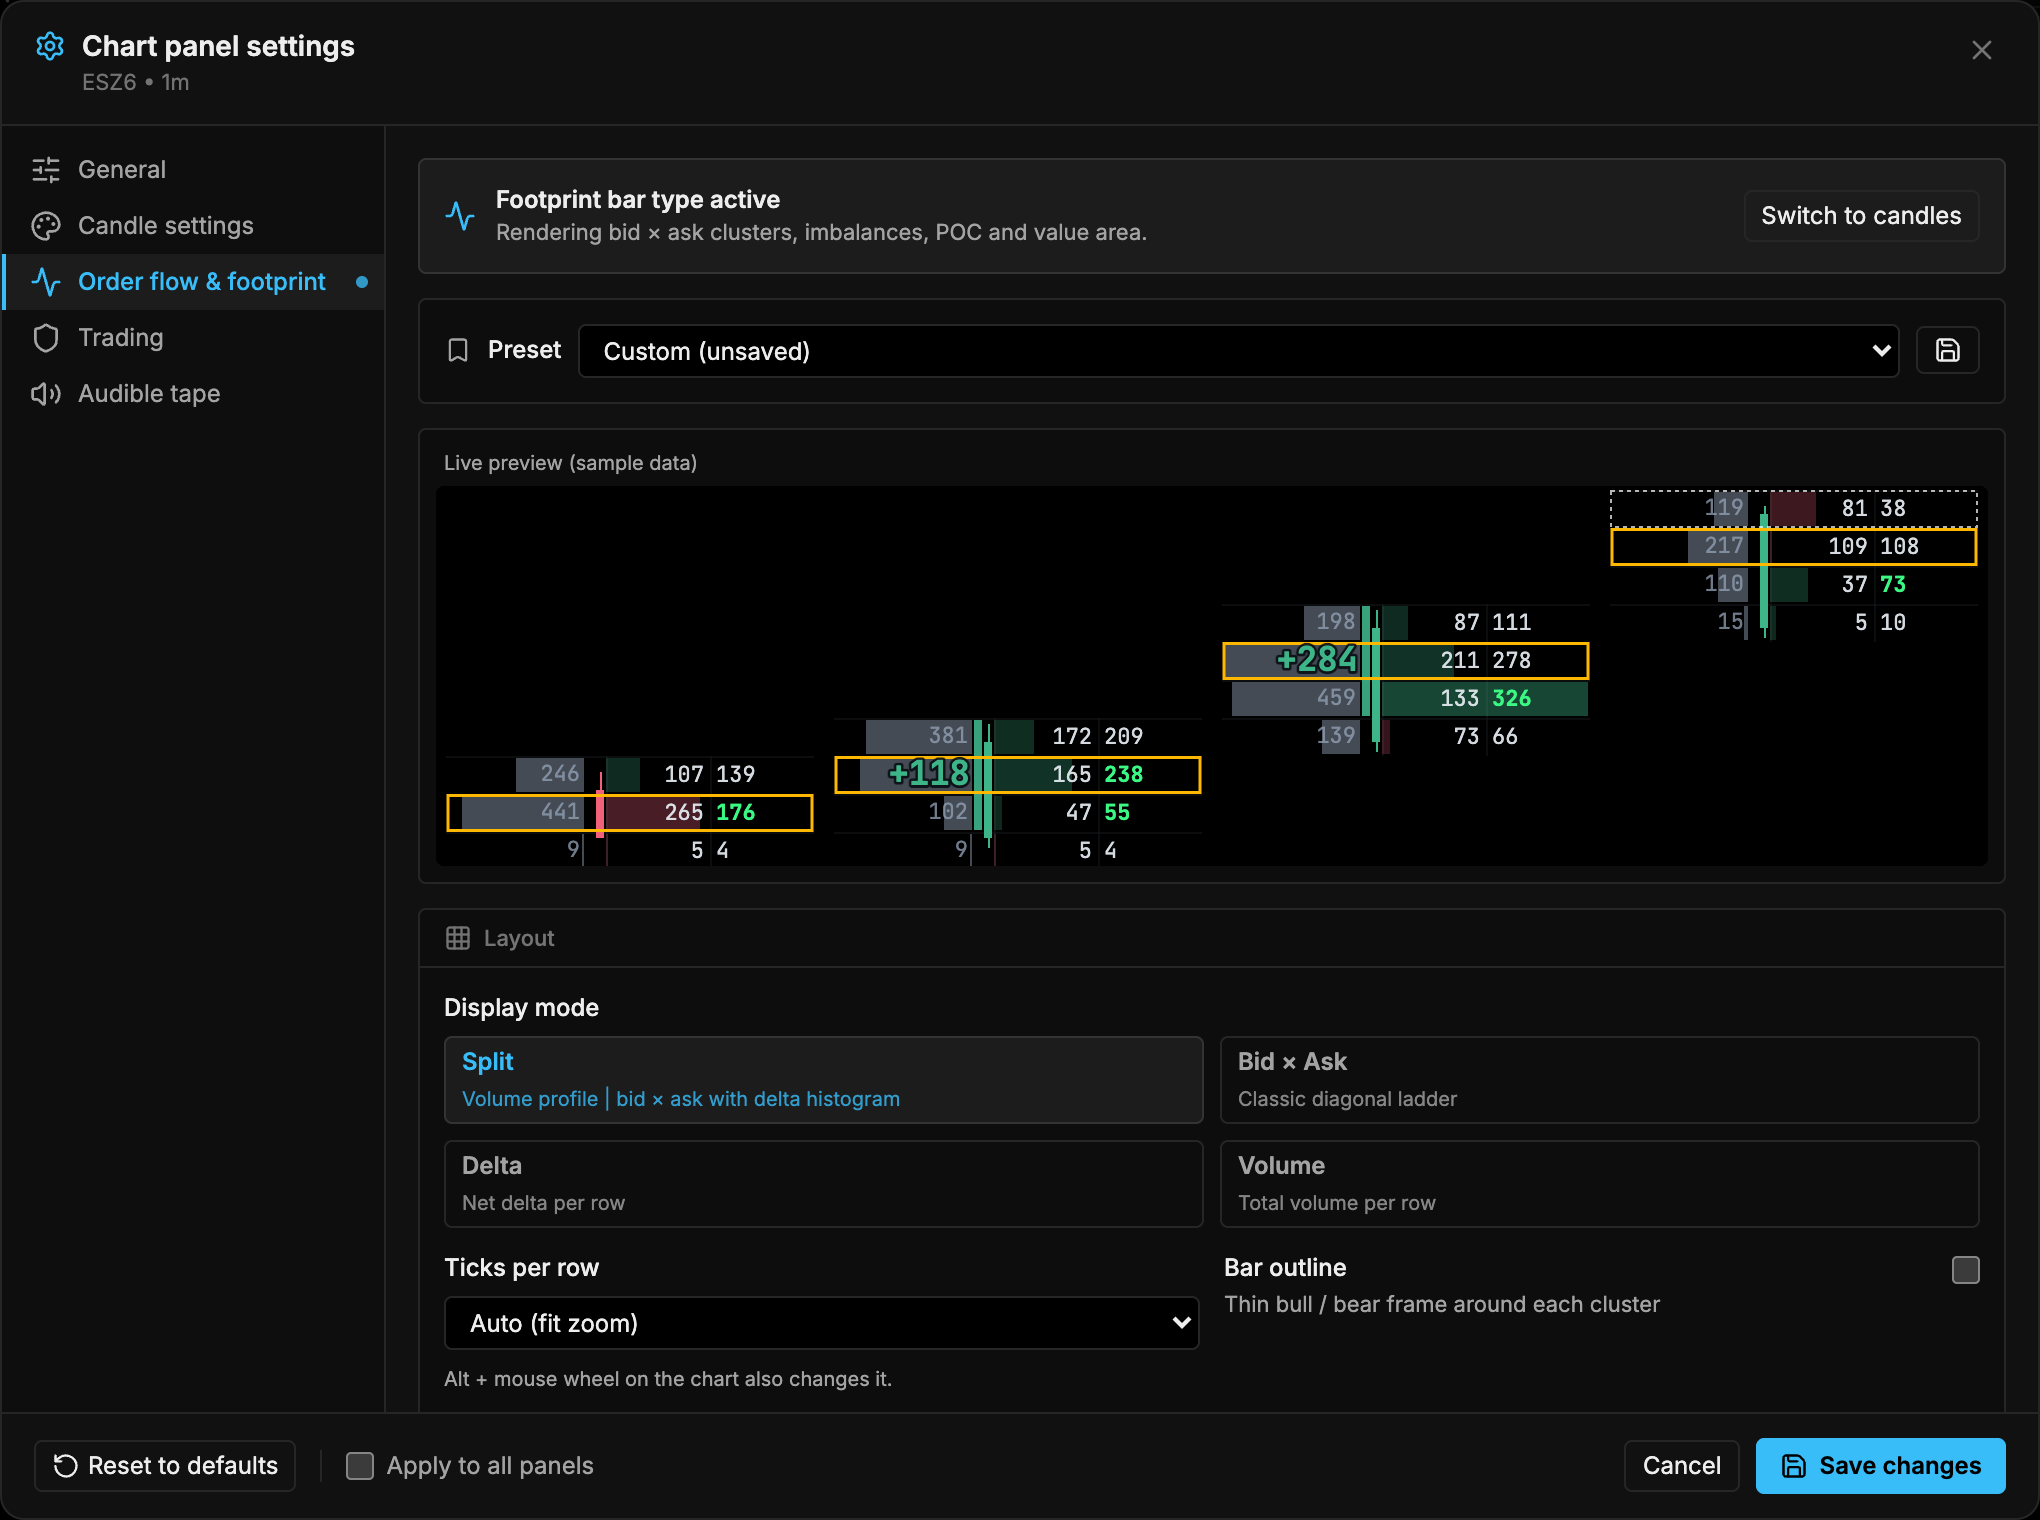
Open the panel gear and choose the Footprint tab. A banner at the top confirms the footprint bar type is active and offers a one-click switch back to candles. Below it are the preset selector, a live preview, and the sections listed here.
| Setting | Default | Options / range |
|---|---|---|
| Display mode | Split | Split: volume profile, then bid × ask with a delta histogram. Bid × Ask: classic diagonal ladder. Delta: net delta per row. Volume: total volume per row. |
| Ticks per row | Auto | Auto or a fixed tick count |
| Bar outline | Preset dependent | Thin bull / bear frame around each cluster |
| Color scheme | Delta | Delta (bid red, ask green), Volume heat, Imbalances only, None |
| Shading intensity | 60% | 10–100% |
| Setting | Default | Options / range |
|---|---|---|
| Delta blocks | On | Highlights runs of rows with strong one-sided delta |
| Large delta labels | Preset dependent | S / M / L (1.25×, 1.5×, 2× text) |
| Minimum rows | 3 | 2–10 |
| Minimum |delta| | Any | 0–2000 |
| Delta zones | On | Zone threshold 1–5× average (default 2×) |
| Abnormal clusters | Off | Ratio 1.5–6× neighbors (default 2×) |
| Minimal clusters | Off | Ratio 0.05–0.75 (default 0.25) |
| Cluster zones | Off | |
| Neighbor rows | ±3 | ±1–8 |
| Setting | Default | Options / range |
|---|---|---|
| Diagonal imbalances | On | Ratio 1.5–10 (default 3.0×); Minimum volume 1–200 (default 10) |
| Stacked levels | 3 | 2–8 consecutive imbalance rows |
| Count zero opposite volume | On | Treat a 0 on the opposite side as an imbalance |
| Filtered single imbalances | Off | Percentile P50–P99 (default P80) |
| Buy / Sell imbalance colors | Theme | Color pickers |
| Stacked imbalance zones | Off | Extends zones from stacked imbalances |
| POC | On | Color #FFB800 |
| Naked POC rays | Off | Extend untested POCs to the right |
| Value area bracket | Off | 50–95% (default 70%) |
| Unfinished auctions | On | |
| Zero prints | Off | |
| Absorption | On | Ratio 1.5–6× average (default 2.5×); Rows at each extreme 1–5 (default 2); colors #00D2FF / #FFA500 |
| Large lot highlight | Off | Threshold 10–2000 (default 100) |
| Setting | Default | Options / range |
|---|---|---|
| Bar statistics grid | On | Rows under the chart, one column per bar |
| Statistics rows | Volume, Delta, Delta %, Min delta, Max delta, Cum. delta | Also: Delta change, Trades, Bid volume, Ask volume, Duration, Volume / sec |
| Show numbers | On | |
| Compact numbers | Preset dependent | 1.2K instead of 1200 |
| Max font size | 11 | 8–14 |
| Intensity relative to | Visible bars | Visible bars, Session, Per bar |
| Candle stem | Left | Left, Center spine, Background, None |
| Stem width | 4 | 2–10 |
| Trade classification | Aggressor side | Aggressor side or Tick rule |
Click a statistics row label on the price axis to collapse the grid.
Reading the signals
- Diagonal imbalance: ask volume on a row compared with bid volume one row below (and the reverse for sell imbalances). It is flagged when the ratio and minimum volume thresholds are met. Several consecutive imbalance rows form a stacked imbalance.
- POC: the row with the most volume in the bar. A naked POC is one later price has not traded back through.
- Unfinished auction: both bid and ask traded at the bar’s extreme, which suggests price may revisit that level.
- Absorption: TickMint first takes the bar’s average volume per traded row (total volume ÷ number of traded rows). In the top N rows (Rows at each extreme), if ask volume on a row is at least the ratio × average and the bar closes below that row, aggressive buyers were absorbed at the high. In the bottom N rows, if bid volume is at least the ratio × average and the bar closes above that row, aggressive sellers were absorbed at the low.
- Delta block / delta zone: a run of rows (or a bar) whose delta is large compared with the average.