Quickstart
This walkthrough takes about five minutes. It assumes TickMint is installed and you have Rithmic credentials from a supported prop firm or broker.
1. Connect your Rithmic account
-
Click the connection status button in the header. If you’re offline, you can also click the Offline chip on any chart. The Connection Manager opens.
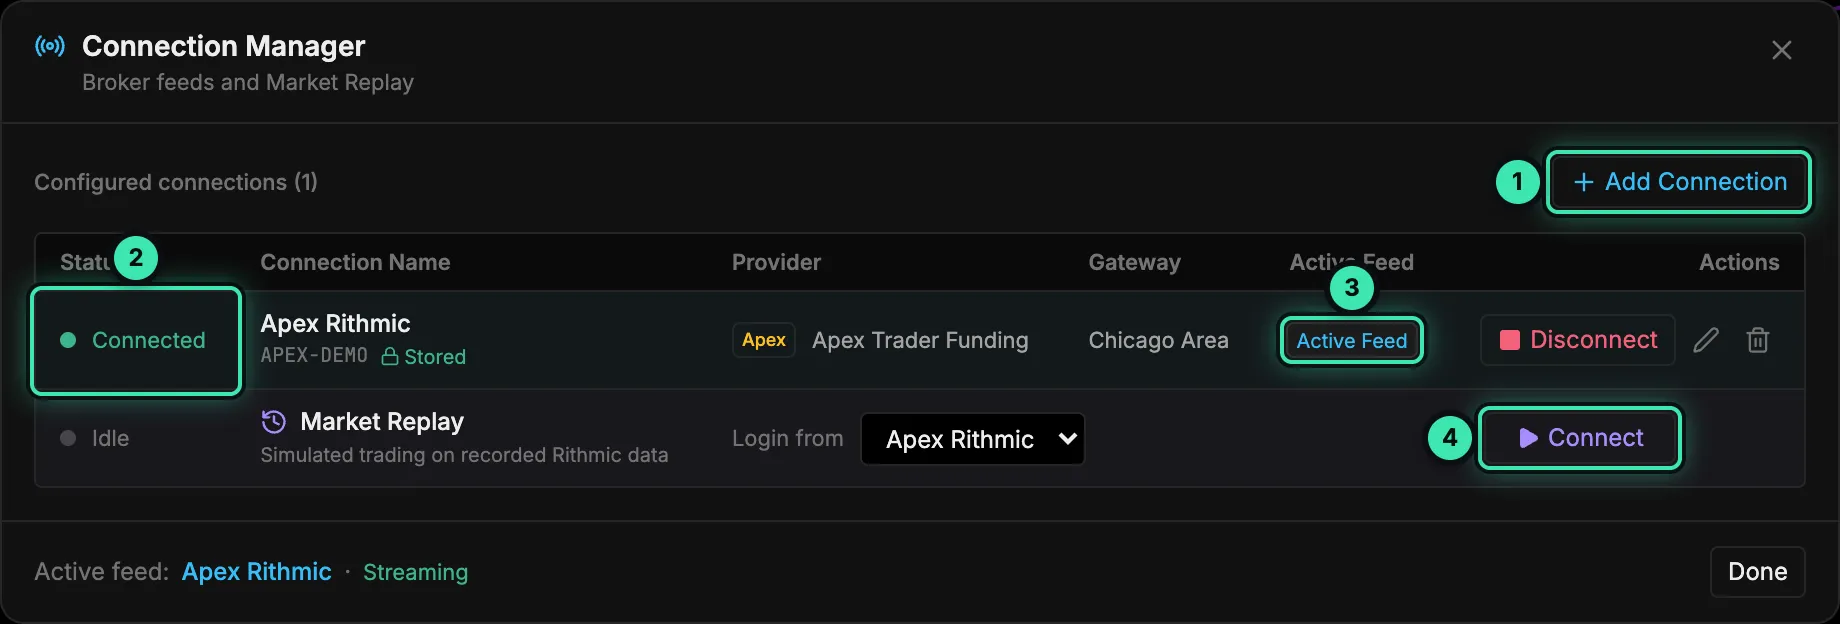
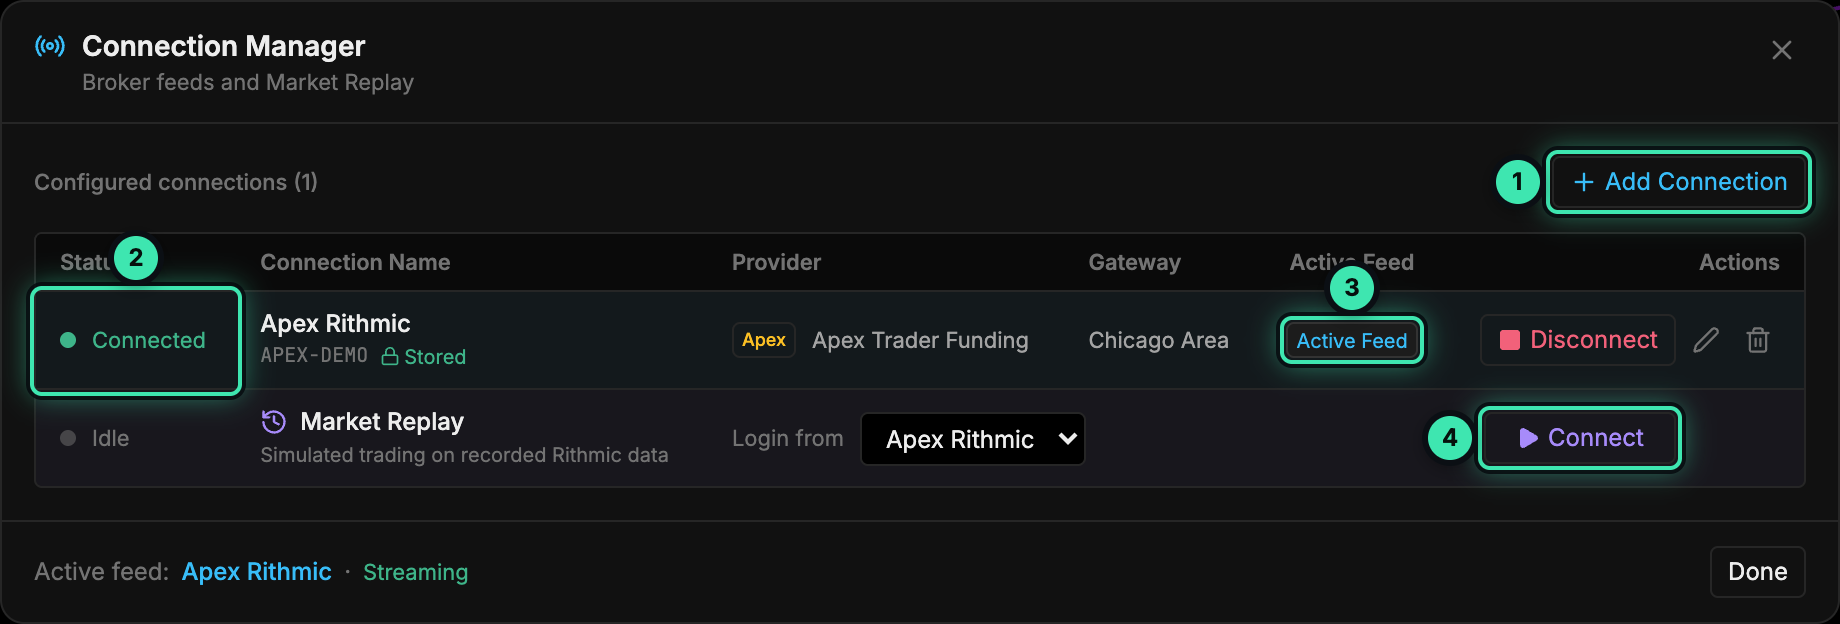
The Connection Manager lists your broker feeds and Market Replay. - + Add Connection: create a new Rithmic login.
- Status: Connected, Connecting… or Disconnected.
- Active Feed: the connection that streams market data to charts.
- Market Replay: start simulated trading on recorded data.
-
Click + Add Connection.
-
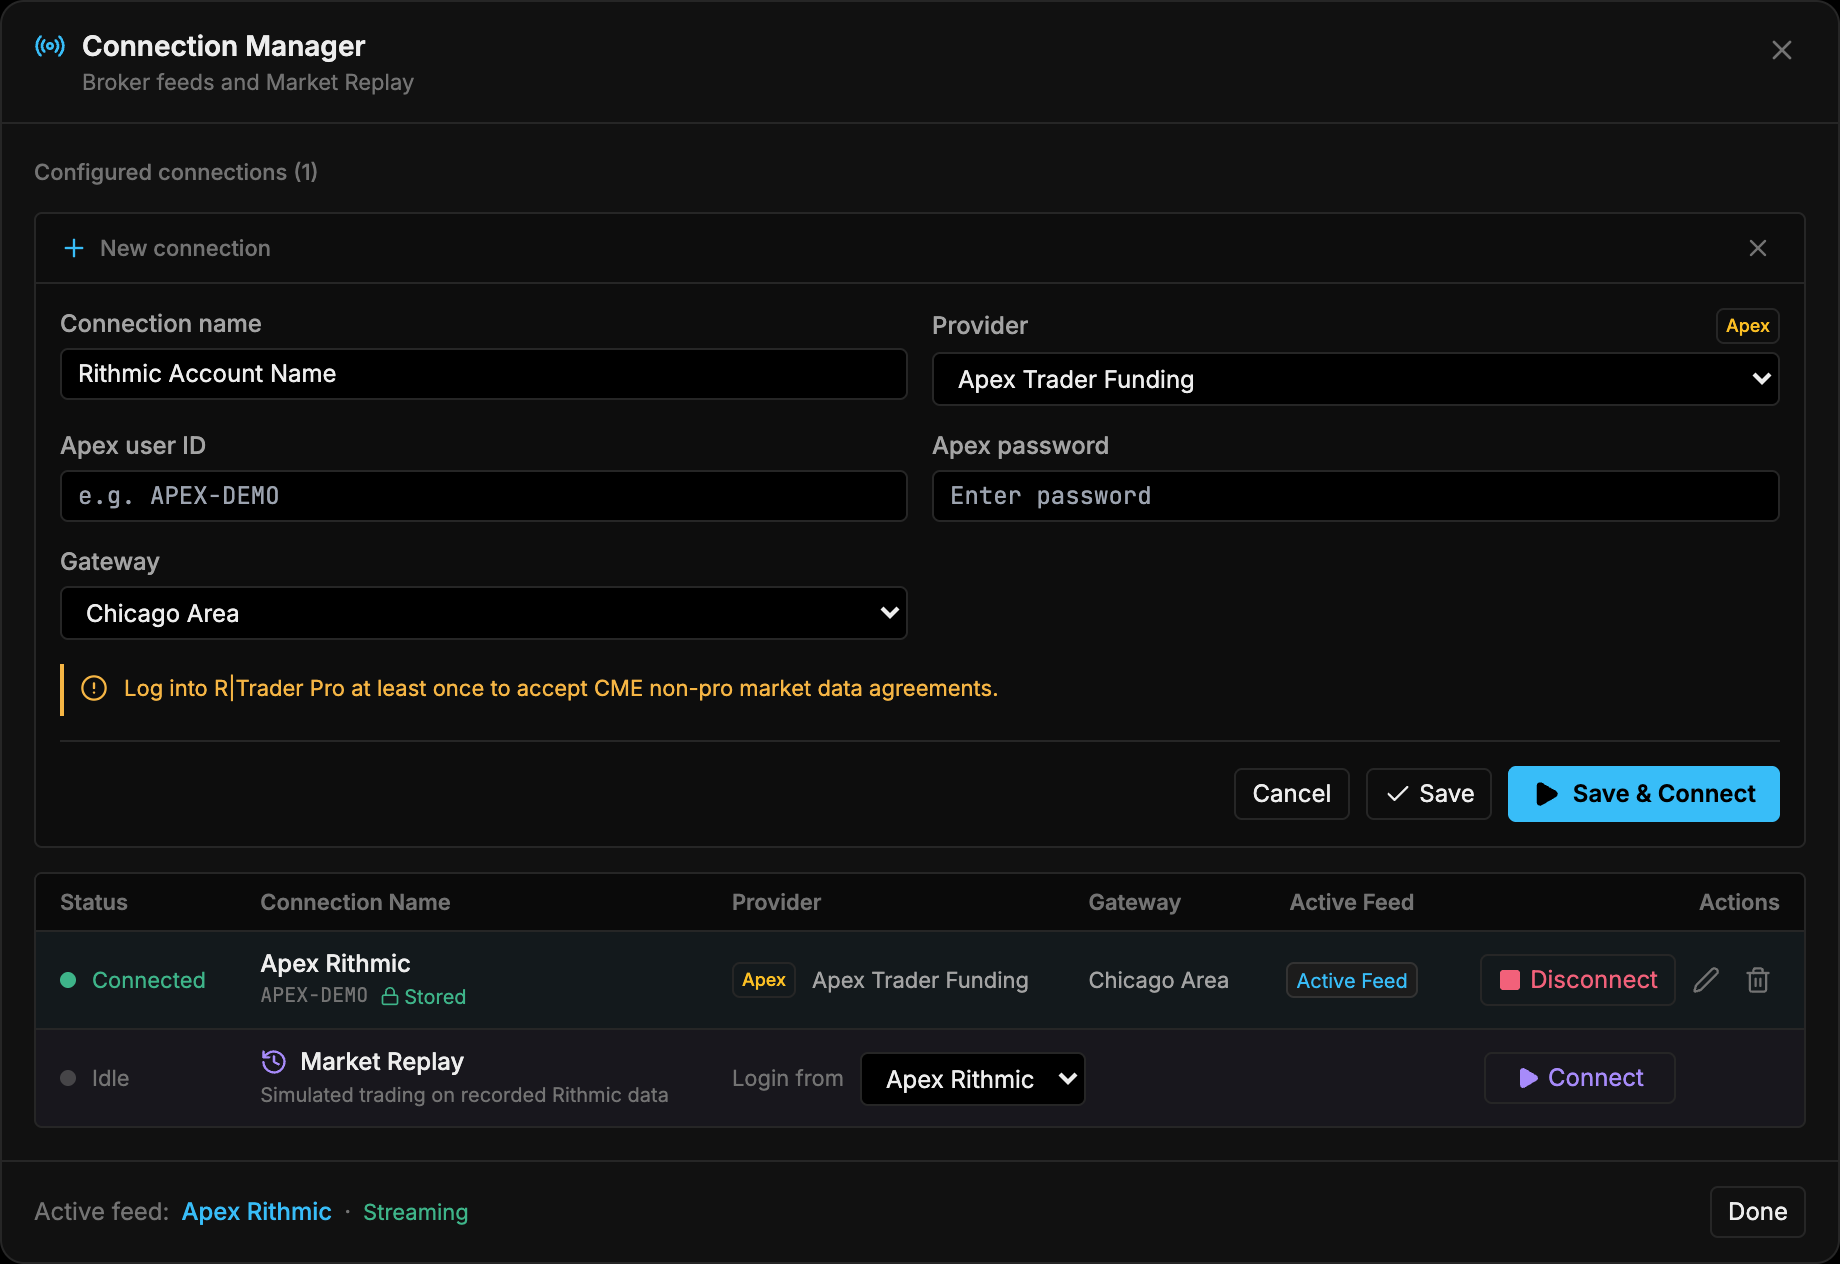
Enter a Connection name, pick your firm in Provider, then enter your user ID and password. Leave Gateway on Chicago Area unless your firm tells you otherwise.
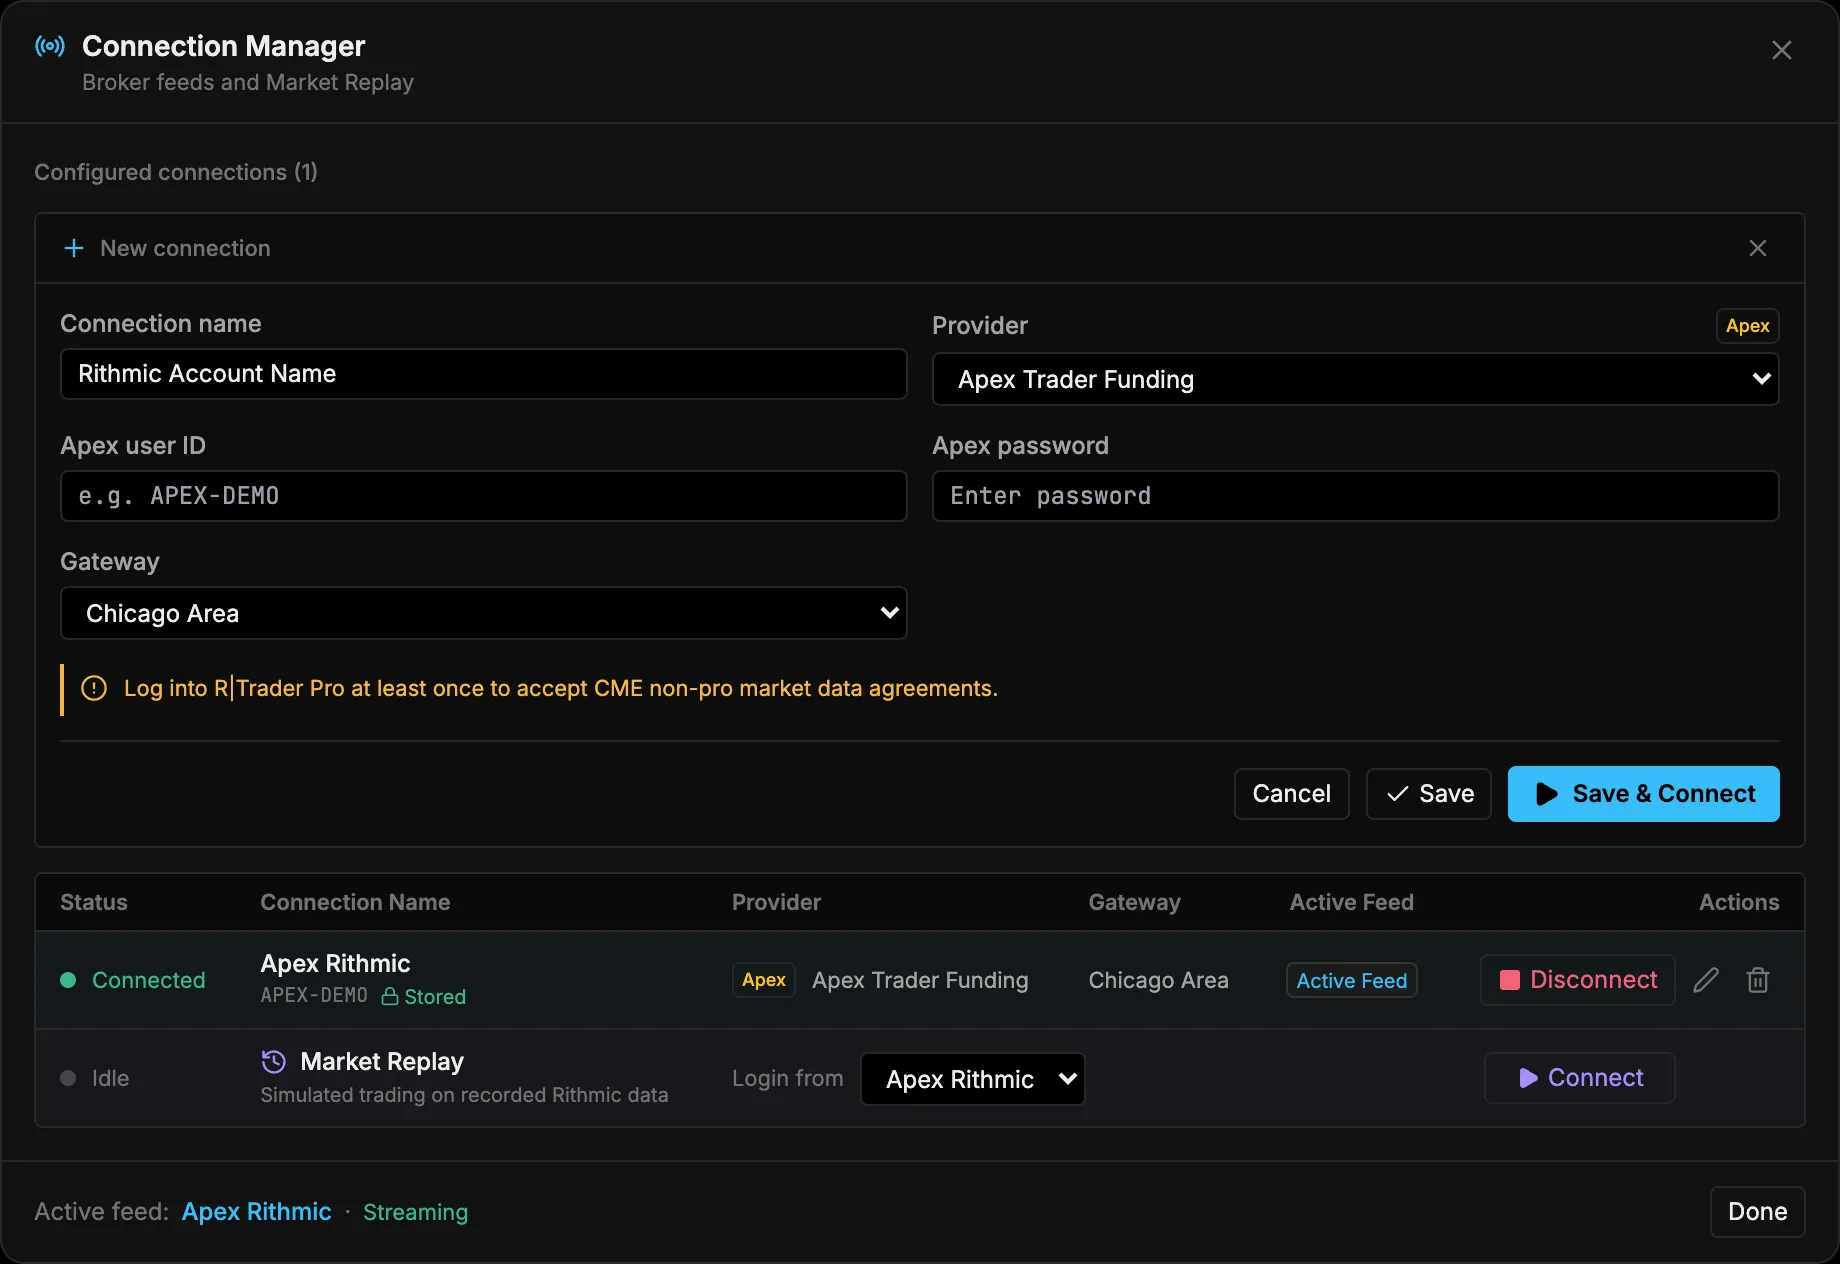
The new connection form. The Rithmic system is filled in from the provider you pick. -
Click Save & Connect. The status changes to Connected and charts start streaming.
2. Select SIM-1
-
Click the account switcher in the header (it shows the account name and balance).
-
Under Paper Trading, pick SIM-1. Your broker accounts are listed below it, grouped by connection.
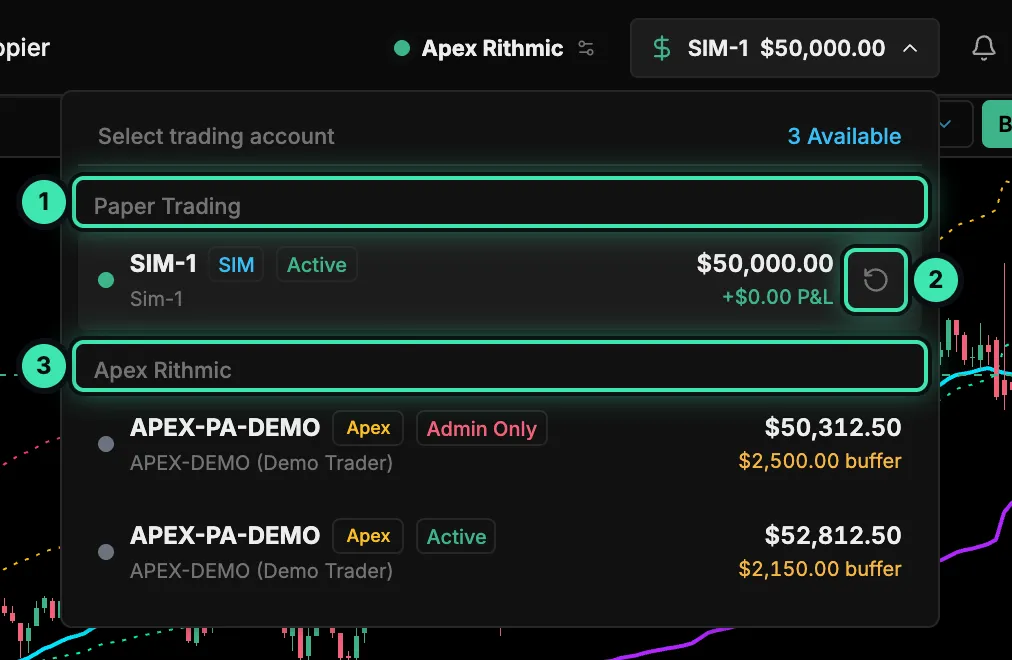
The account menu. SIM-1 is the built-in paper account. - Paper Trading: the built-in SIM-1 account.
- ↻ Reset the SIM-1 balance.
- Broker accounts from your Rithmic connection.
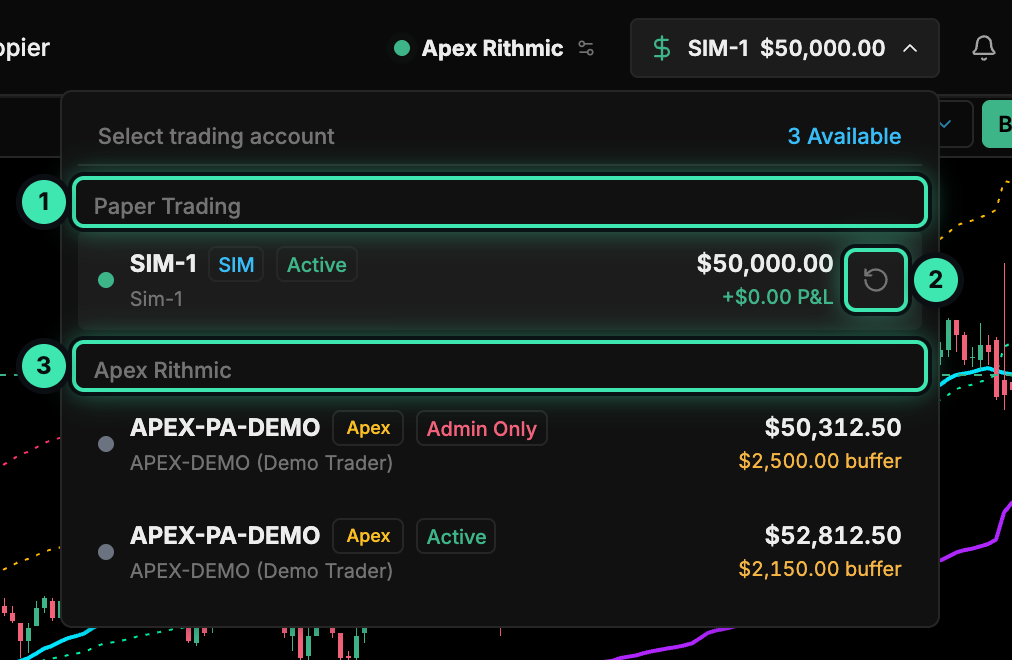
SIM-1 starts with $50,000 and fills against live market data. See SIM mode for how fills work.
3. Open a chart
-
Click the instrument name in the chart panel header, or press Ctrl/⌘+I.
-
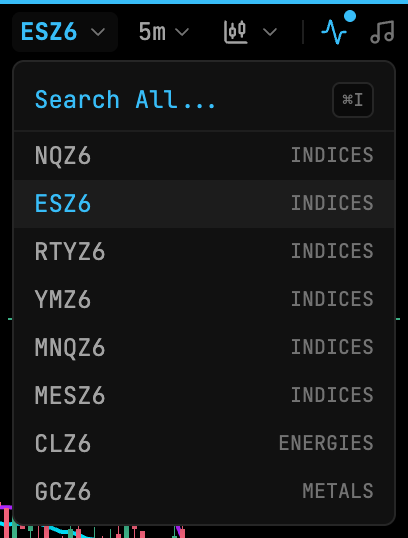
Search for an instrument, for example
ESorNQ, and select it.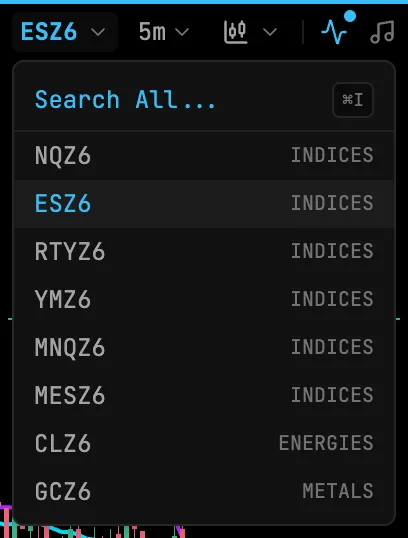
Instrument search. -
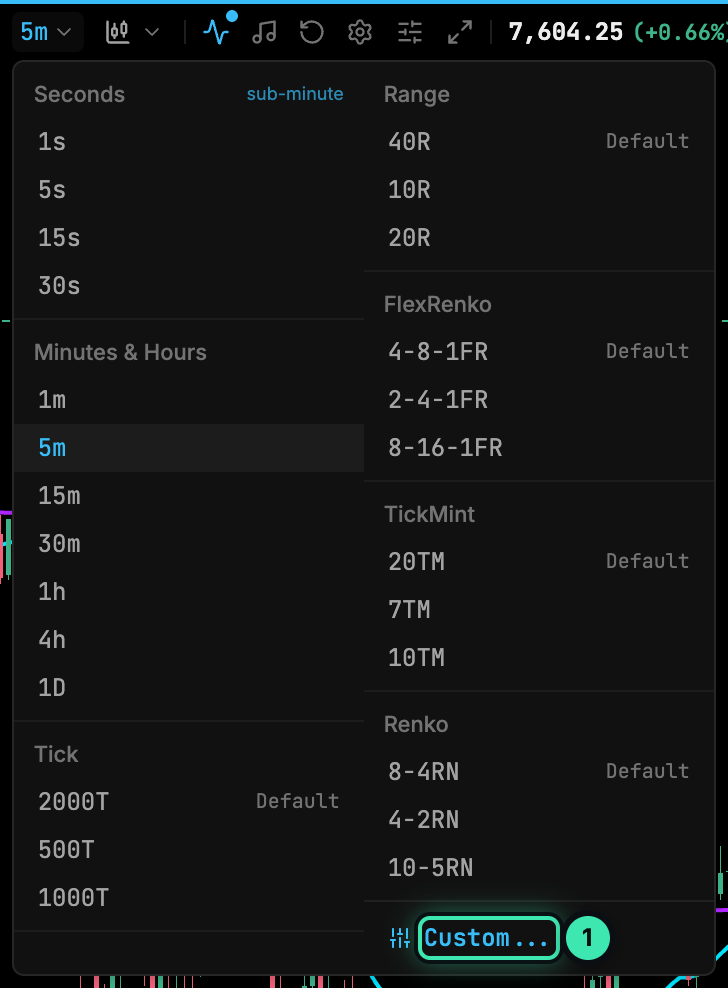
Click the timeframe button next to it and pick a timeframe, for example 5m.
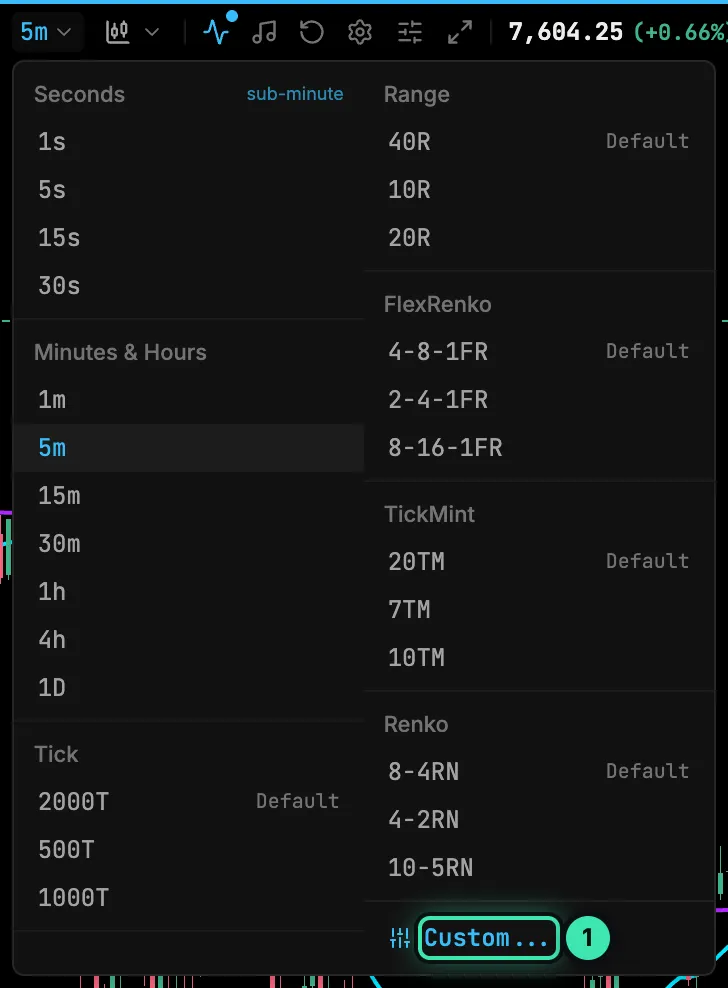
The timeframe menu.
4. Add an indicator
-
Click Indicators in the chart panel header.
-
Search the library (for example
VWAP) and click Add. The indicator shows up under Active on chart. -
Select the active indicator to change its settings on the right. Changes apply immediately. Close the modal when you’re done.
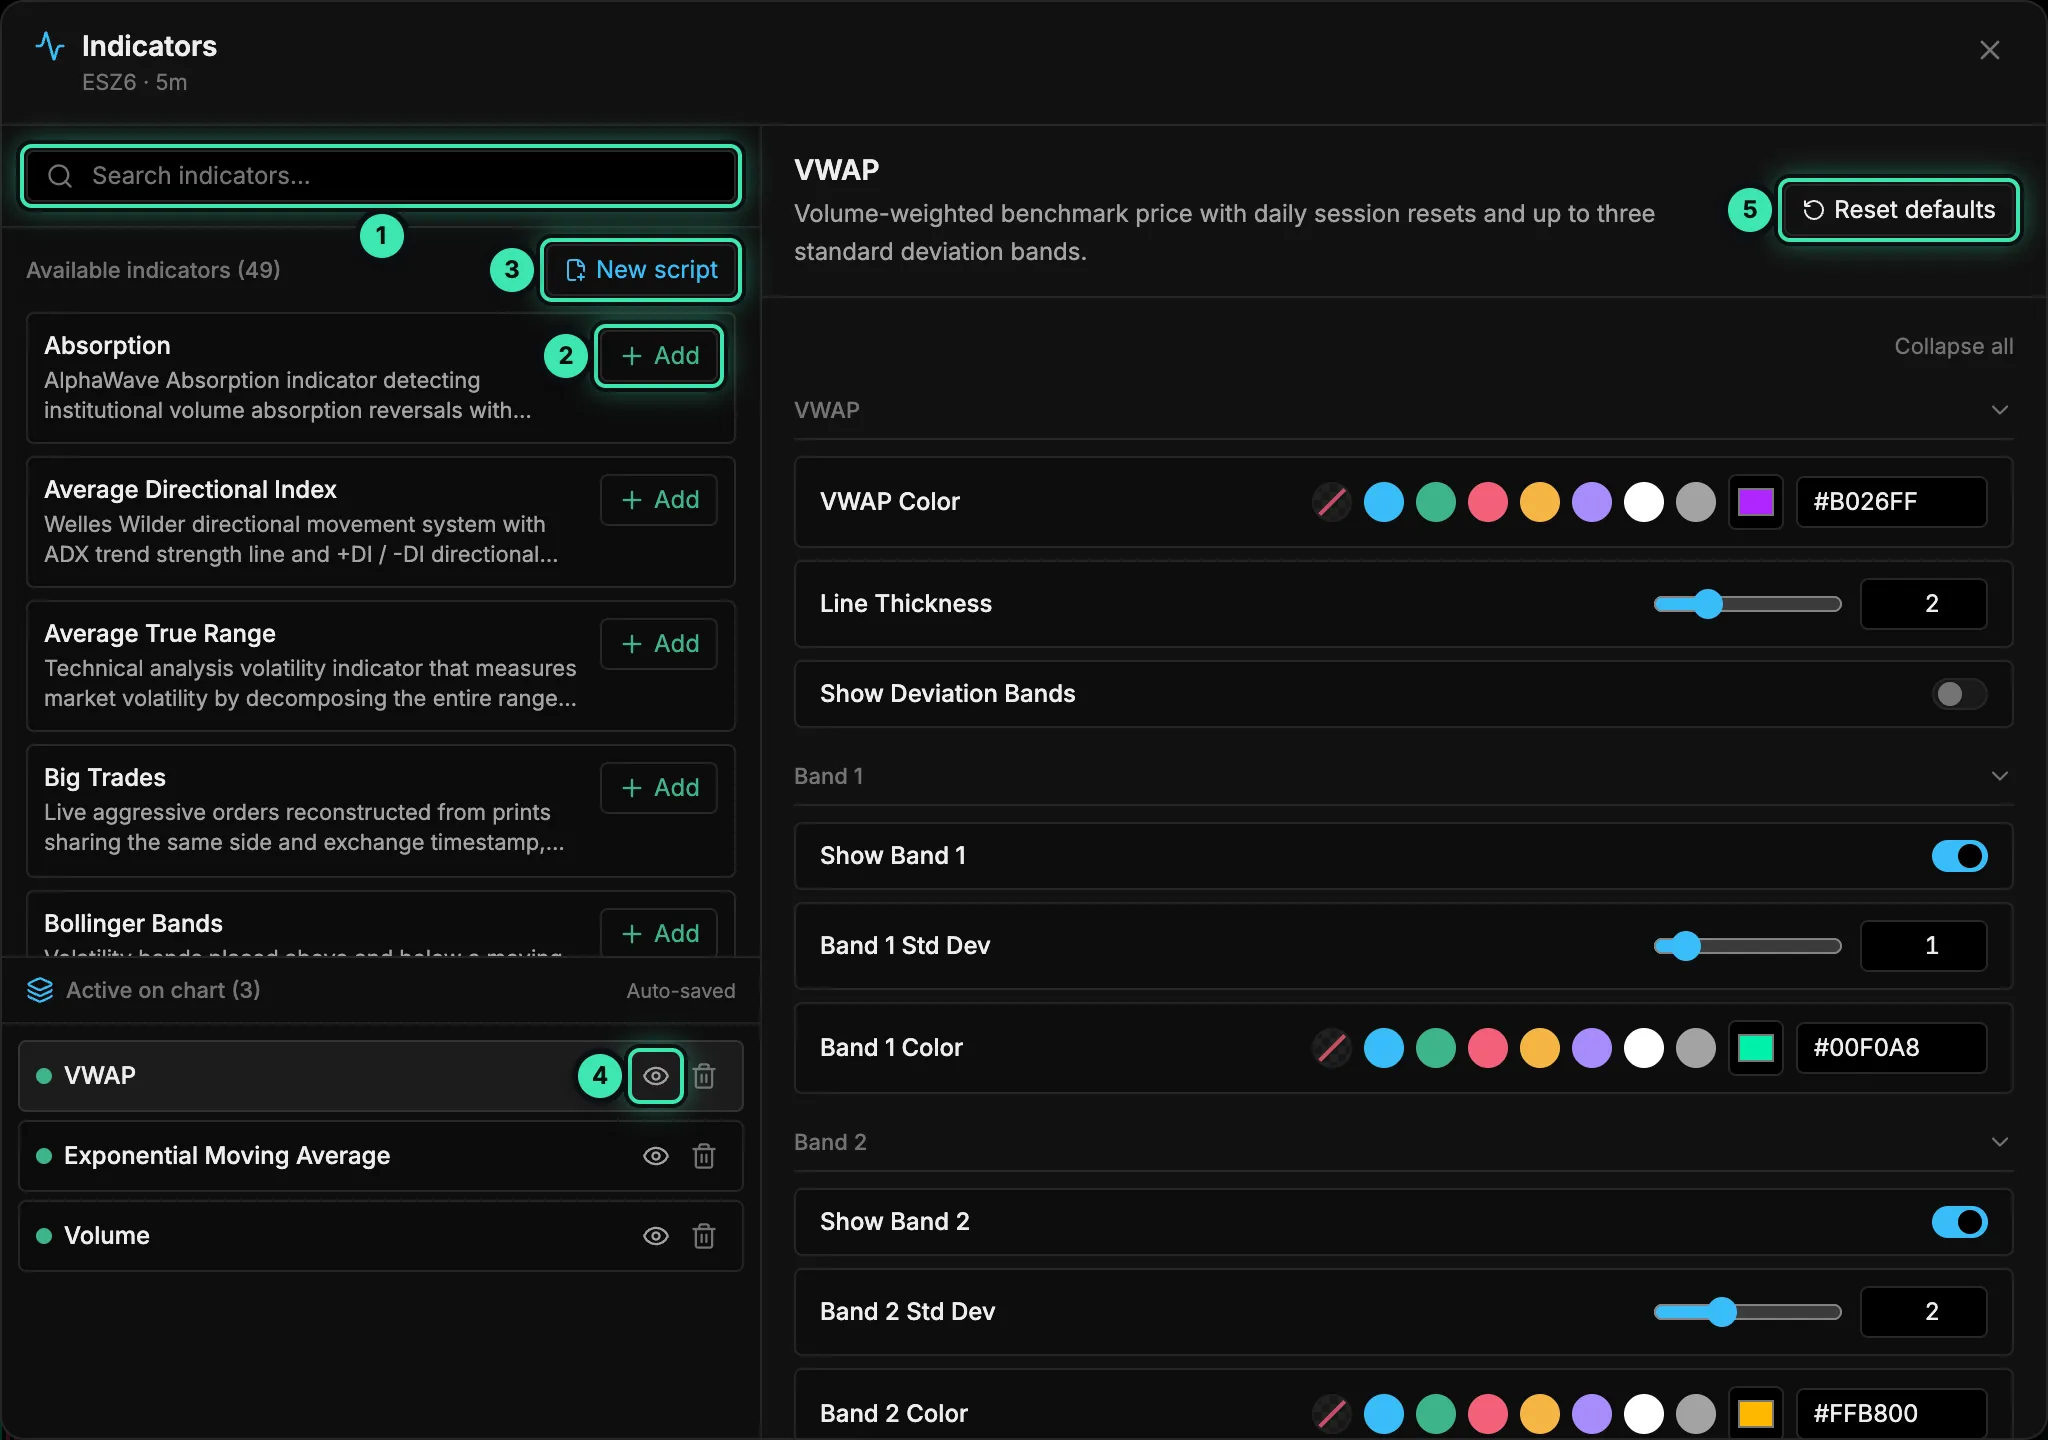
The Indicators modal: library, active indicators and settings.
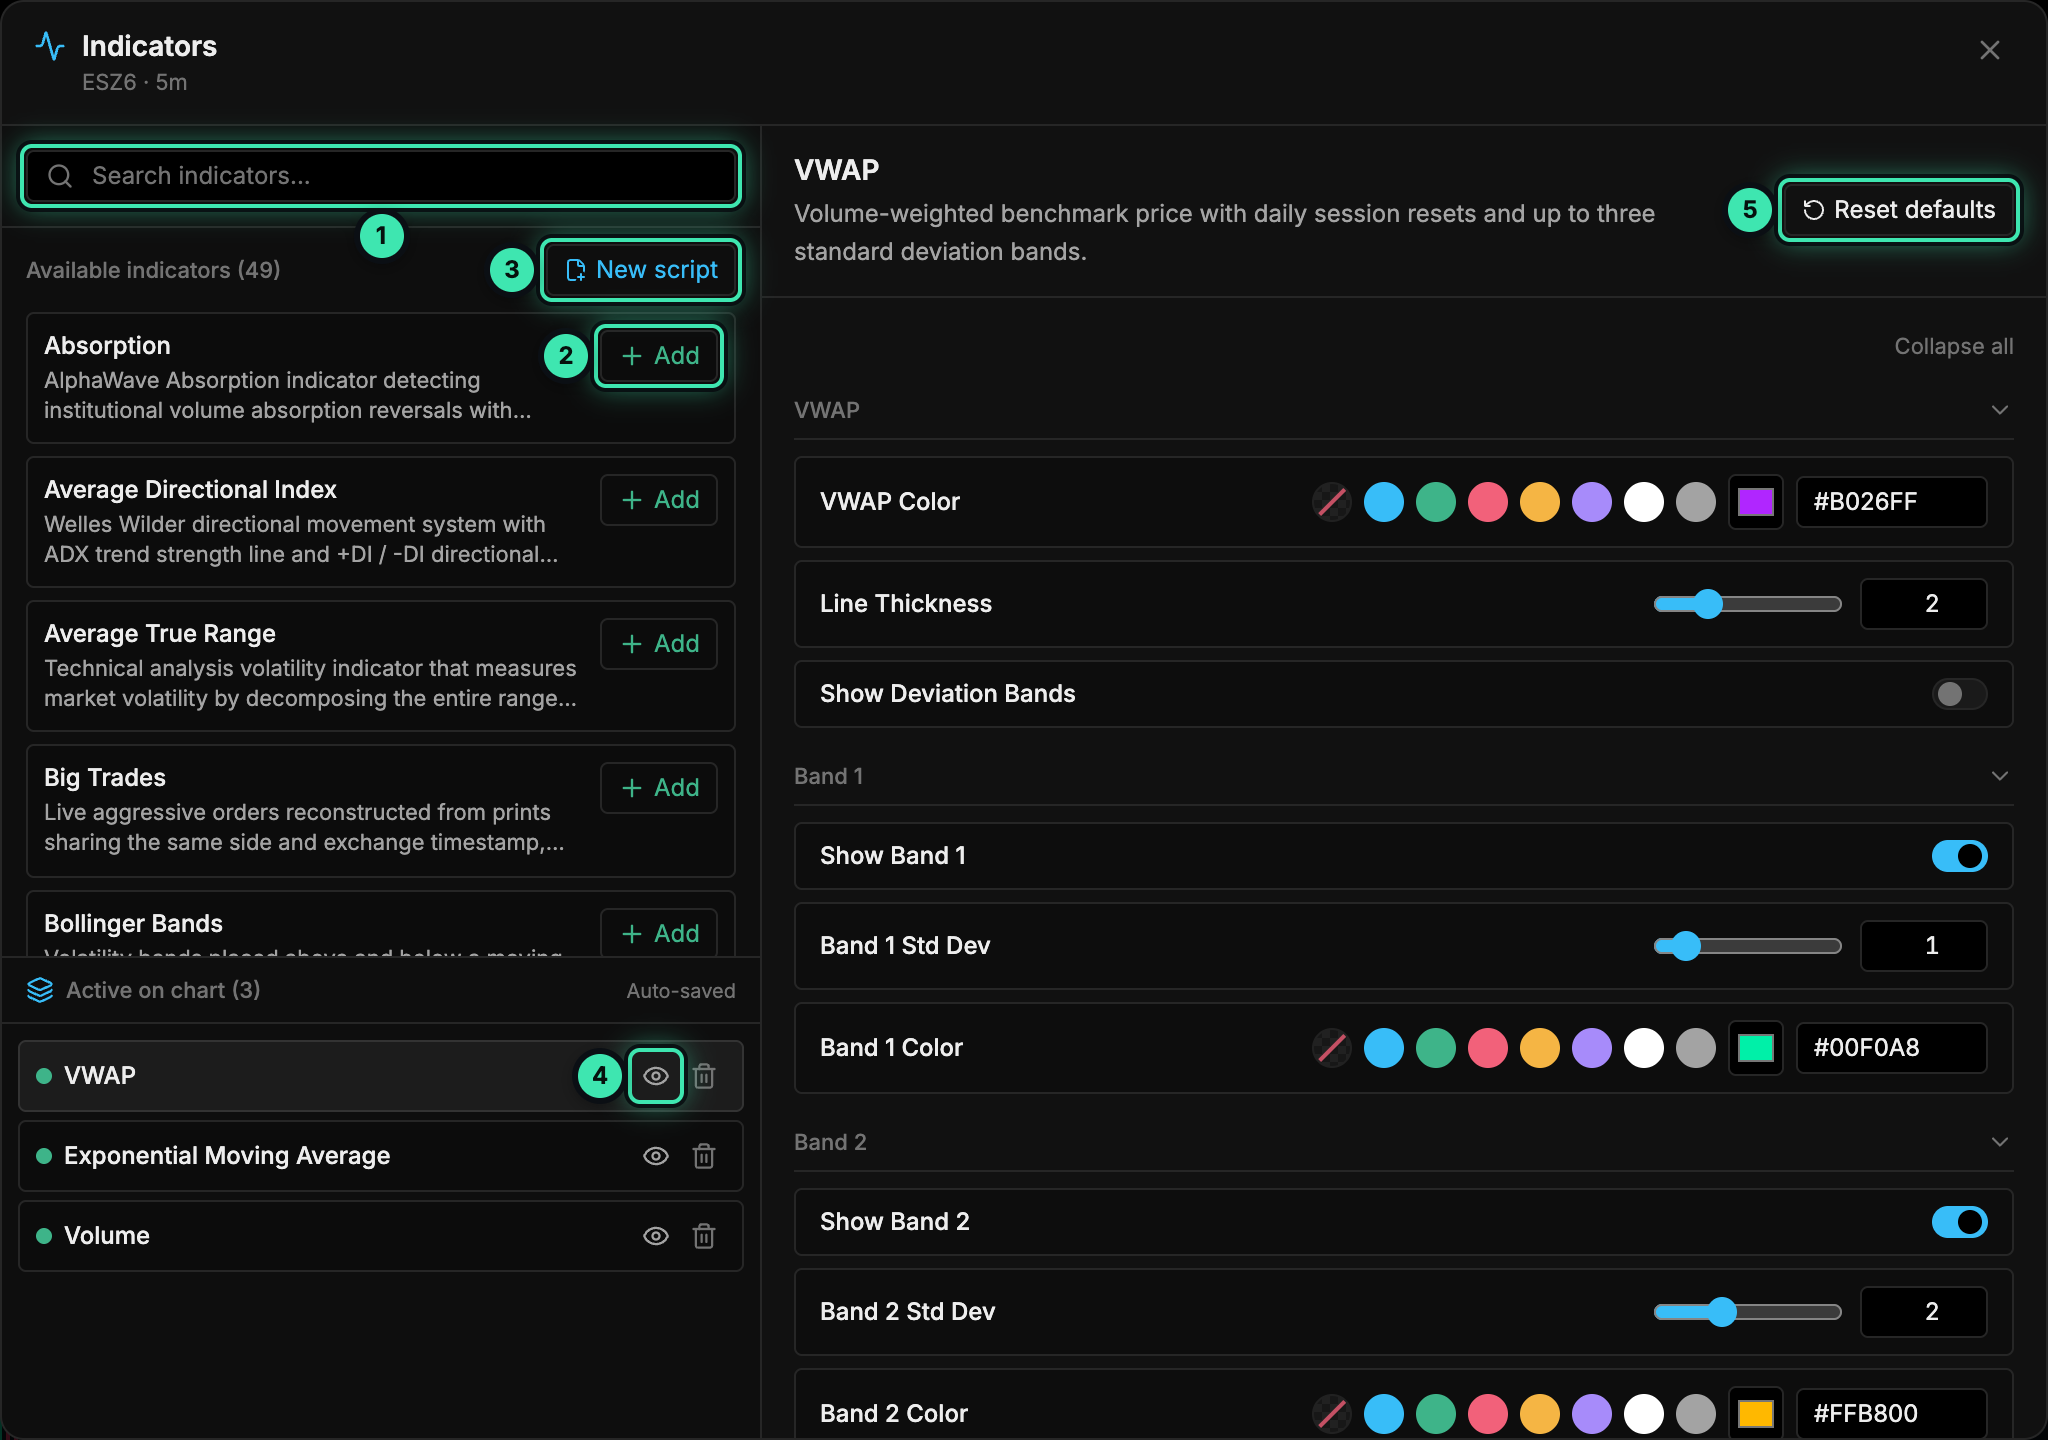
Browse what’s available in Indicators.
5. Place a SIM order
Confirm the header shows SIM-1, then use any of these:
From the DOM ladder
- Left-click the order-entry column at a price to place a limit order. Prices at or below the bid buy; prices at or above the ask sell.
- Right-click the order-entry column to place a stop order. Buy stops must be above the ask and sell stops below the bid.
- Use Buy Mkt / Sell Mkt for market orders and Flatten to close the position and cancel orders.
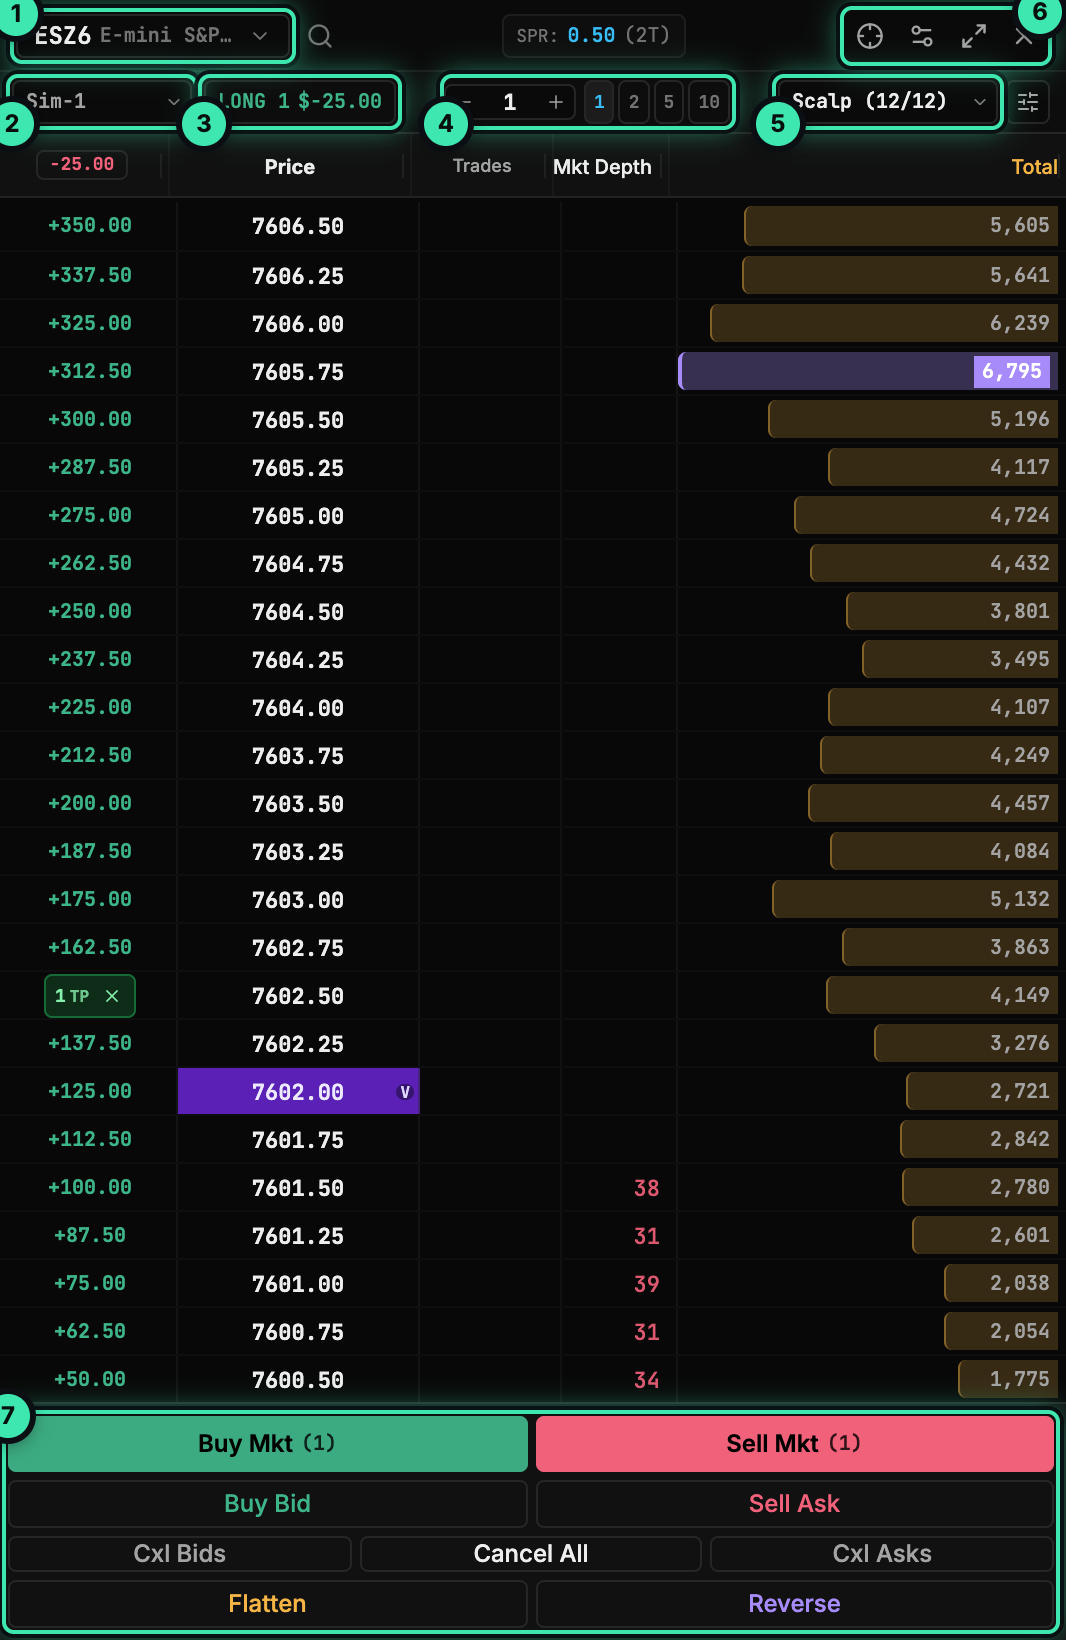
From the chart
- Right-click the plot at a price for Buy Limit / Sell Stop (below the market), Sell Limit / Buy Stop (above it), or Buy Market / Sell Market.
- Press Shift+T to open the Trade Panel on the active chart.
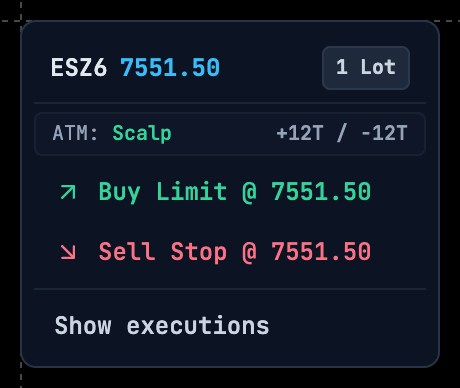
Working orders show as lines on the chart. Drag a line to move the order. Positions, orders and fills appear in the trading dock.