Volume Profile Explained: POC, Value Area, HVN and LVN
How a volume profile works: the POC, how the 70% value area is calculated, VAH and VAL, HVNs and LVNs, profile shapes and how traders use prior-day value.
By TickMint Team Published 8 min read Intermediate
Key takeaways
- A volume profile shows how many contracts traded at each price, so it measures activity by price rather than by time.
- The POC is the price with the most volume, and the value area is the range around it that holds about 70% of the volume.
- The value area is built outward from the POC, and platforms differ in the details, so the same session can show slightly different VAH and VAL levels.
- Price has tended to slow down around high volume nodes and move quickly through low volume nodes, but these are tendencies, not rules.
- Many traders compare the open with the prior session's value area to frame the day; it gives context, not a signal.
On this page
- What is a volume profile?
- Session, composite, visible-range and anchored profiles
- What is the point of control (POC)?
- How is the value area calculated?
- What are VAH and VAL?
- HVN vs LVN: how does price behave around them?
- What do volume profile shapes mean?
- Volume profile vs TPO (Market Profile)
- How traders use prior-day value
- Common mistakes with volume profile
- Putting it together
A volume profile is a horizontal histogram that shows how many contracts traded at each price over a chosen period. Its key levels are the point of control (POC), the price with the most volume, and the value area, the range around the POC that holds about 70% of the volume, bounded by the value area high (VAH) and value area low (VAL). High volume nodes (HVNs) mark prices the market accepted, and low volume nodes (LVNs) mark prices it moved through quickly.
What is a volume profile?
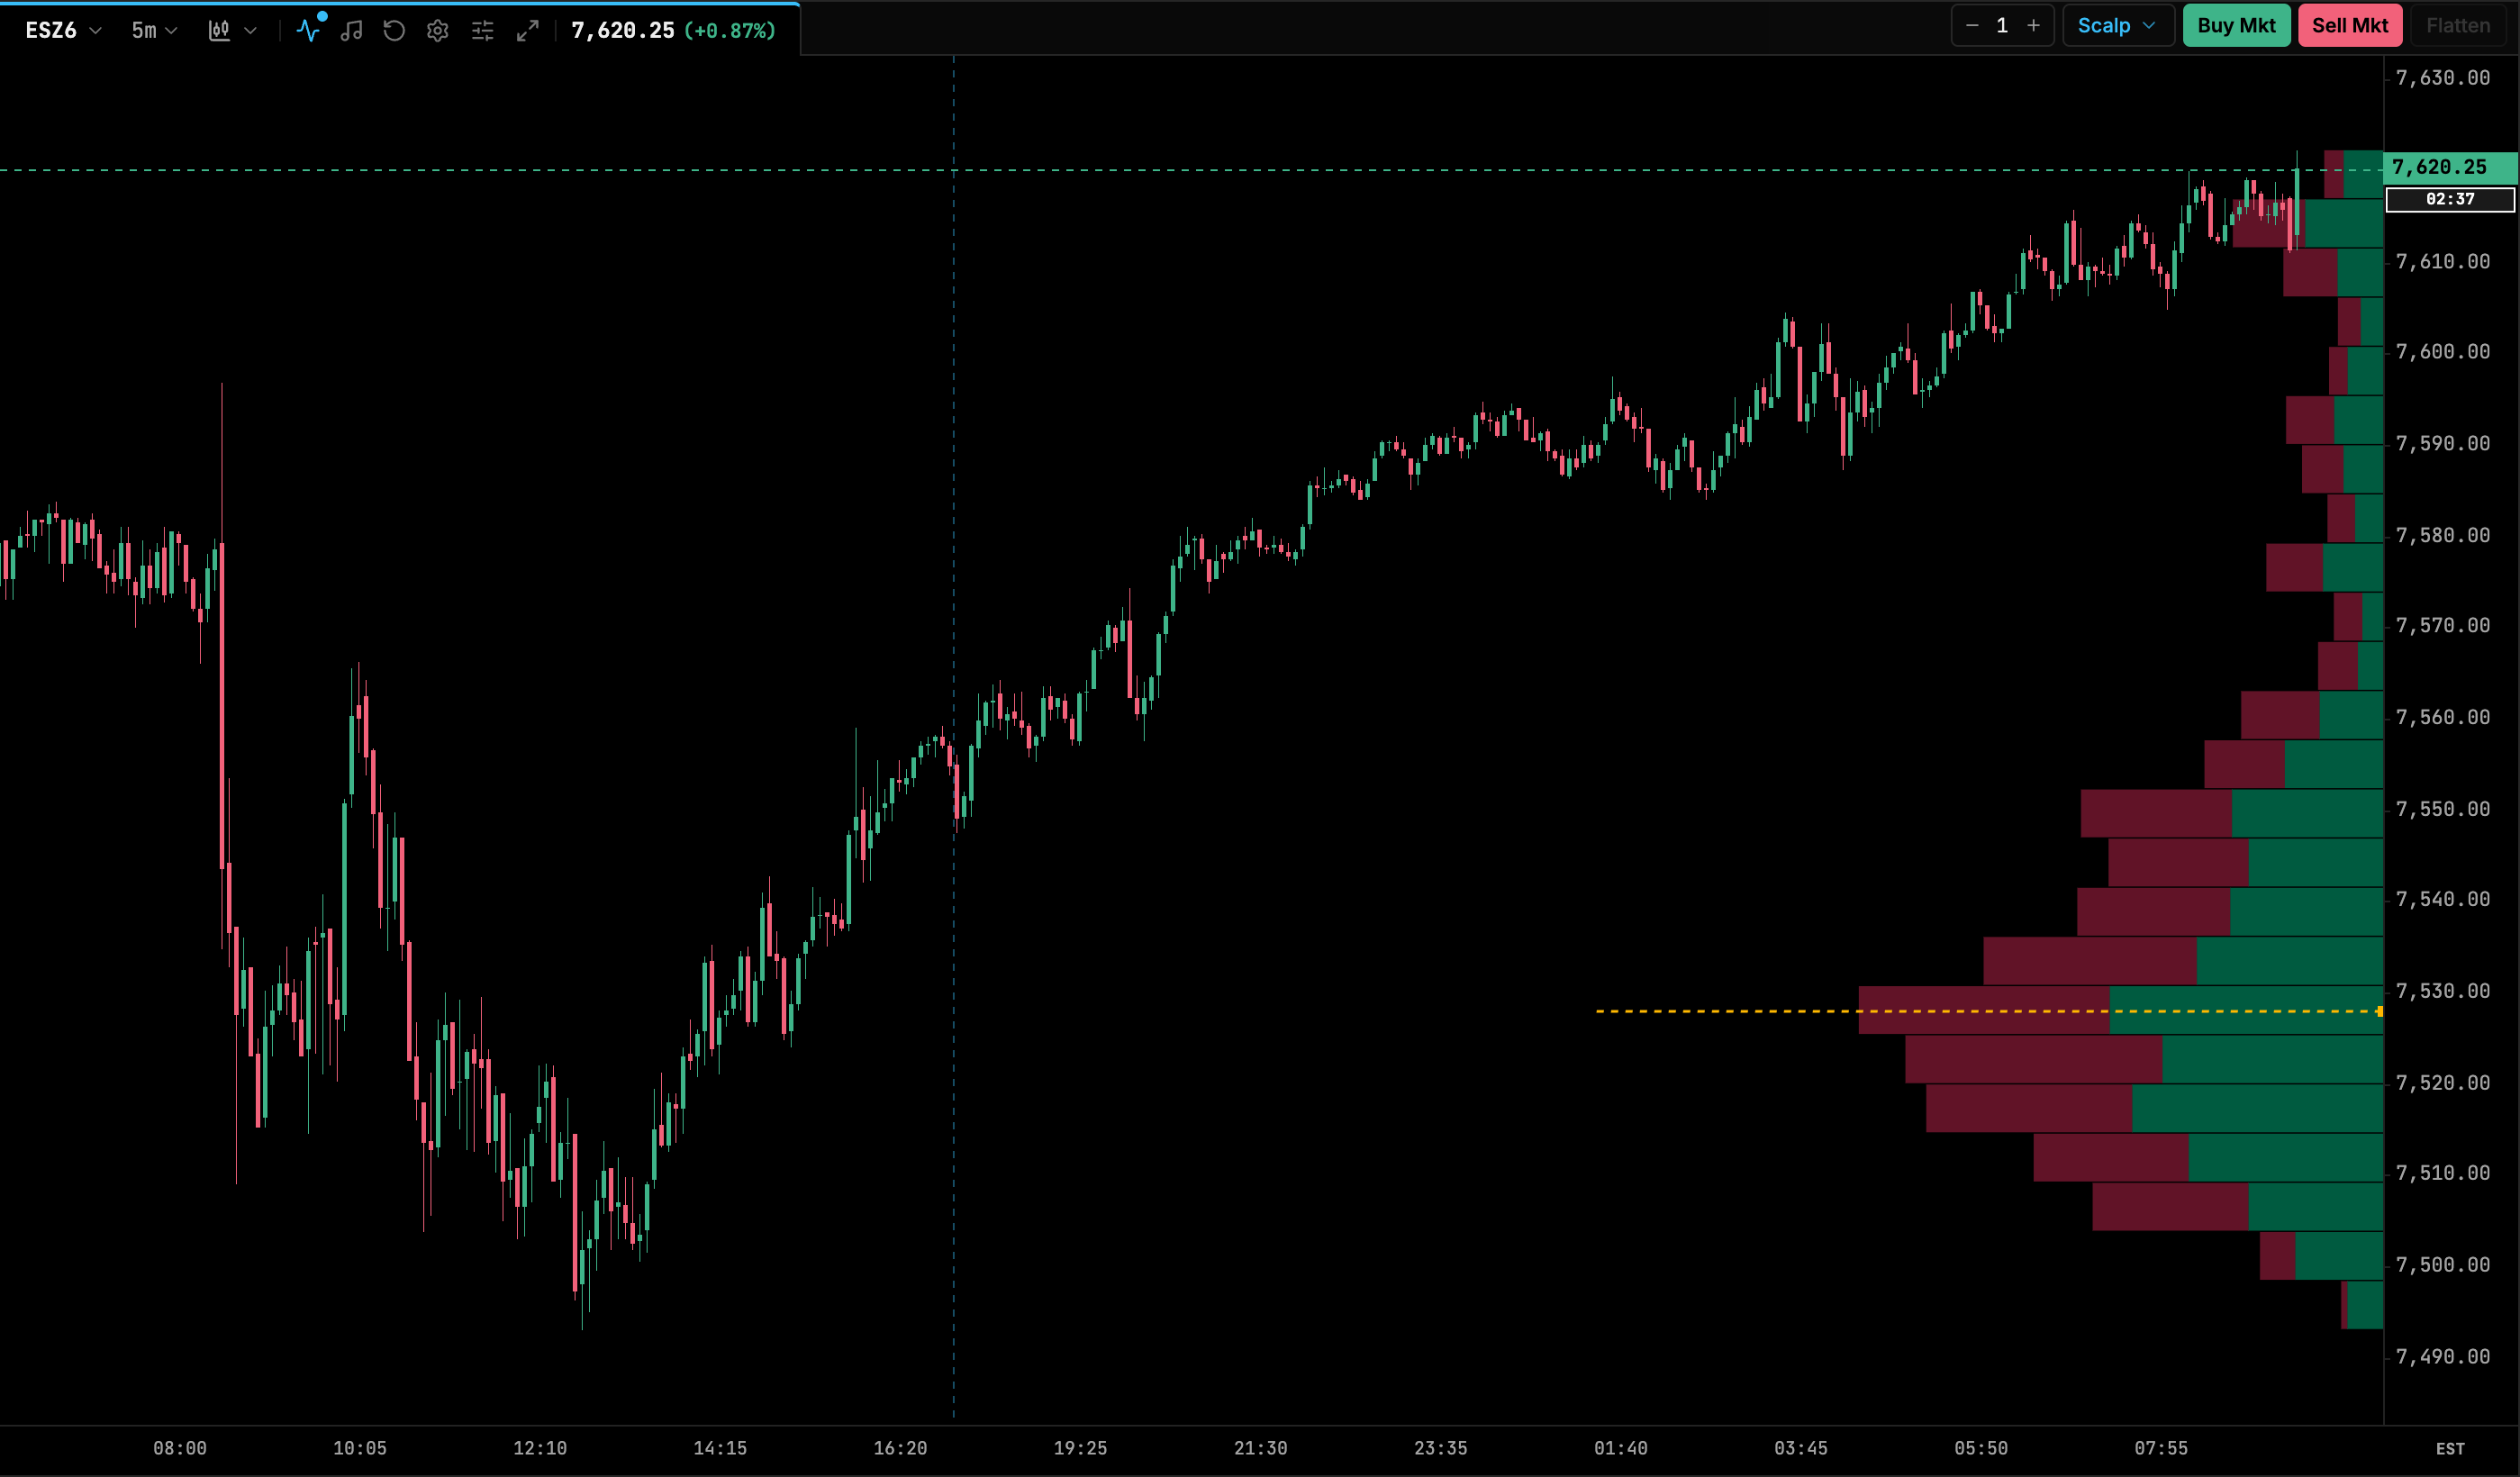
A normal volume bar tells you how much traded during a period of time. A volume profile turns that sideways: it adds up the volume at each price and draws it as a bar extending from the price axis. Long bars are prices where a lot of business was done. Short bars are prices the market passed through quickly.
That makes it a map of where the auction spent its effort. Time doesn’t appear on the profile at all. A level that traded heavily for twenty minutes at 9 a.m. and a level that traded heavily for twenty minutes at noon look the same.
Two practical details change what you see:
- Row size. Profiles group prices into rows. A row can be one tick, or several ticks grouped together. Bigger rows give a smoother shape and hide fine detail.
- Data source. Some profiles use the exact volume at each price from tick data. Others spread each bar’s volume evenly across its high–low range. The second method is an approximation and can blur the POC on fast bars.
Session, composite, visible-range and anchored profiles
The profile only describes the bars it includes, so the first question is always “which bars?”.
| Profile type | What it covers | Typical use |
|---|---|---|
| Session | One trading session, either the full electronic session or regular trading hours only | Daily reference levels: the prior day’s POC, VAH and VAL |
| Composite | Several sessions combined (a week, a month, a contract’s life) | Longer-term areas of acceptance and the gaps between them |
| Visible range | Whatever bars are on screen; it recalculates when you scroll or zoom | Quick reads while you look around a chart |
| Anchored | From a bar you choose (a swing low, a news candle) to now | Measuring a specific move or event |
Session profiles depend on how the session is defined. A full-session profile for an equity index future includes the overnight hours, while an RTH-only profile starts at the regular open, so the two can show different POCs on the same day. The futures trading hours guide explains how the sessions are split.
What is the point of control (POC)?
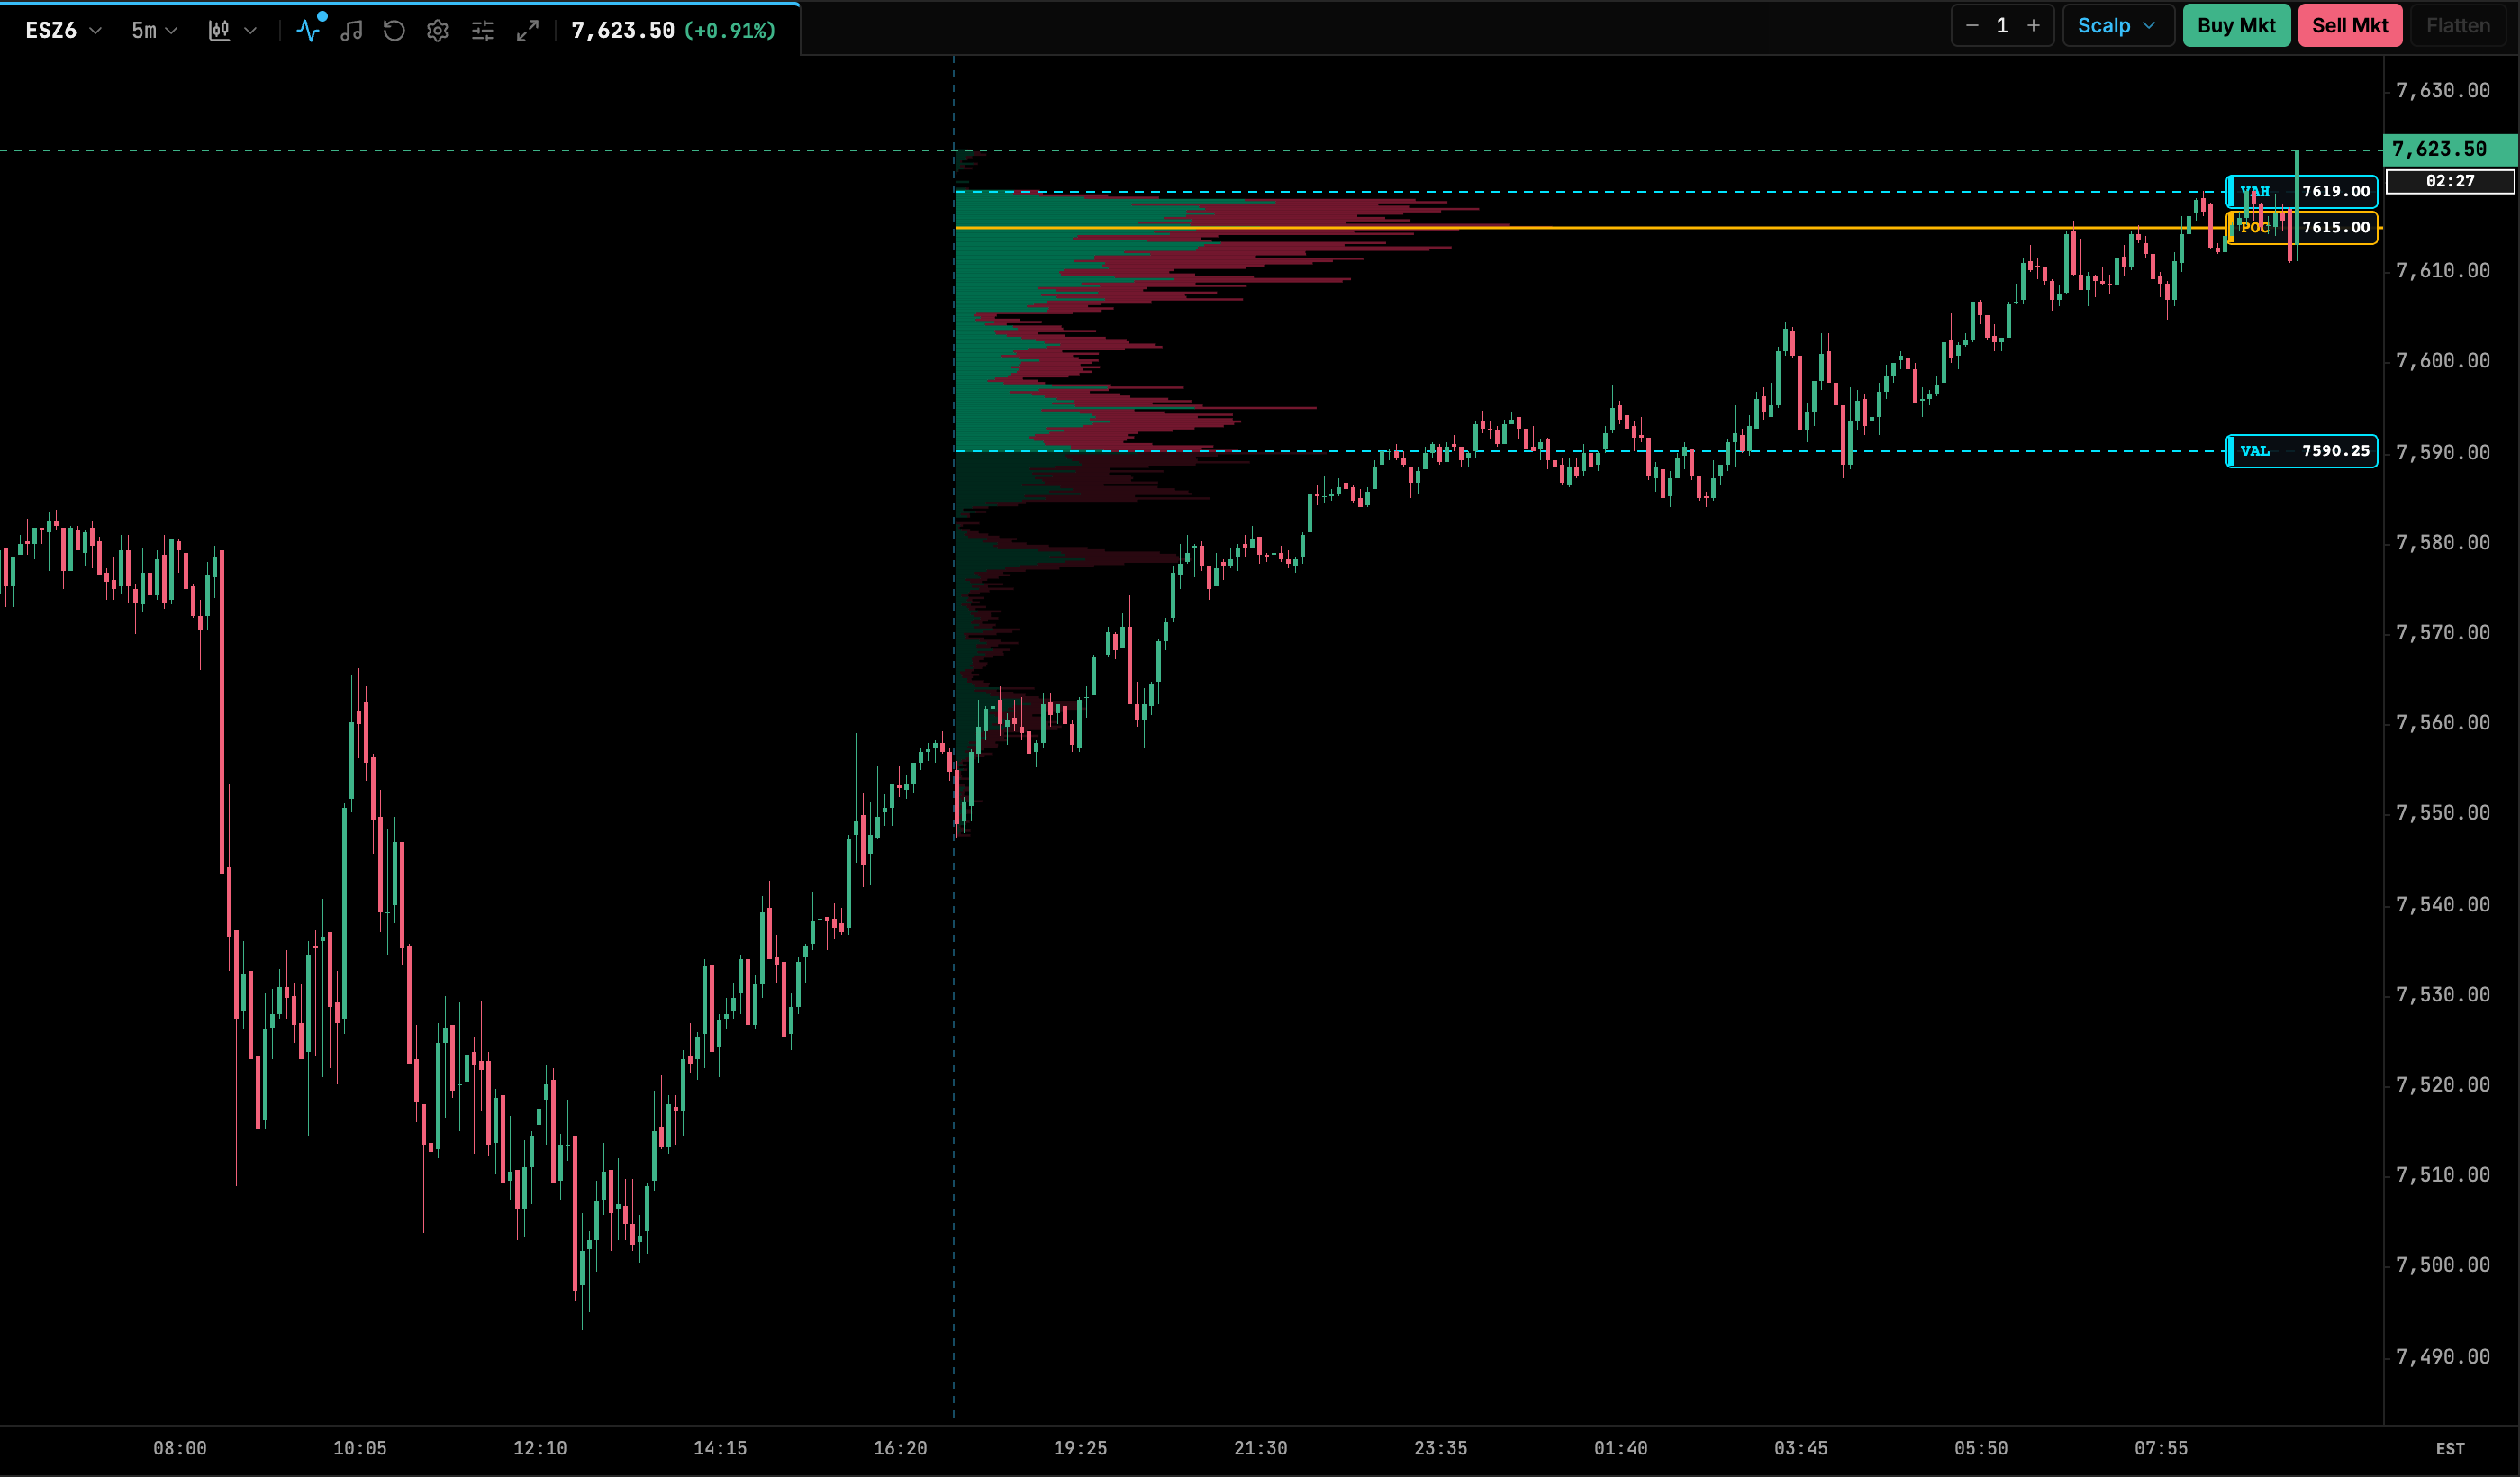
The point of control is the single row with the most volume. Traders often read it as the price the market found fairest during that period, because it’s where buyers and sellers most willingly traded.
A few points to keep in mind:
- The POC can move during the session. A developing POC that keeps shifting up suggests acceptance at higher prices; one that stays put suggests balance.
- When two rows have almost the same volume, the POC can jump between them. Small differences in row size or data source can change which one wins.
- A prior session’s POC that later price hasn’t traded back through is sometimes called a “naked” or “virgin” POC. Some traders watch these as reference levels.
How is the value area calculated?
The value area is the range of prices around the POC that holds a set share of the period’s volume, usually 70%.
The 70% figure is borrowed from Market Profile. In a normal distribution, about 68% of observations fall within one standard deviation of the mean, and 70% is the rounded convention. Real profiles are rarely normal, so treat 70% as a convention rather than a statistical truth. Most platforms let you change it.
The common way to build it:
- Start at the POC.
- Compare the volume of the row just above the current range with the row just below it.
- Add whichever is larger to the value area.
- Repeat until the value area holds at least 70% of the total volume.
A widely used variant compares pairs of rows (the two rows above against the two rows below) instead of single rows. Platforms also differ on how they break ties and on row size. Because of this, two platforms can show a VAH or VAL a tick or two apart for the same session, and neither is wrong.
What are VAH and VAL?
The value area high (VAH) and value area low (VAL) are the top and bottom edges of the value area. They mark where the bulk of trade ended and the thinner tails began.
Traders use them as reference points, not as walls. A common reading is that prices above the VAH were relatively expensive for that session and prices below the VAL relatively cheap, because less volume was willing to trade there. When price returns to a prior session’s VAH or VAL, traders watch whether it’s accepted (trades and builds volume there) or rejected (moves away quickly).
HVN vs LVN: how does price behave around them?
The diagram shows a double-distribution profile with illustrative data. There are two humps of volume, each a high volume node: the larger upper one holds the POC, and the lower one is the second HVN. Between them is a thin area, a low volume node. Notice that the shaded value area runs from the upper hump, across the LVN, and into the lower hump. A value area can contain thin prices; it’s a volume count, not a judgment about each row.
High volume nodes are prices where the market spent a lot of trade. Price has tended to slow down and rotate around them, because both sides were willing to do business there before. An HVN that price returns to can act like a magnet or a congestion zone.
Low volume nodes are prices the market moved through quickly, often during a fast push. Price has tended to move through them quickly again, or to reject them, because few participants found those prices acceptable. Many traders treat an LVN as the boundary between two areas of value.
These are tendencies. A news release, a change in participation or a new session can make price ignore any node. Treat nodes as places to watch closely, not as levels that will hold.
What do volume profile shapes mean?
The shape of a session profile summarizes how the day’s auction went. The common labels:
| Shape | What it looks like | How traders often read it |
|---|---|---|
| D | Fat in the middle, thin at both ends, roughly symmetrical | Balance: two-sided trade around a fair price |
| P | Volume concentrated near the top, thin tail below | Price moved up and then built value higher; often linked with short covering or buyers in control late in the session |
| b | Volume concentrated near the bottom, thin tail above | The mirror image: price moved down and built value lower; often linked with long liquidation |
| Double distribution | Two HVNs separated by an LVN | Price accepted one area, then moved and accepted another |
Shapes are descriptions of what already happened. A P-shaped day doesn’t tell you the next day will go up. It does tell you where value was built, which is useful context for the next session.
Volume profile vs TPO (Market Profile)
A TPO chart (Market Profile) measures time. It stacks a letter for every period, usually 30 minutes, in which price traded at each level. A volume profile measures contracts.
| Volume profile | TPO / Market Profile | |
|---|---|---|
| Counts | Contracts traded at each price | Time periods in which each price traded |
| POC | Price with the most volume | Price touched in the most periods |
| Shows | Where the business was done | Where the market spent its time |
| Best at | Spotting heavy and thin volume areas | Reading the day’s structure period by period |
The two usually look similar, but they can disagree. A level that saw one huge burst of trading can be an HVN in volume but only one or two letters in TPO. Many traders use both, and you can see how a time-based view is built in a TPO chart.
How traders use prior-day value
One of the most common ways to use a profile is to compare where the market opens with the prior session’s value area. This is a framework for reading the session, not a trading rule.
- Open inside prior value. The market is starting within the range where most of yesterday’s business was done. Traders often expect two-sided, rotational trade within that range until something changes.
- Open outside prior value, then return inside. Price tried a new area and didn’t hold it. Some traders then watch the other side of the prior value area as a possible destination.
- Open outside prior value and stay outside. If price builds volume above the VAH or below the VAL, the market may be accepting a new area. Traders watch whether the prior VAH or VAL now holds from the other side.
How the open develops matters more than the open itself. The initial balance, the first hour’s range, is often read together with prior value to judge whether the market is accepting or rejecting the new prices. The futures day trading strategies guide covers setups that build on these ideas.
Common mistakes with volume profile
- Treating every level as support or resistance. Profiles show where volume traded, not where it will trade.
- Ignoring the session definition. A full-session POC and an RTH-only POC can sit at different prices. Know which one you’re looking at.
- Comparing platforms tick for tick. Different value area methods and row sizes produce slightly different levels.
- Using a visible-range profile as a fixed level. It changes every time you scroll.
- Reading the profile without the price action. The profile shows where trade happened; order flow shows how it’s happening now.
Putting it together
Start with the prior session’s POC, VAH and VAL and note where the market opens relative to them. Mark obvious HVNs and LVNs from a composite of the last few sessions. Then watch how price behaves when it reaches those levels instead of assuming what it will do.
To see the buying and selling inside each price, read footprint charts explained. To combine profile levels with live trade data, see the order flow trading guide.
Frequently asked questions
What is the point of control in a volume profile?
The point of control (POC) is the single price level where the most volume traded during the period the profile covers. Many traders treat it as the price the market found most acceptable during that period.
Why is the value area 70%?
The convention comes from Market Profile, where about 70% approximates one standard deviation of a normal distribution (about 68%). It is a convention rather than a law, and most platforms let you change the percentage.
What is the difference between an HVN and an LVN?
A high volume node (HVN) is a price area where a lot of volume traded, and a low volume node (LVN) is a thin area where little traded. Price has tended to slow down and rotate around HVNs and to move quickly through LVNs, though neither behavior is guaranteed.
Is volume profile the same as Market Profile (TPO)?
No. A volume profile counts contracts traded at each price, while a TPO chart counts how many time periods price spent at each level. The two often look similar but can put the POC and value area at different prices.
Should I use a session profile or a composite profile?
They answer different questions. A session profile shows where one day's business was done, while a composite combines several sessions to show longer-term areas of acceptance. Many traders look at both.