Order Flow · Complete guide
Order Flow Trading: A Practical Guide
What order flow is and how futures traders read it: the tape, the DOM, footprints, delta and CVD, absorption, icebergs, heatmaps, context and practice.
By TickMint Team Published 13 min read Intermediate
Key takeaways
- Order flow is the record of executed trades plus the resting orders waiting in the book, read to judge who is pushing price and who is absorbing it.
- Aggressive orders cross the spread and move price; passive limit orders provide the liquidity they trade against.
- Delta, cumulative delta, footprints, absorption and large-trade tools all describe the same thing from different angles: aggression meeting liquidity.
- Order flow works best at levels you planned in advance, such as the prior day's value area, and is weakest when read in isolation.
- It describes what is happening now and doesn't predict the next move; data quality and market behavior vary, so practice in replay before relying on it.
On this page
- What is order flow?
- Aggressive vs passive orders: who moves price?
- The order flow toolkit
- Time and sales (the tape)
- The DOM and the order book
- Footprint charts
- Delta and cumulative delta (CVD)
- Imbalances
- Absorption
- Exhaustion
- Large trades and icebergs
- Liquidity heatmaps
- What is delta divergence?
- Putting order flow in context
- A practical order flow workflow
- Before the session
- At a level
- In the trade and after
- What are the limitations of order flow?
- Common order flow mistakes
- How to practice reading order flow
- Next steps
Order flow trading means reading the actual buying and selling in a market, the trades that execute and the orders resting in the book, to judge who is in control at a given price. Instead of inferring pressure from a candle’s shape, you look at how many contracts traded at the bid and the ask, whether the orders waiting in the book hold or get pulled, and how that changes at key levels. It describes what is happening now. It doesn’t predict what happens next, so traders combine it with context such as the prior day’s value area.
What is order flow?
Every futures market is a continuous two-way auction. Buyers and sellers post orders, and the exchange matches them. Order flow is the record of that auction, and it has two parts:
- Executed trades: what actually traded, at what price, in what size and which side initiated it.
- Resting orders: the limit orders waiting in the order book at each price. This is the market’s visible liquidity.
Price moves when one side is willing to trade more urgently than the other. If buyers keep paying the offer and sellers keep pulling their offers higher, price rises until it finds enough sellers to stop it. Auction traders describe this as price moving to “facilitate trade”: it keeps searching until both sides are willing to do business again.
Order flow lets you watch that search in detail. A chart tells you price went from 5000 to 5005. Order flow tells you whether it got there because buyers were aggressive, because sellers stepped away, or both.
Aggressive vs passive orders: who moves price?
Every trade has two sides: one order that was resting and one that arrived and traded against it.
| Aggressive (initiating) | Passive (resting) | |
|---|---|---|
| Order type | Market order, or a marketable limit | Limit order resting in the book |
| Buy side | Lifts the ask: buys at the offer price | Rests on the bid, waiting for a seller |
| Sell side | Hits the bid: sells at the bid price | Rests on the ask, waiting for a buyer |
| Effect | Takes liquidity and can move price | Provides liquidity and can stop price |
When a market buy order is larger than the size resting at the best ask, it trades through that level and continues to the next ask, and price ticks up. That’s why aggressive orders move price and passive orders absorb it.
Most order flow tools come down to classifying each trade by its aggressor. A trade at the ask is counted as buying, and a trade at the bid as selling. Some data feeds tag each trade with the aggressor side directly; otherwise the platform has to infer it, which is less precise.
The order flow toolkit
Each tool below shows the same auction from a different angle. You don’t need all of them, and stacking too many on one chart makes it harder to read.
Time and sales (the tape)
Time and sales is a scrolling list of every trade: time, price, size and, usually, a color for the aggressor side. Reading the tape means watching its pace and size. A burst of large prints at the ask, faster than usual, tells you buyers are urgent. Prints slowing to a trickle near a level tells you interest has dried up.
The tape is the rawest form of order flow, but it’s fast and hard to summarize. Most traders use it alongside a chart rather than on its own.
Things tape readers commonly watch for:
- Pace: how many trades print per second compared with a few minutes ago. A sudden jump in speed at a level often means stops or new orders are being triggered.
- Size: whether prints are mostly 1–5 lots or include repeated larger orders. “Large” is relative to the market and the time of day.
- Repetition at one price: many sell prints at the same bid without price ticking lower suggests someone passive is taking the other side.
- Sweeps: one aggressive order trading through several prices at once, which shows urgency.
Many platforms let you filter the tape by minimum size, which hides the small prints and makes the larger orders easier to see. Filtering helps, but it also hides the steady flow of small orders that can matter just as much.
The DOM and the order book
The depth of market (DOM) is a vertical price ladder that shows resting bid and ask size at each price, usually with your working orders and recent trades. It shows the liquidity that aggressive orders will have to trade through.
Traders watch for:
- Size stacking: liquidity building at a price, which may slow price down there.
- Size pulling: liquidity disappearing as price approaches, which may let price move through more easily.
- Refreshing: a level that keeps getting refilled after trades hit it, which may point to a larger hidden order.
Many traders also place orders directly from a DOM ladder, which is why it’s both an analysis tool and an execution tool.
Footprint charts
A footprint chart splits each candle into price rows and shows the volume traded at the bid and at the ask on every row. It puts the tape inside the bar, so you can see where in the candle the aggression happened.
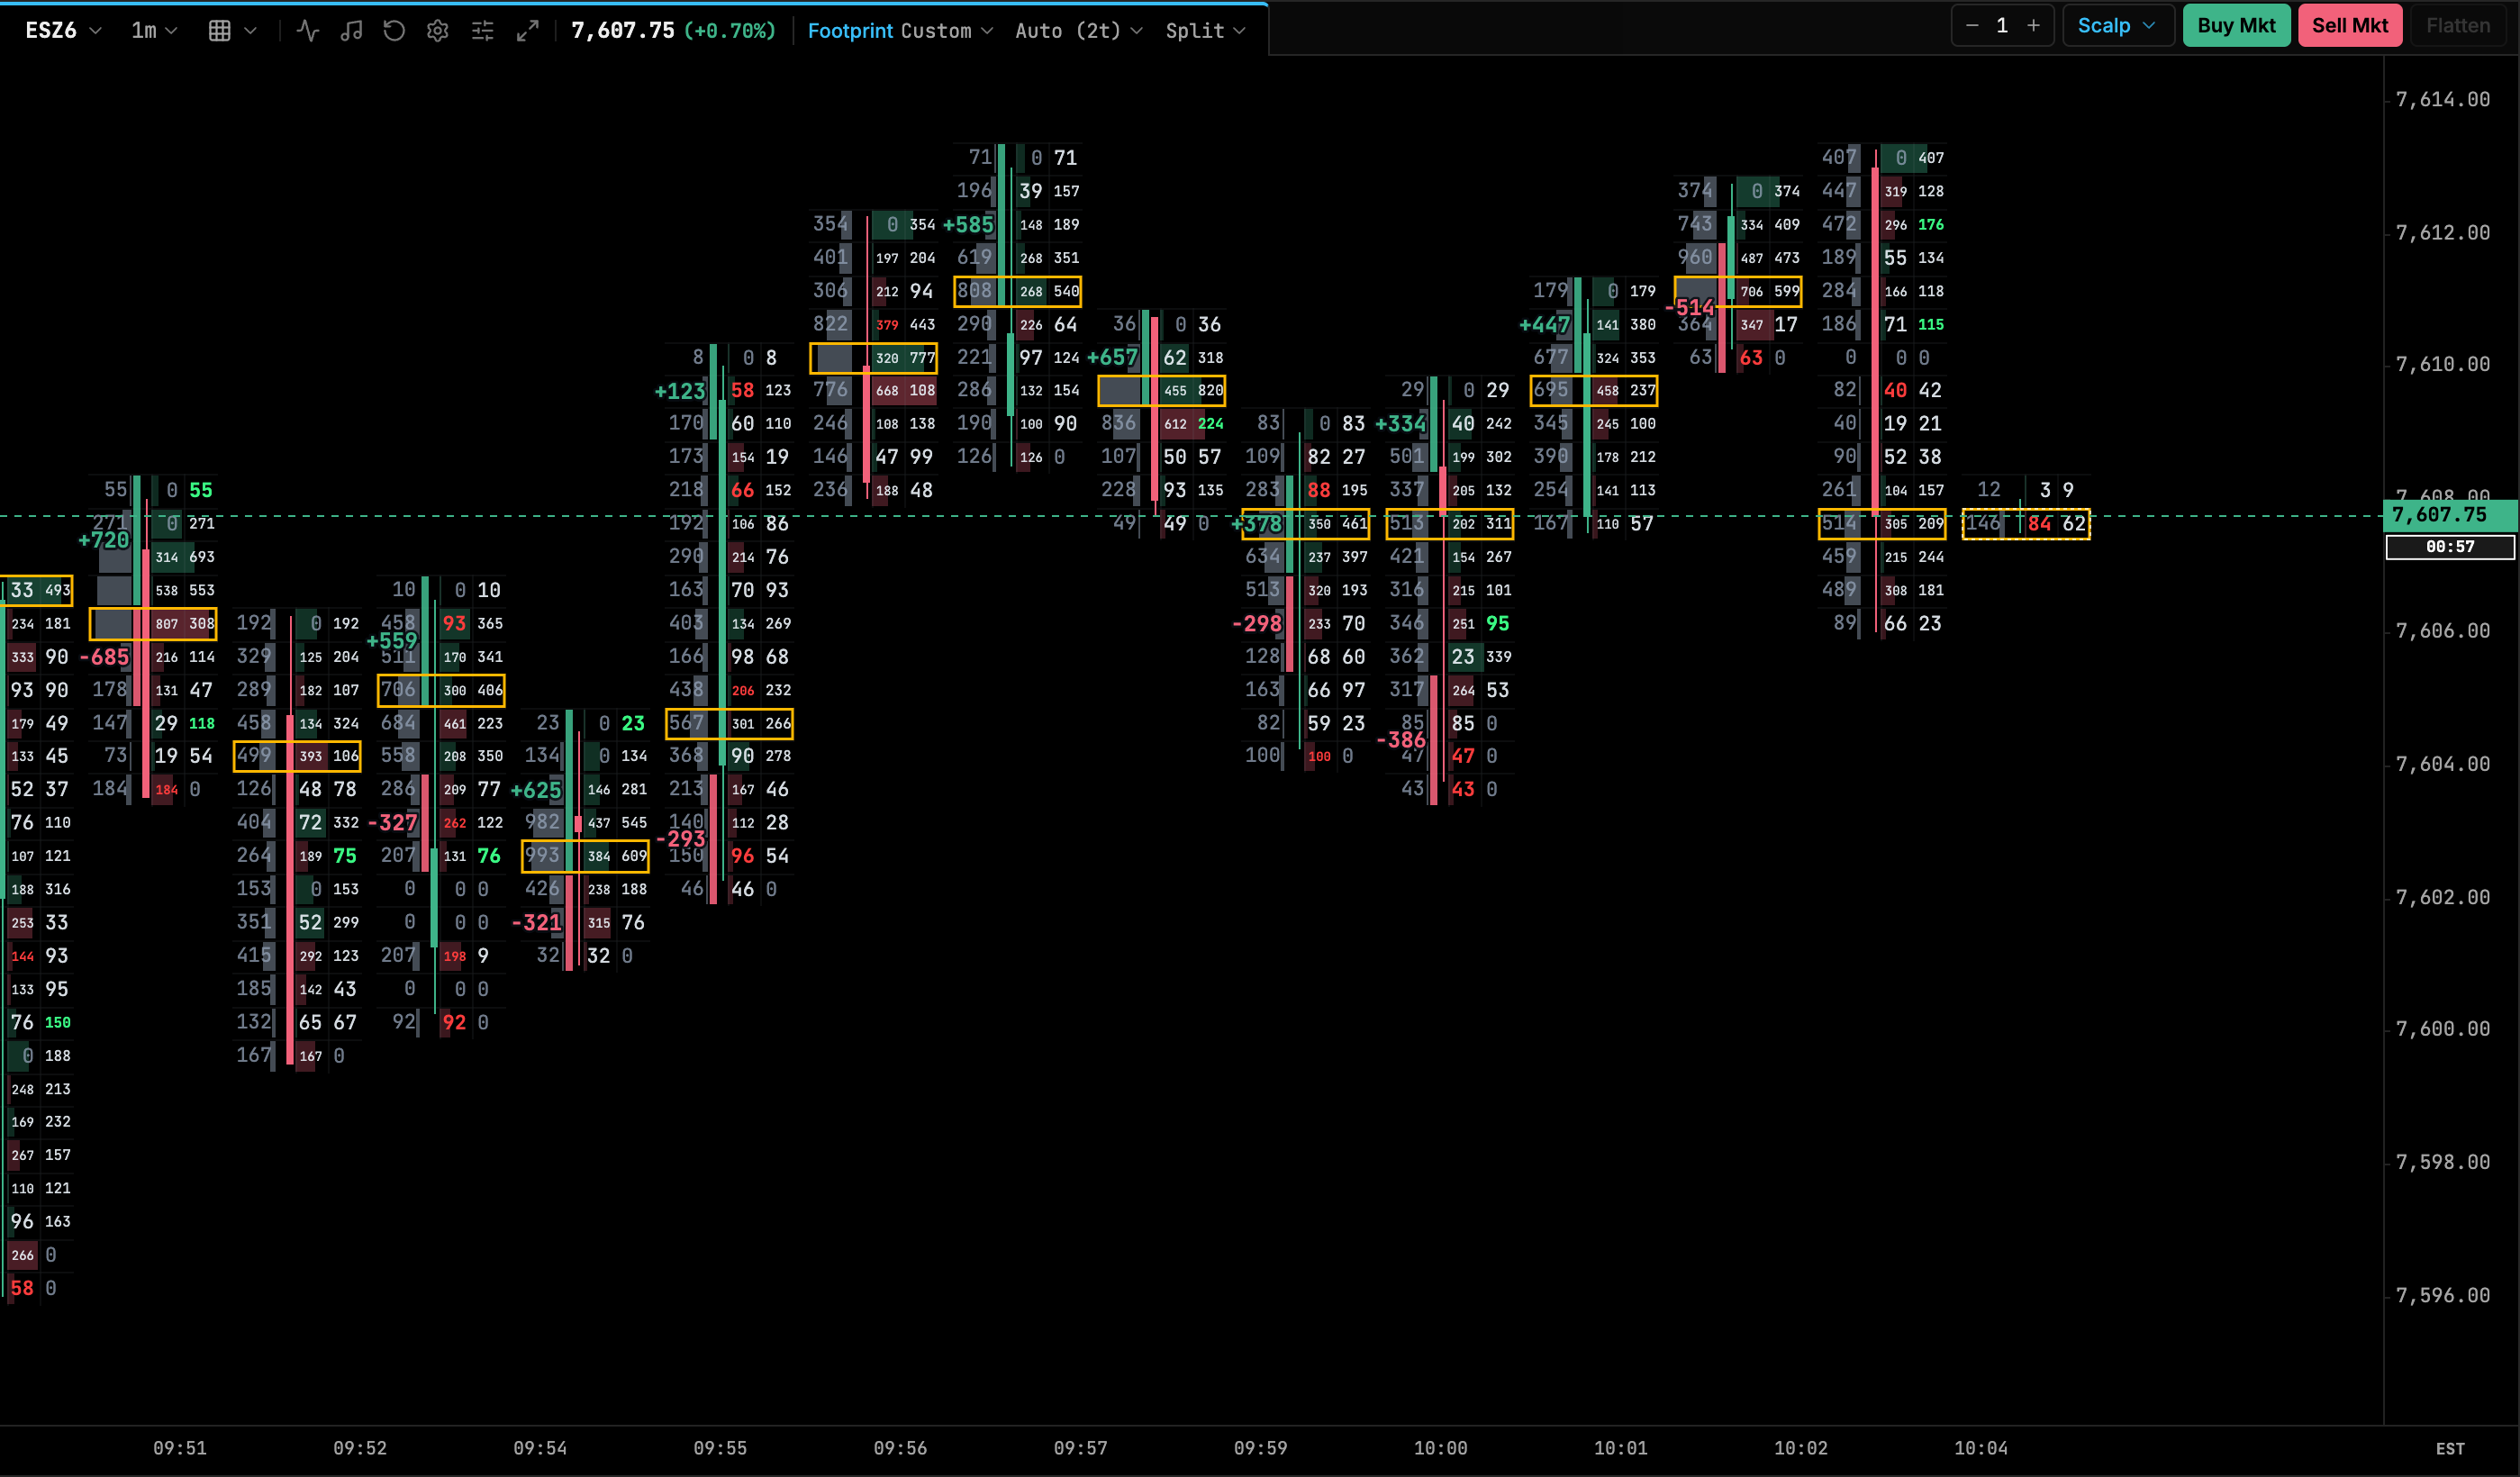
The footprint charts guide covers the layouts, how to read bid × ask, and how the diagonal comparisons work.
Delta and cumulative delta (CVD)
Delta is buy-aggressor volume minus sell-aggressor volume. It can be measured per price row, per bar or per session. A bar with positive delta saw more contracts lifting the ask than hitting the bid.
Cumulative volume delta (CVD) is the running total of delta, usually reset at the start of each session. It shows whether aggressive buying or selling has dominated over time.
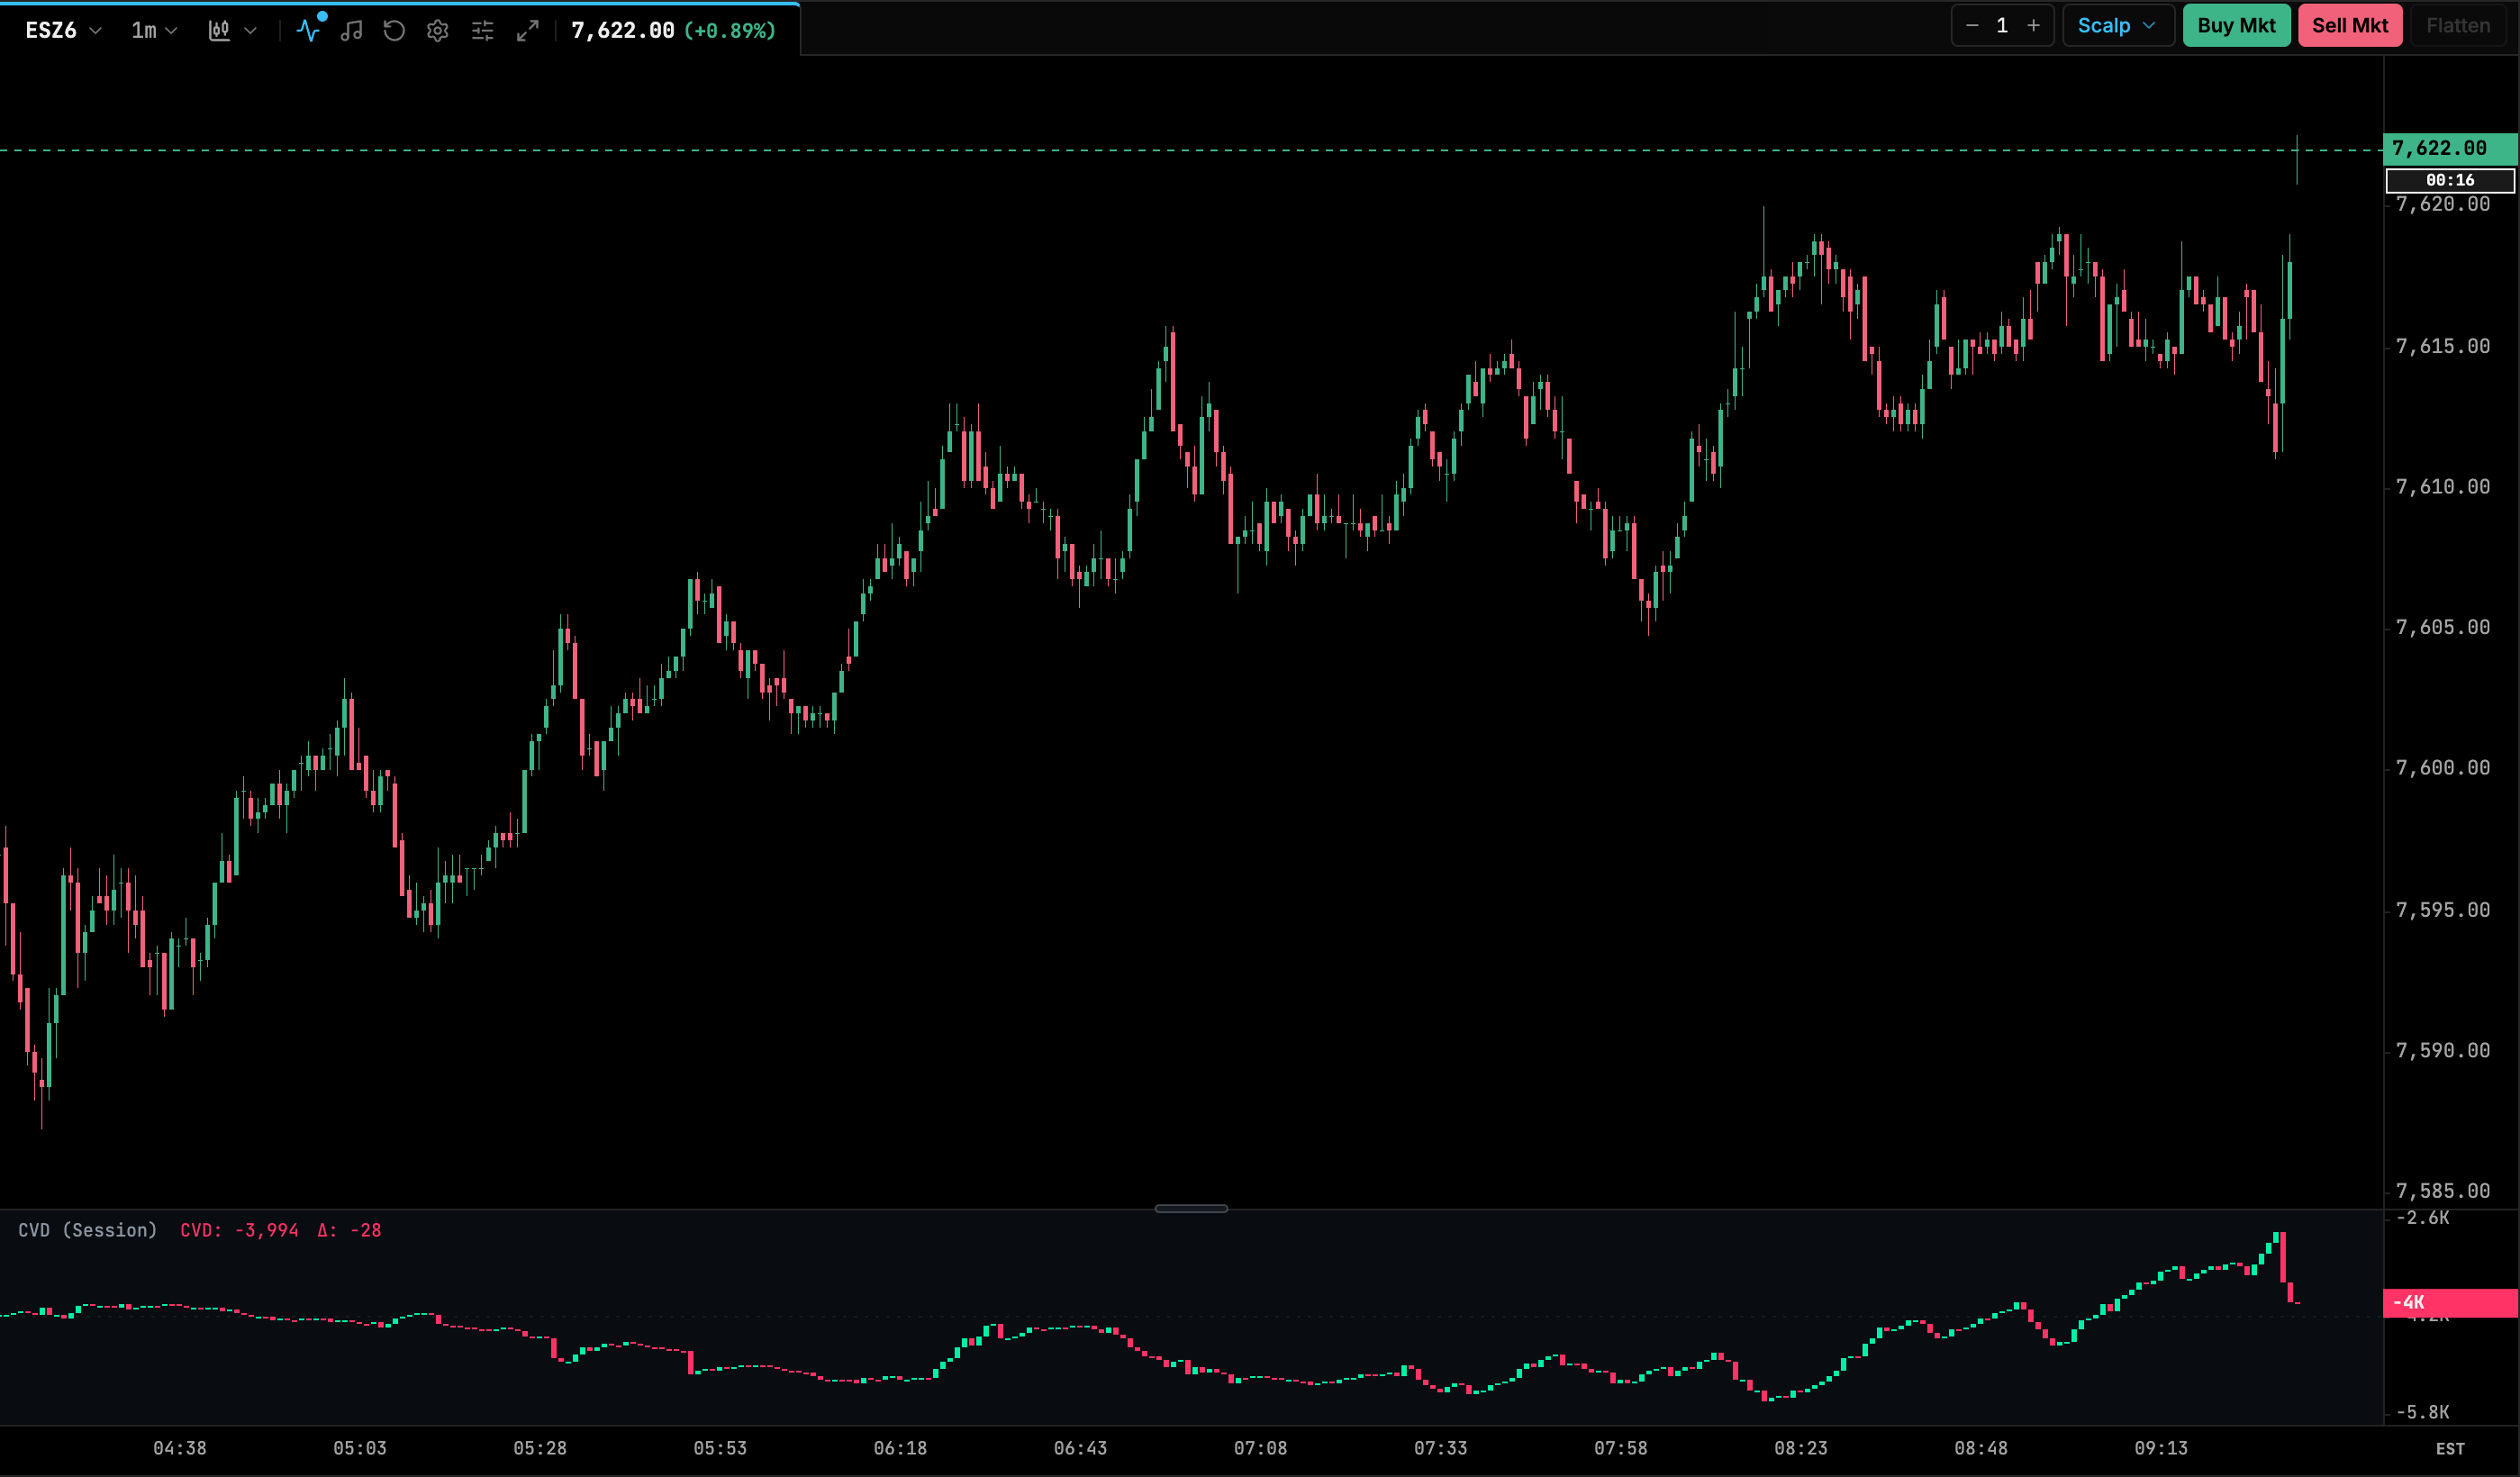
Delta isn’t the same as direction. Price can rise on negative delta when passive buyers on the bid are doing the work, and fall on positive delta when sellers step away from the offer. Delta tells you who initiated the trades, not who will win.
Imbalances
An imbalance on a footprint compares ask volume on one row with bid volume on the row below it (a diagonal comparison, because a buyer lifting the offer trades one tick above the best bid). When one side is several times larger than the other, typically 3× or more, the row is flagged. Several imbalances in a row form a stacked imbalance, which many traders read as a zone where one side was clearly more aggressive.
Thresholds are settings, not facts about the market. A 3× imbalance on 15 contracts means much less than one on 500.
Absorption
Absorption is when aggressive orders hit a level repeatedly and price doesn’t move through it, because passive orders keep taking the other side. Heavy selling at the bid with price holding is a sign of passive buyers absorbing it. The reverse applies at highs.
Platforms define absorption in different ways. Some look for large volume at one price with little price movement. Others flag a bar with unusually strong delta that’s followed by a reversal.
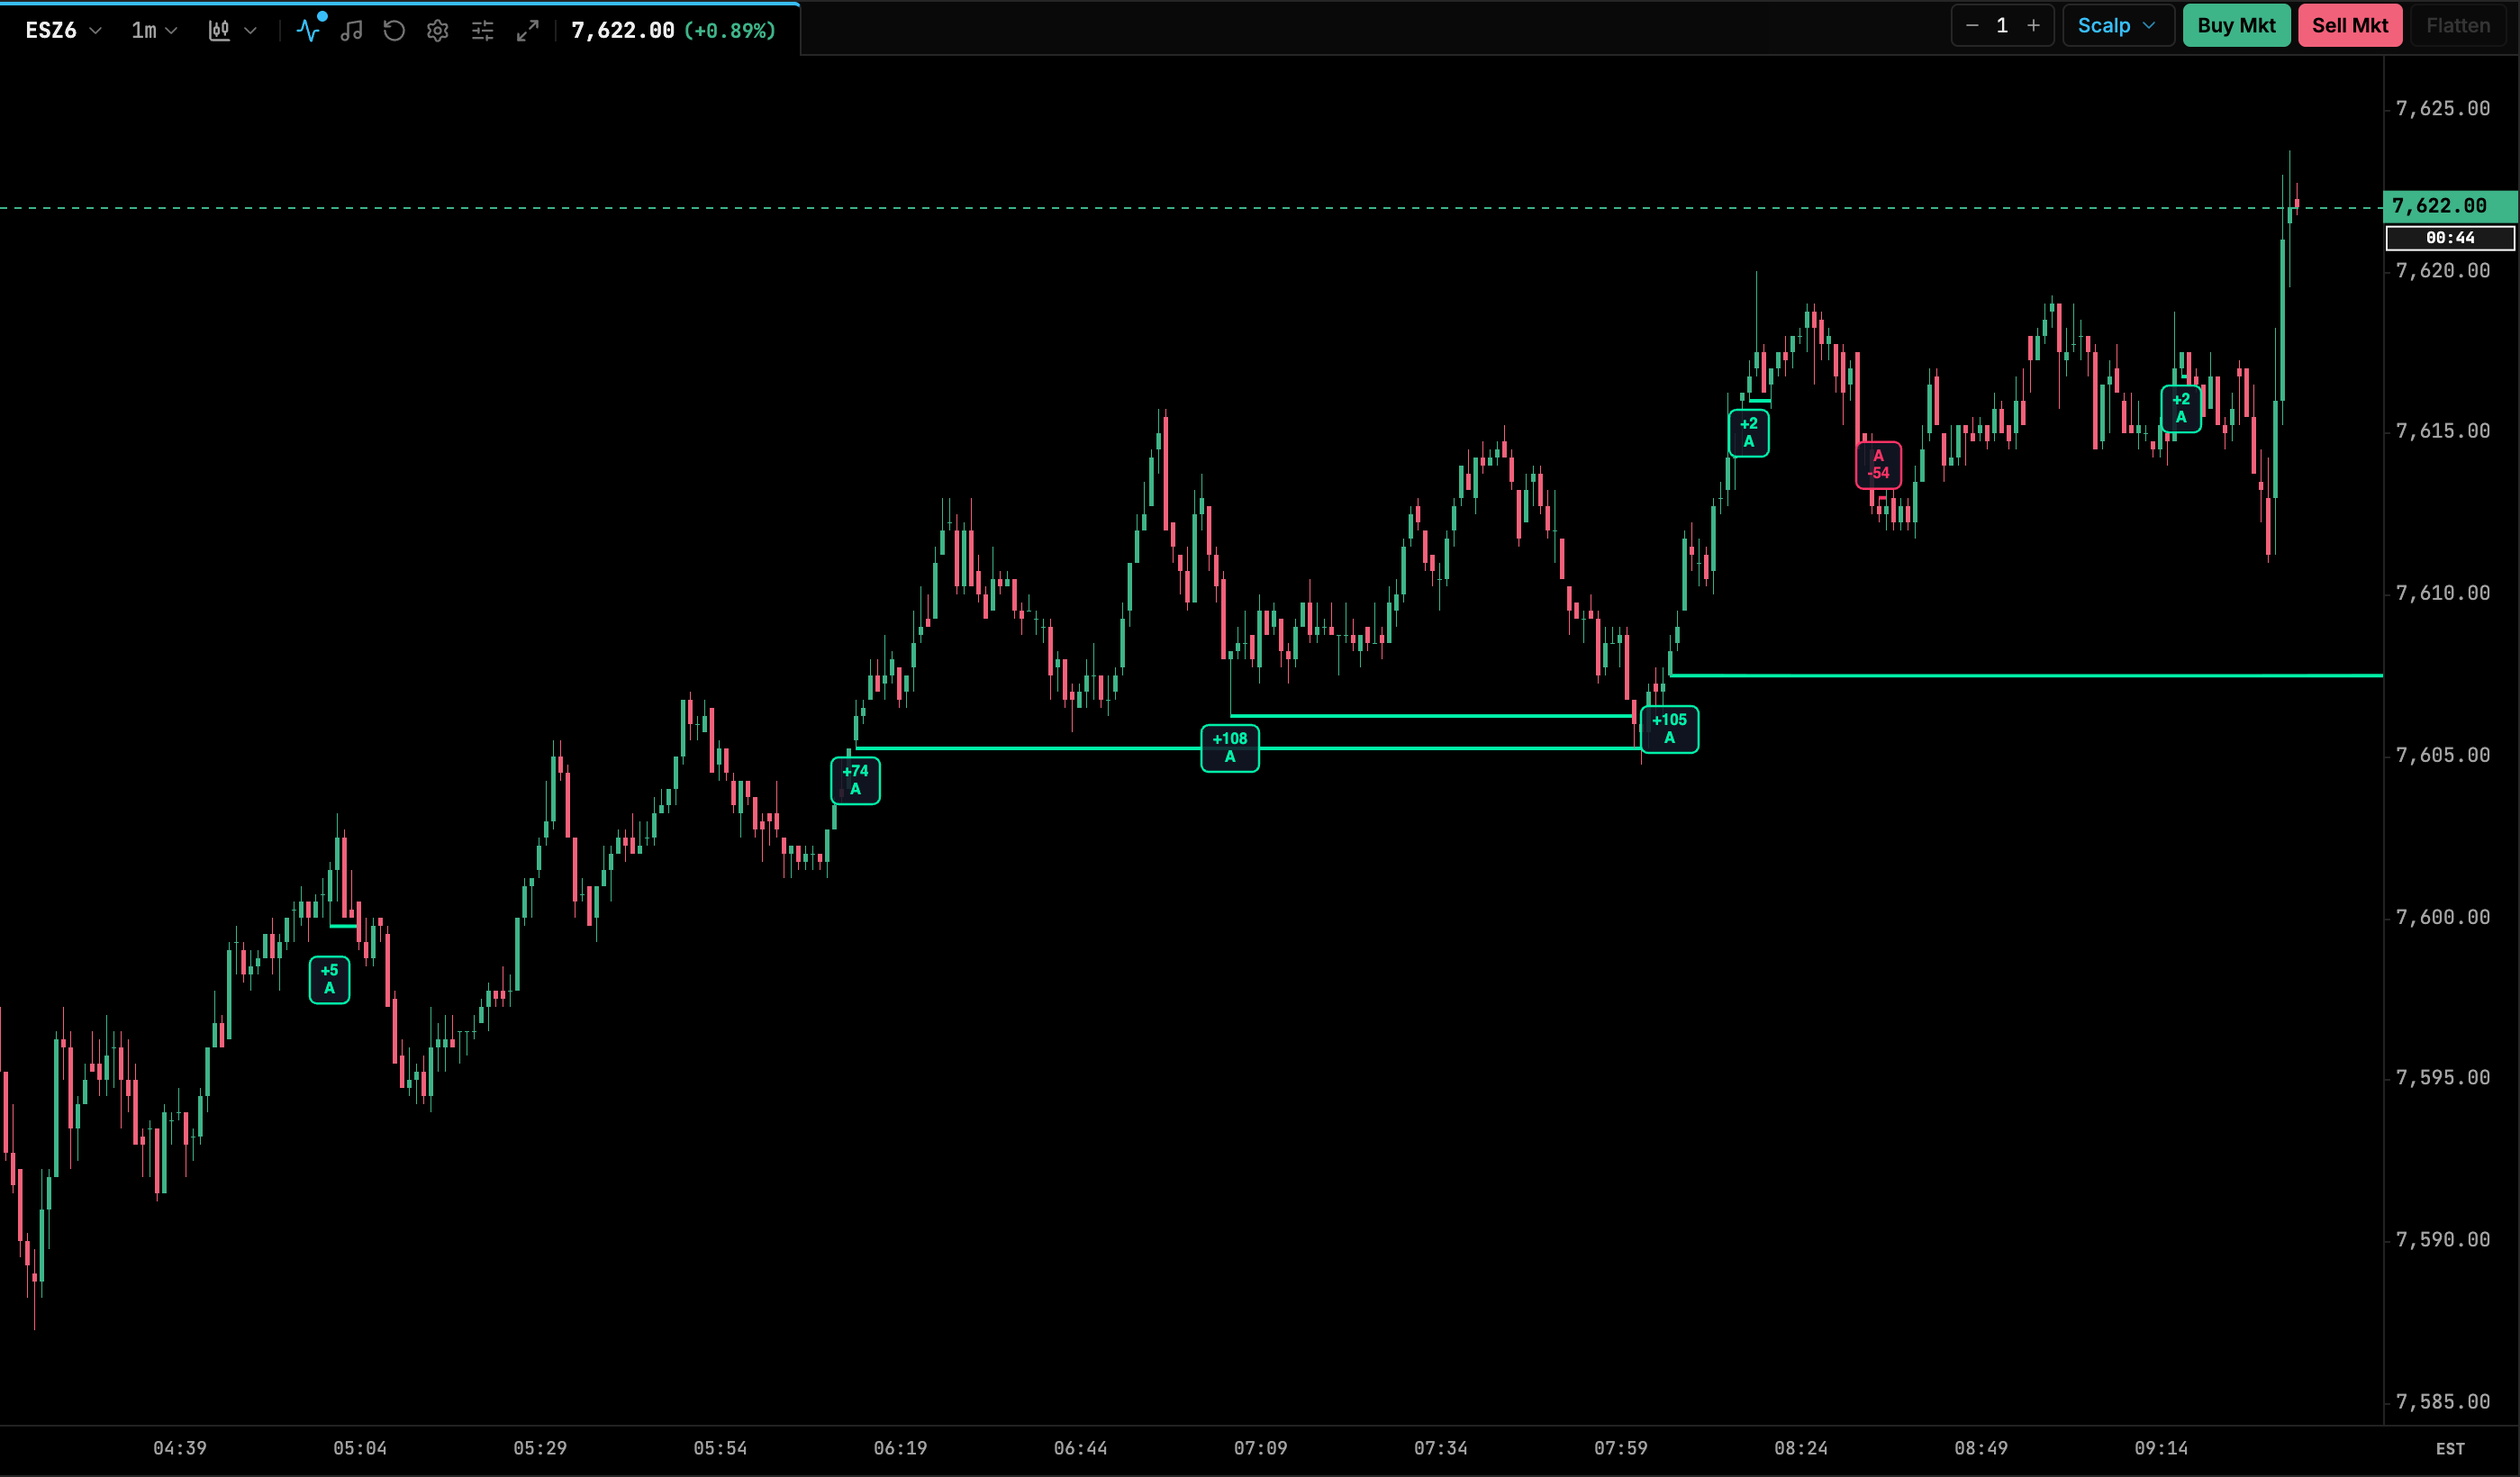
Exhaustion
Exhaustion is the opposite situation: aggression simply runs out. At the end of a move, volume at the extreme prices thins out and the last prints are small. Price stops not because a big player defended the level, but because no one is left willing to push. Footprints show this as very low volume on the final rows of a high or low.
Large trades and icebergs
Large-trade tools highlight unusually big aggressive orders. One large order often fills against several resting orders and shows up as several prints, so these tools usually combine prints with the same timestamp and aggressor side into one order. They’re drawn as bubbles sized by contract count.
An iceberg order is a resting order that shows only part of its size. When the visible part trades, more appears at the same price. You can spot one when far more volume trades at a price than the book ever showed there, and the displayed size keeps refilling. Iceberg detection is an estimate; the hidden size isn’t published.
Liquidity heatmaps
A liquidity heatmap draws the resting size at every price over time, so bright horizontal bands show where large orders sat and for how long. It’s a history of the order book, which the DOM alone can’t show.
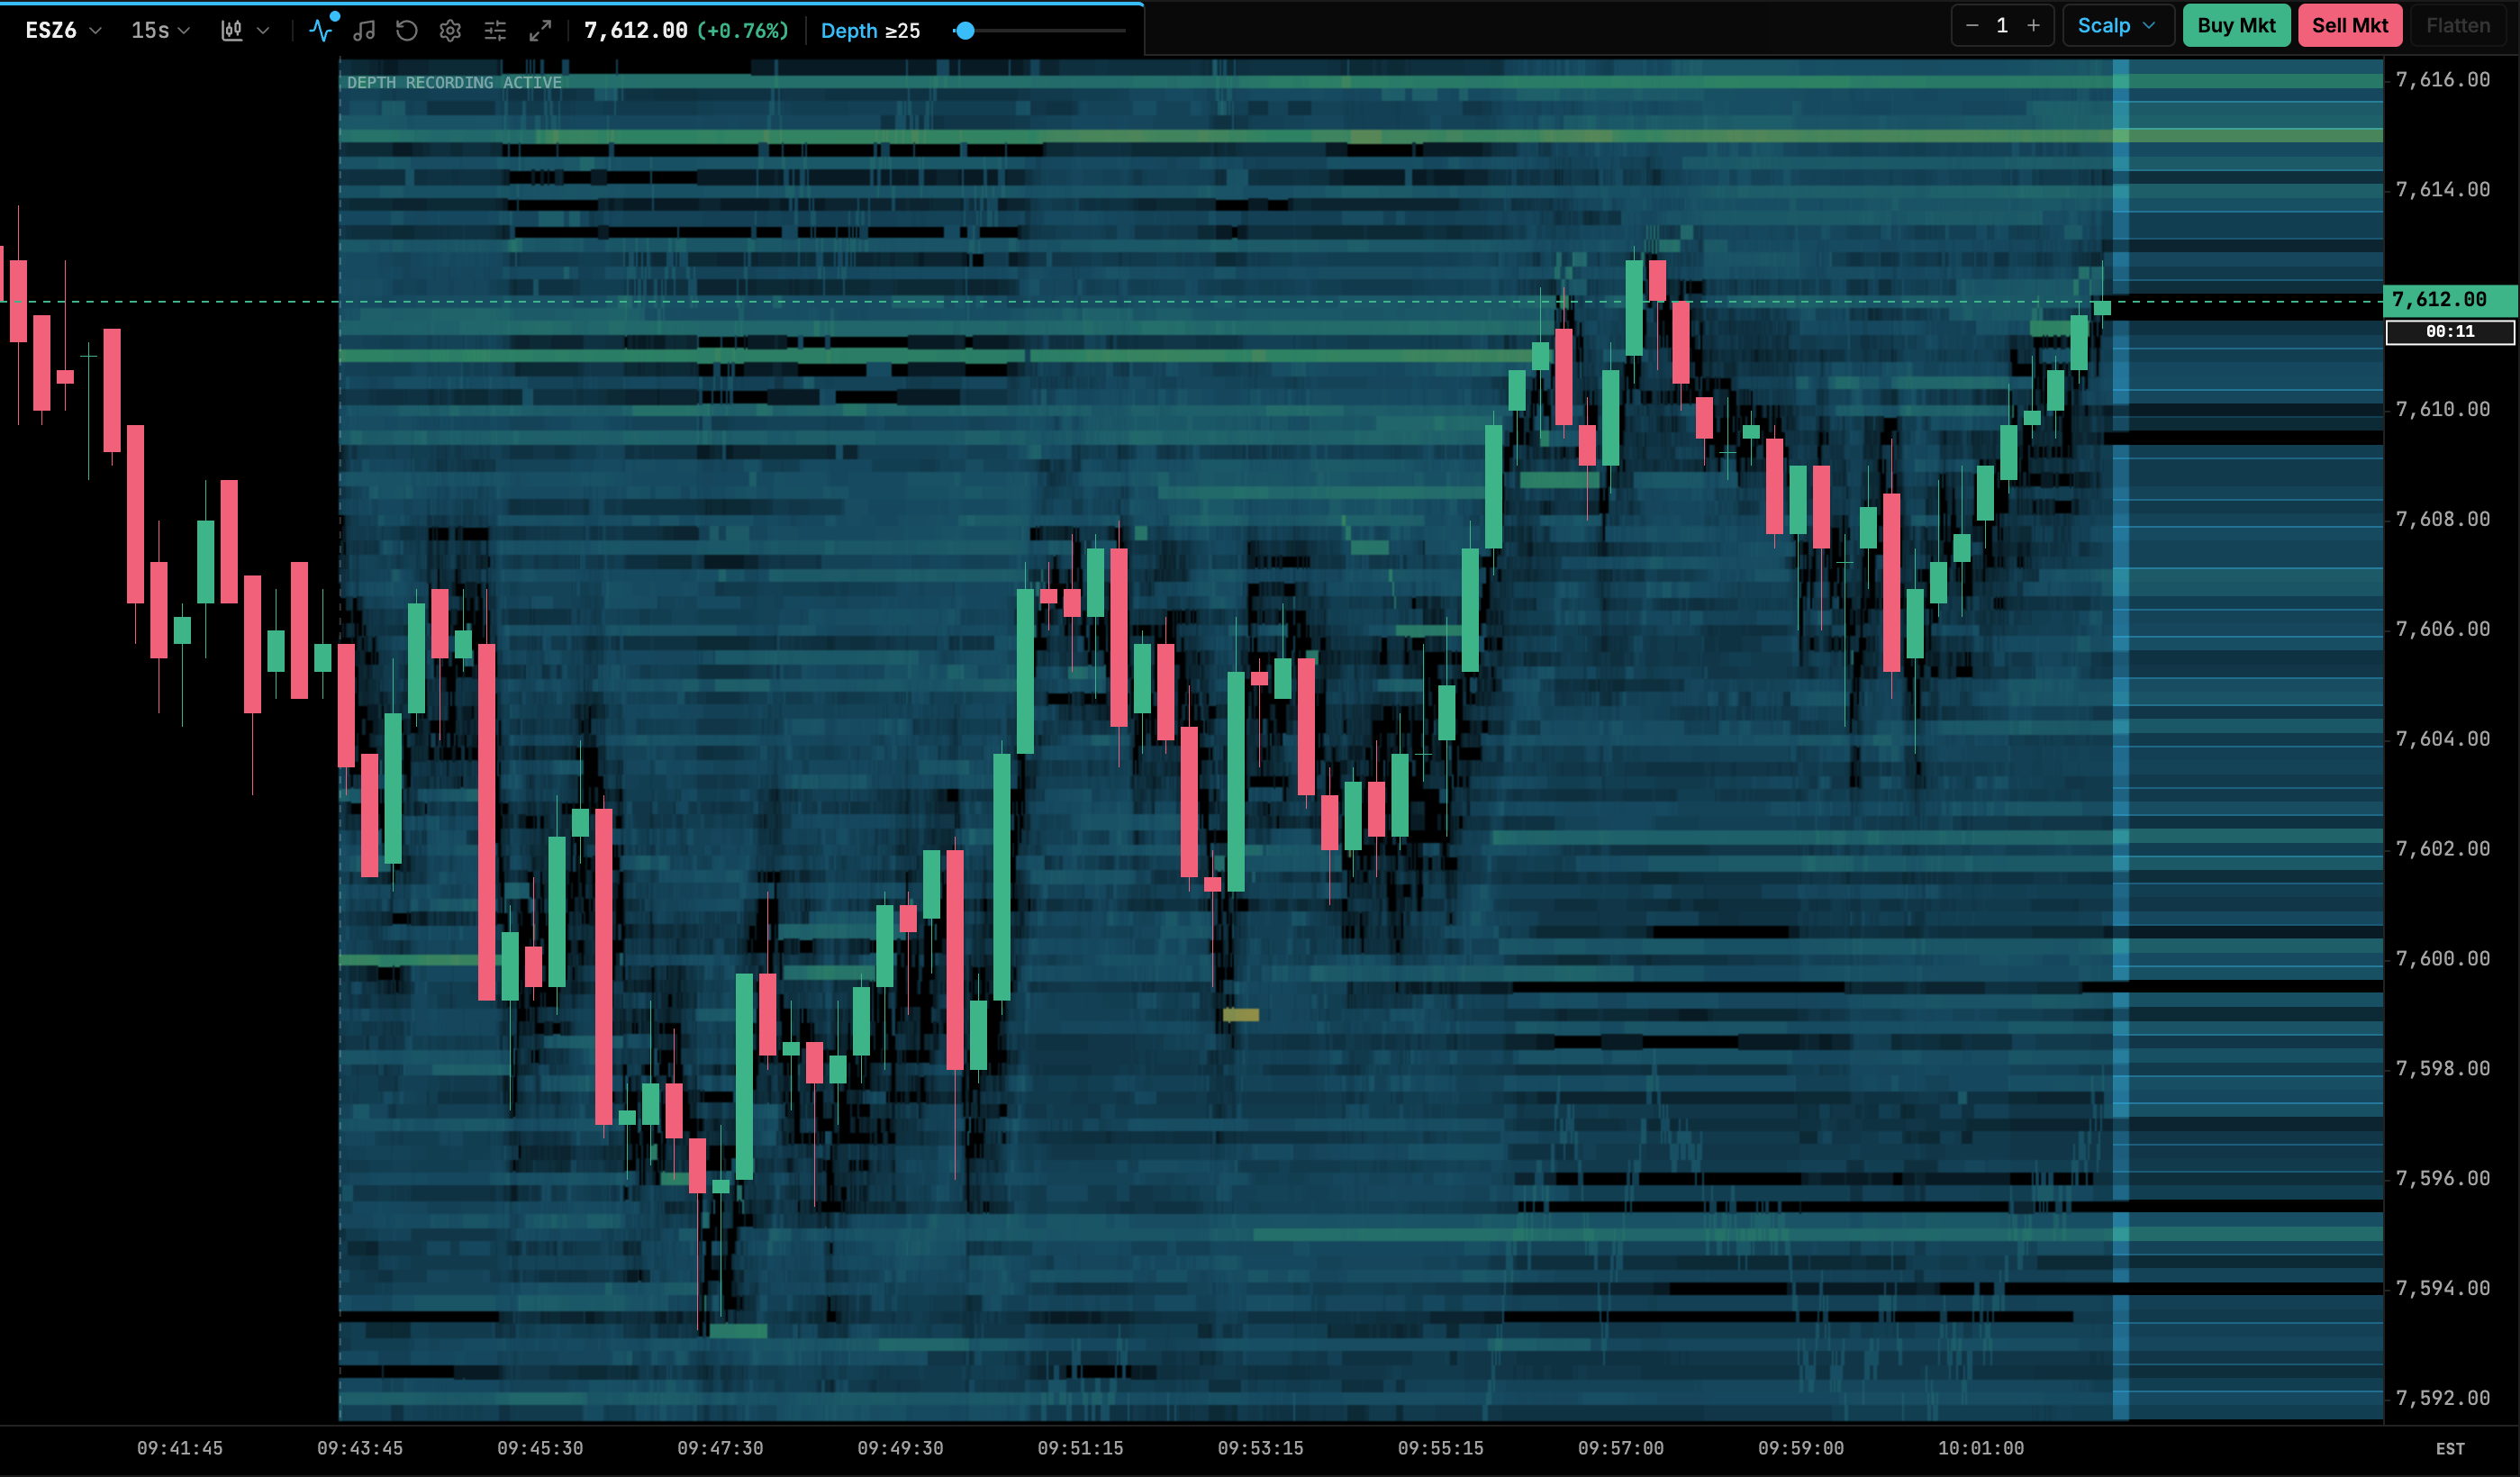
Resting liquidity isn’t a commitment. Orders can be cancelled at any moment, and most large resting orders never trade. A wall of bids can vanish as price arrives.
Cancelling orders is normal. But spoofing, which the Commodity Exchange Act describes as “bidding or offering with the intent to cancel the bid or offer before execution”, is illegal in US futures markets. The CFTC set out how it interprets that prohibition in its 2013 interpretive guidance. Spoofed orders still show up on the DOM and heatmap like any others, which is one more reason to treat displayed liquidity with caution.
What is delta divergence?
Delta divergence is when price and delta disagree at a swing. The most common form compares CVD with price:
- Bearish divergence: price makes a higher high, but CVD makes a lower high. Price went up while aggressive buying weakened.
- Bullish divergence: price makes a lower low, but CVD makes a higher low. Price went down while aggressive selling weakened.
Traders read divergence as a sign that the move is running on less aggression, so passive orders or a lack of opposition may be doing more of the work. It doesn’t mean price will reverse.
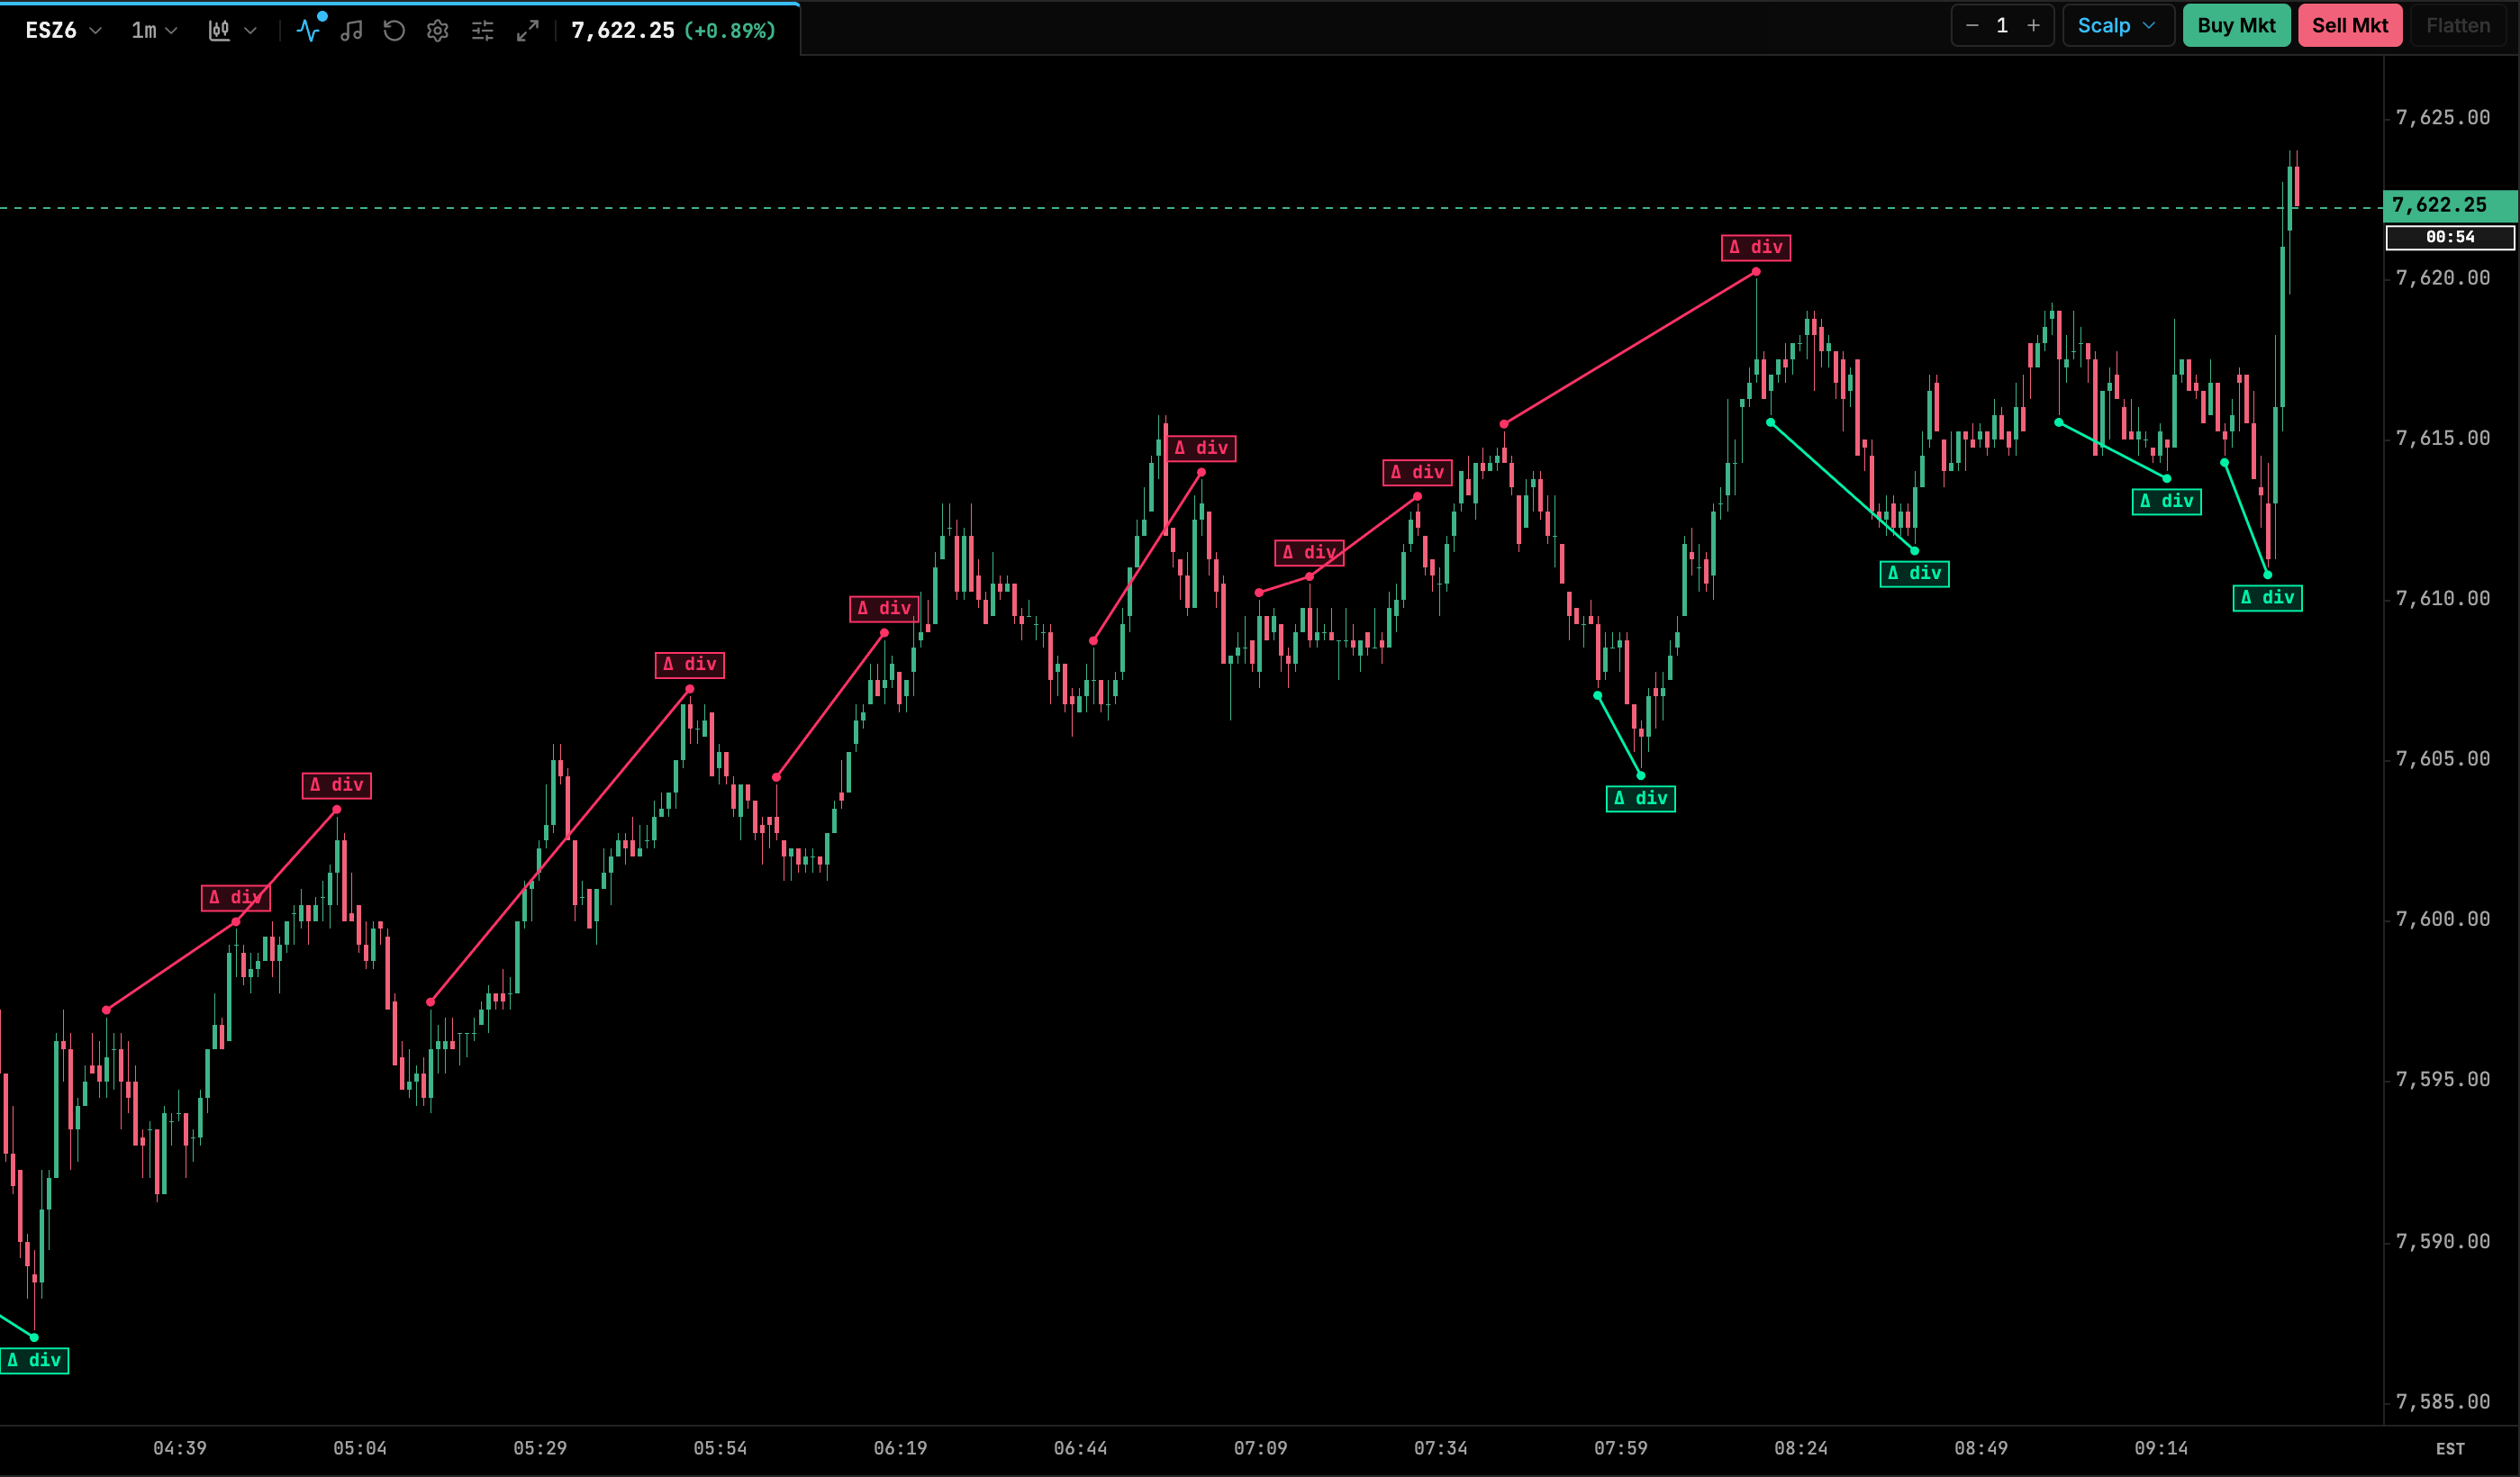
The screenshot shows the main limitation. In a trend, divergences can appear again and again while price keeps going. Divergence is most useful as a reason to look closer at a level you already care about, not as a signal by itself.
Putting order flow in context
Order flow without context is noise. In a liquid market there’s aggressive buying and selling at every price all day. The question is what happens at the prices that matter.
Most traders choose those prices before the session from higher-level tools:
- Prior-day value: the previous session’s point of control, value area high and value area low. The volume profile guide explains how they’re calculated and how traders use them.
- Volume nodes: high volume nodes where price may slow down, and low volume nodes it may move through quickly.
- Session references: the prior day’s high and low, the overnight high and low and the opening range.
Then order flow answers a narrower question: when price reaches this level, are aggressive orders getting through, or is passive liquidity holding? A stack of buy imbalances breaking out of the prior day’s value area means something different from the same imbalances in the middle of a quiet range.
A practical order flow workflow
The steps below are one common way traders structure a session. Adjust them to your market and your plan.
Before the session
- Mark your levels: prior POC, VAH and VAL, the prior high and low, the overnight range and any obvious nodes.
- Write down a few scenarios. For example: “If price returns to the prior VAL and selling gets absorbed, I’ll look for a long. If it breaks through with stacked sell imbalances, I’ll stand aside.”
- Decide your risk per trade and your daily limit before you look at any order flow.
At a level
- Watch the approach. Is price arriving fast on strong delta, or drifting in on light volume?
- Watch the reaction. Look for absorption, exhaustion, imbalances, changes in the book and large trades.
- Wait for confirmation that matches your scenario. A single print or one imbalance is rarely enough.
In the trade and after
- Place a stop where the order flow idea would be wrong, for example beyond the level that was supposed to hold.
- Manage the trade by your plan, not by every tick on the tape.
- After the session, review the trades and the levels, including the ones you didn’t take.
The futures day trading strategies guide covers setups built on this kind of reaction, and how to day trade futures covers the basics of planning a session and managing risk.
What are the limitations of order flow?
Order flow has real limits, and knowing them saves money.
- It’s descriptive. Every tool here records what already traded or what is resting right now. None of them knows what the next order will be.
- Resting liquidity can change instantly. The book you see is a snapshot. Orders get pulled, added and spoofed.
- Data quality varies. Some feeds tag each trade with its aggressor side; others leave the platform to infer it. Historical bars may carry only aggregated data, so delta on older bars is often an estimate. Large orders may be split into many prints or combined differently depending on the platform.
- Markets differ. A very liquid contract like ES has deep books and thousands of trades a minute, so a 50-lot means little. In a thinner market, the same size can move price. Thresholds that suit one market won’t suit another.
- Time of day matters. Overnight sessions are thinner than regular hours, so the same reading means different things at different times.
- It’s mentally demanding. Reading fast data for hours is tiring, and fatigue leads to forcing trades.
Common order flow mistakes
Most problems with order flow come from asking it to do more than it can.
- Trading every signal. Imbalances, divergences and big prints appear all day. Without a planned level and a scenario, you end up reacting to noise.
- Reading one print as a story. A single large trade could be a hedge, a spread leg, a position being closed or an order split across several prints. One print rarely tells you much on its own.
- Trusting displayed size. A large bid on the DOM isn’t a promise. Treat liquidity as information that can disappear, and confirm it with what actually trades.
- Using the same thresholds everywhere. A minimum size or imbalance ratio tuned for ES during regular hours will flag too much or too little in a thinner contract or overnight. Revisit settings when you change market or session.
- Confusing delta with direction. Strong positive delta at a high can be buyers getting absorbed, not buyers winning. Always read delta together with what price did.
- Ignoring the bigger picture. A perfect absorption pattern against a strong trend or right before a scheduled economic release carries much more risk than the same pattern in a calm, balanced session.
- Overloading the screen. Five order flow studies showing the same information in five ways slow you down. Pick the few that answer your question at your levels.
A useful test: before acting, say in one sentence what the order flow is showing and why it matters at this price. If you can’t, it probably isn’t a reason to trade.
How to practice reading order flow
You don’t need to learn order flow with live money. Common approaches:
- Market replay. Replay a past session and watch the tape, footprints and delta form at your marked levels. You can slow it down, pause and repeat the same morning several times. Check what your replay tool supports: some carry trades only, without the order book, so DOM and heatmap reading can’t be practiced that way. Older days may also play back at reduced detail.
- Simulated accounts. Trade your scenarios on a simulator in live markets to practice reading in real time without risk.
- Screenshots and notes. Capture the footprint and CVD at every level you trade or skip. Over a few weeks, patterns in your own decisions become easier to see.
- One tool at a time. Start with the footprint and delta at prior-day value. Add the DOM or heatmap only once the first tools make sense.
Platforms differ a lot in how they handle tick data, replay and depth. The guide to choosing a futures trading platform covers what to check.
Next steps
Pick one market and two or three levels from the prior session. For the next week, watch only how price behaves when it reaches them: is aggression getting through, or is liquidity holding? Write down what you see before you look at what happened next.
Once that becomes routine, learn the details of the footprint in footprint charts explained and the levels in volume profile explained.
Frequently asked questions
What is order flow in futures trading?
Order flow is the stream of executed trades and resting orders in a market. Traders read it to see whether buyers or sellers are acting aggressively, where liquidity is resting and whether that liquidity is holding or giving way.
Is order flow trading profitable?
No tool is profitable on its own. Order flow is a way of reading the market; results depend on the trader's plan, risk management and execution, and many traders find it hard to apply consistently.
What is the difference between delta and cumulative delta?
Delta is the volume traded by buy aggressors minus the volume traded by sell aggressors for one bar or one price. Cumulative delta (CVD) is the running total of delta over a session or another chosen period.
Can I practice order flow without risking money?
Yes. Market replay lets you play back a past session and read the tape, footprints and delta as they formed, usually with a simulated account. Some replay tools carry trades only, so order book tools like the DOM and heatmaps may not be available in replay.
Is pulling orders from the book illegal?
Cancelling orders is normal and legal. Spoofing, which US law describes as bidding or offering with the intent to cancel before execution, is illegal under the Commodity Exchange Act, and the CFTC enforces it.