Strategies · Complete guide
Futures Day Trading Strategies: An Overview
An overview of common futures day trading setups, from opening range breakouts to VWAP and order flow, with how traders define entries, stops and targets.
By TickMint Team Published 15 min read Intermediate
Key takeaways
- Every day trading setup is a hypothesis about what kind of day the market is having, and it tends to struggle when that assumption is wrong.
- Breakout setups and reversion setups are built on opposite ideas, so neither one fits every session.
- A setup is only defined once its entry, stop, target and the conditions to skip it are written down.
- Market replay, a meaningful sample size and a trading journal let you study a setup before risking money on it.
- Choose setups that match the hours you can trade and the way you like to make decisions.
On this page
- What makes a day trading setup a setup?
- How does an opening range breakout work?
- How do traders use initial balance breaks and extensions?
- When do traders use VWAP for reversion, and when for trend?
- VWAP reversion
- VWAP trend days
- What is the value area 80% rule?
- How do trend pullbacks with moving averages and market structure work?
- How do failed breakouts and reversals at prior day levels work?
- How is order flow used to confirm a setup?
- How do you choose a setup that fits your schedule and personality?
- How do you test a day trading setup before trading it live?
- Write the rules down
- Practice on market replay
- Build a meaningful sample
- Keep a journal
- Understand expectancy
- Why doesn’t any setup work in all market conditions?
- Putting it together
Futures day trading strategies are repeatable setups that define where you enter, where you’re wrong and where you take profit within a single session. Common ones include opening range breakouts, initial balance breaks, VWAP reversion and VWAP trend trades, the market profile “80% rule”, trend pullbacks, failed breakouts at prior day levels and order flow confirmation. None of them works in every market condition. Each is a hypothesis about what kind of day is unfolding, and the skill is recognising when that hypothesis fits.
This overview describes how traders typically think about each setup. It’s educational, not a recommendation, and nothing here describes how a setup has performed. If you’re new to intraday futures, start with how to day trade futures and come back.
What makes a day trading setup a setup?
A chart pattern alone isn’t a setup. Traders usually consider a setup defined once it has five parts:
- Context: the conditions where it applies, such as time of day, where price opened relative to yesterday, or whether the market is trending.
- Entry: the exact trigger, for example a break of a level by one tick or a close back inside a range.
- Stop: the price that shows the idea is wrong.
- Target: where you take some or all of the profit, or how you trail the position.
- Skip conditions: situations where you don’t take it, such as scheduled news or a range that’s unusually wide.
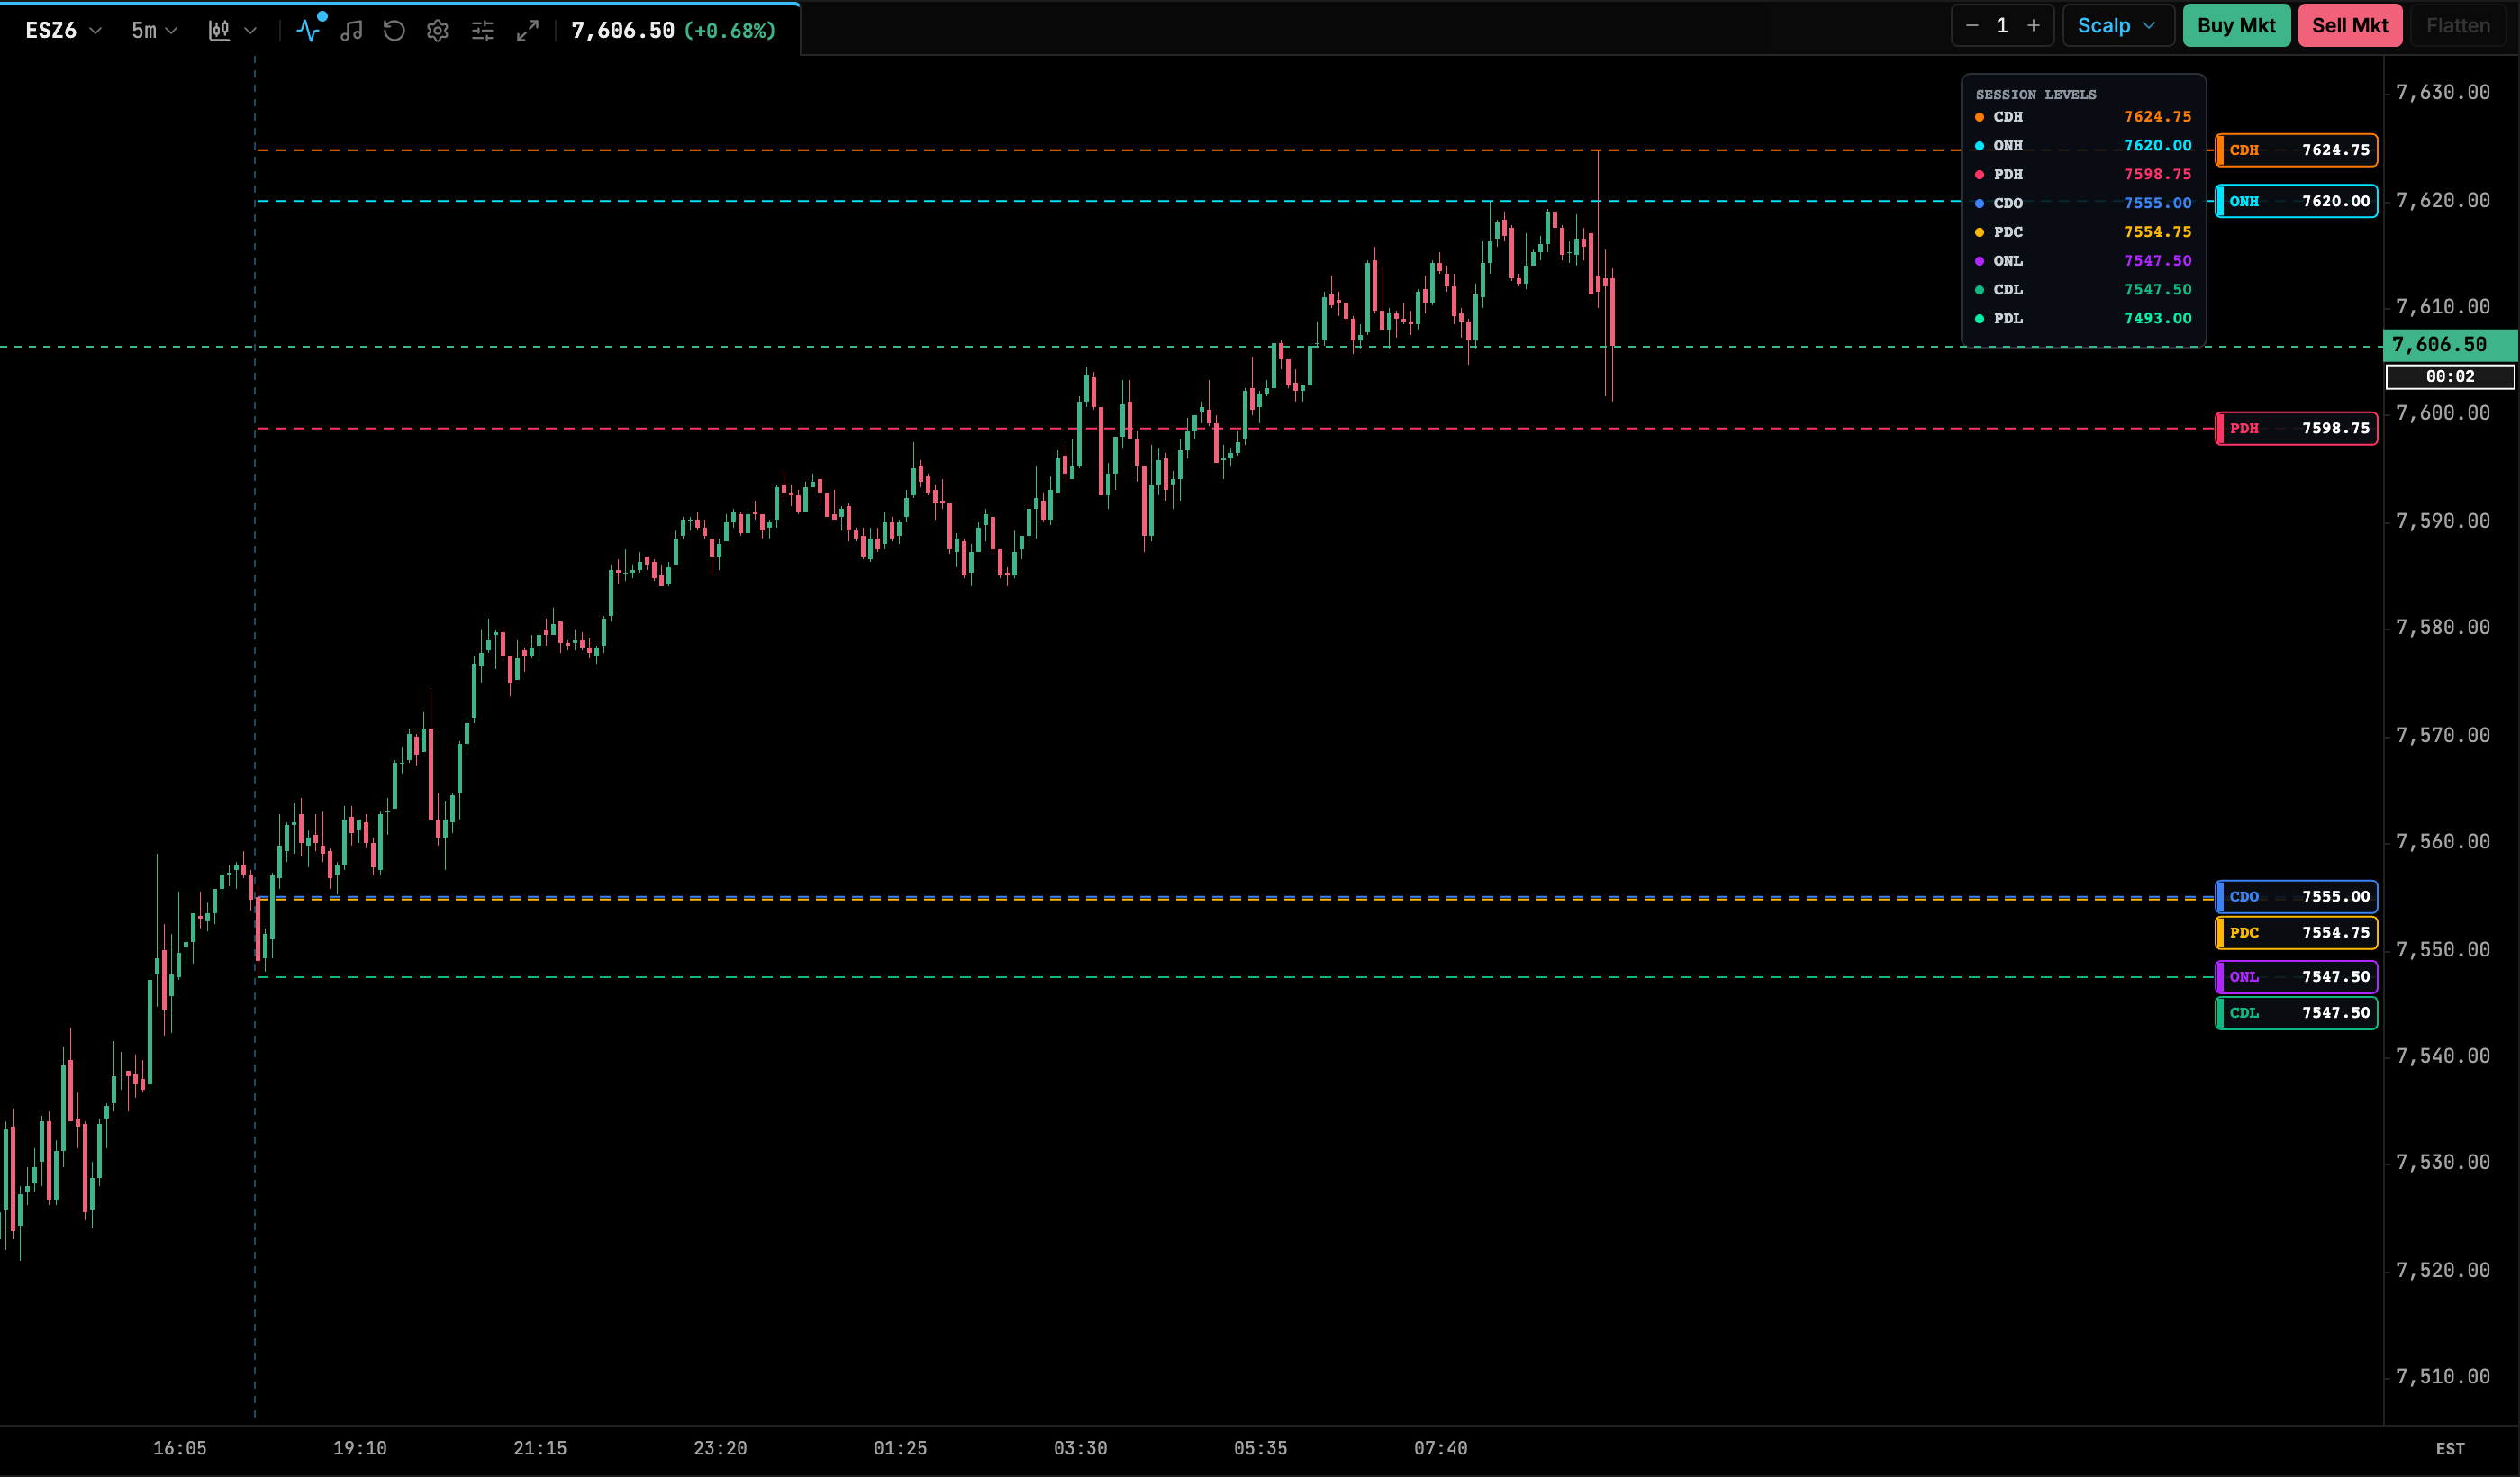
Most of the setups below lean on a small set of reference levels: the session open, the opening range, the initial balance, the prior day’s high, low and close, the overnight high and low, VWAP and the volume profile. Times in this article are US Central Time. The regular trading hours (RTH) session for equity index futures is usually measured from 8:30 a.m. CT (9:30 a.m. ET), when US cash equities open. See futures trading hours and sessions for the full schedule.
How does an opening range breakout work?
The idea. The first minutes after the RTH open often set a range as overnight positions are adjusted and new orders arrive. An opening range breakout (ORB) assumes that if price leaves that range with conviction, it may continue in that direction for a while.
How traders define it:
- Range: the high and low of the first 5, 15 or 30 minutes after 8:30 a.m. CT. The window is a choice; pick one and keep it fixed while you test.
- Entry: a stop order a tick beyond the range high (long) or low (short), or a close of a bar outside the range.
- Stop: commonly the opposite side of the range, or its midpoint for a tighter stop.
- Target: a multiple of the range width, the next reference level (overnight high, prior day high) or a trailing stop.
Where it tends to work and fail. Breakout traders often look for days with a clear catalyst, or for opens away from the prior day’s range, where a directional move is more plausible. Breakouts often struggle on quiet, range-bound days, where price breaks one side, reverses and breaks the other. That second pattern is the failed breakout covered later.
What to look at: the size of the range compared with recent days, where the range sits relative to yesterday’s high and low, volume on the break and whether price holds outside the range after the first retest.
How do traders use initial balance breaks and extensions?
The idea. The initial balance (IB) is the high and low of the first hour of RTH, from 8:30 to 9:30 a.m. CT. It comes from market profile, where the first hour is seen as the period when early participants establish a range. A break of the IB suggests other participants are willing to push price into new territory. A day that stays inside the IB suggests balance.
How traders define it:
- Entry: a break of the IB high or low, often with a requirement that price holds outside it, for example on a closed bar or a retest.
- Stop: back inside the IB, at the IB midpoint, or the far side of the IB for wider stops.
- Targets: IB extensions, which are multiples of the IB range projected from the high or low. Common reference points are 50%, 100% and sometimes 150% or 200% of the range.
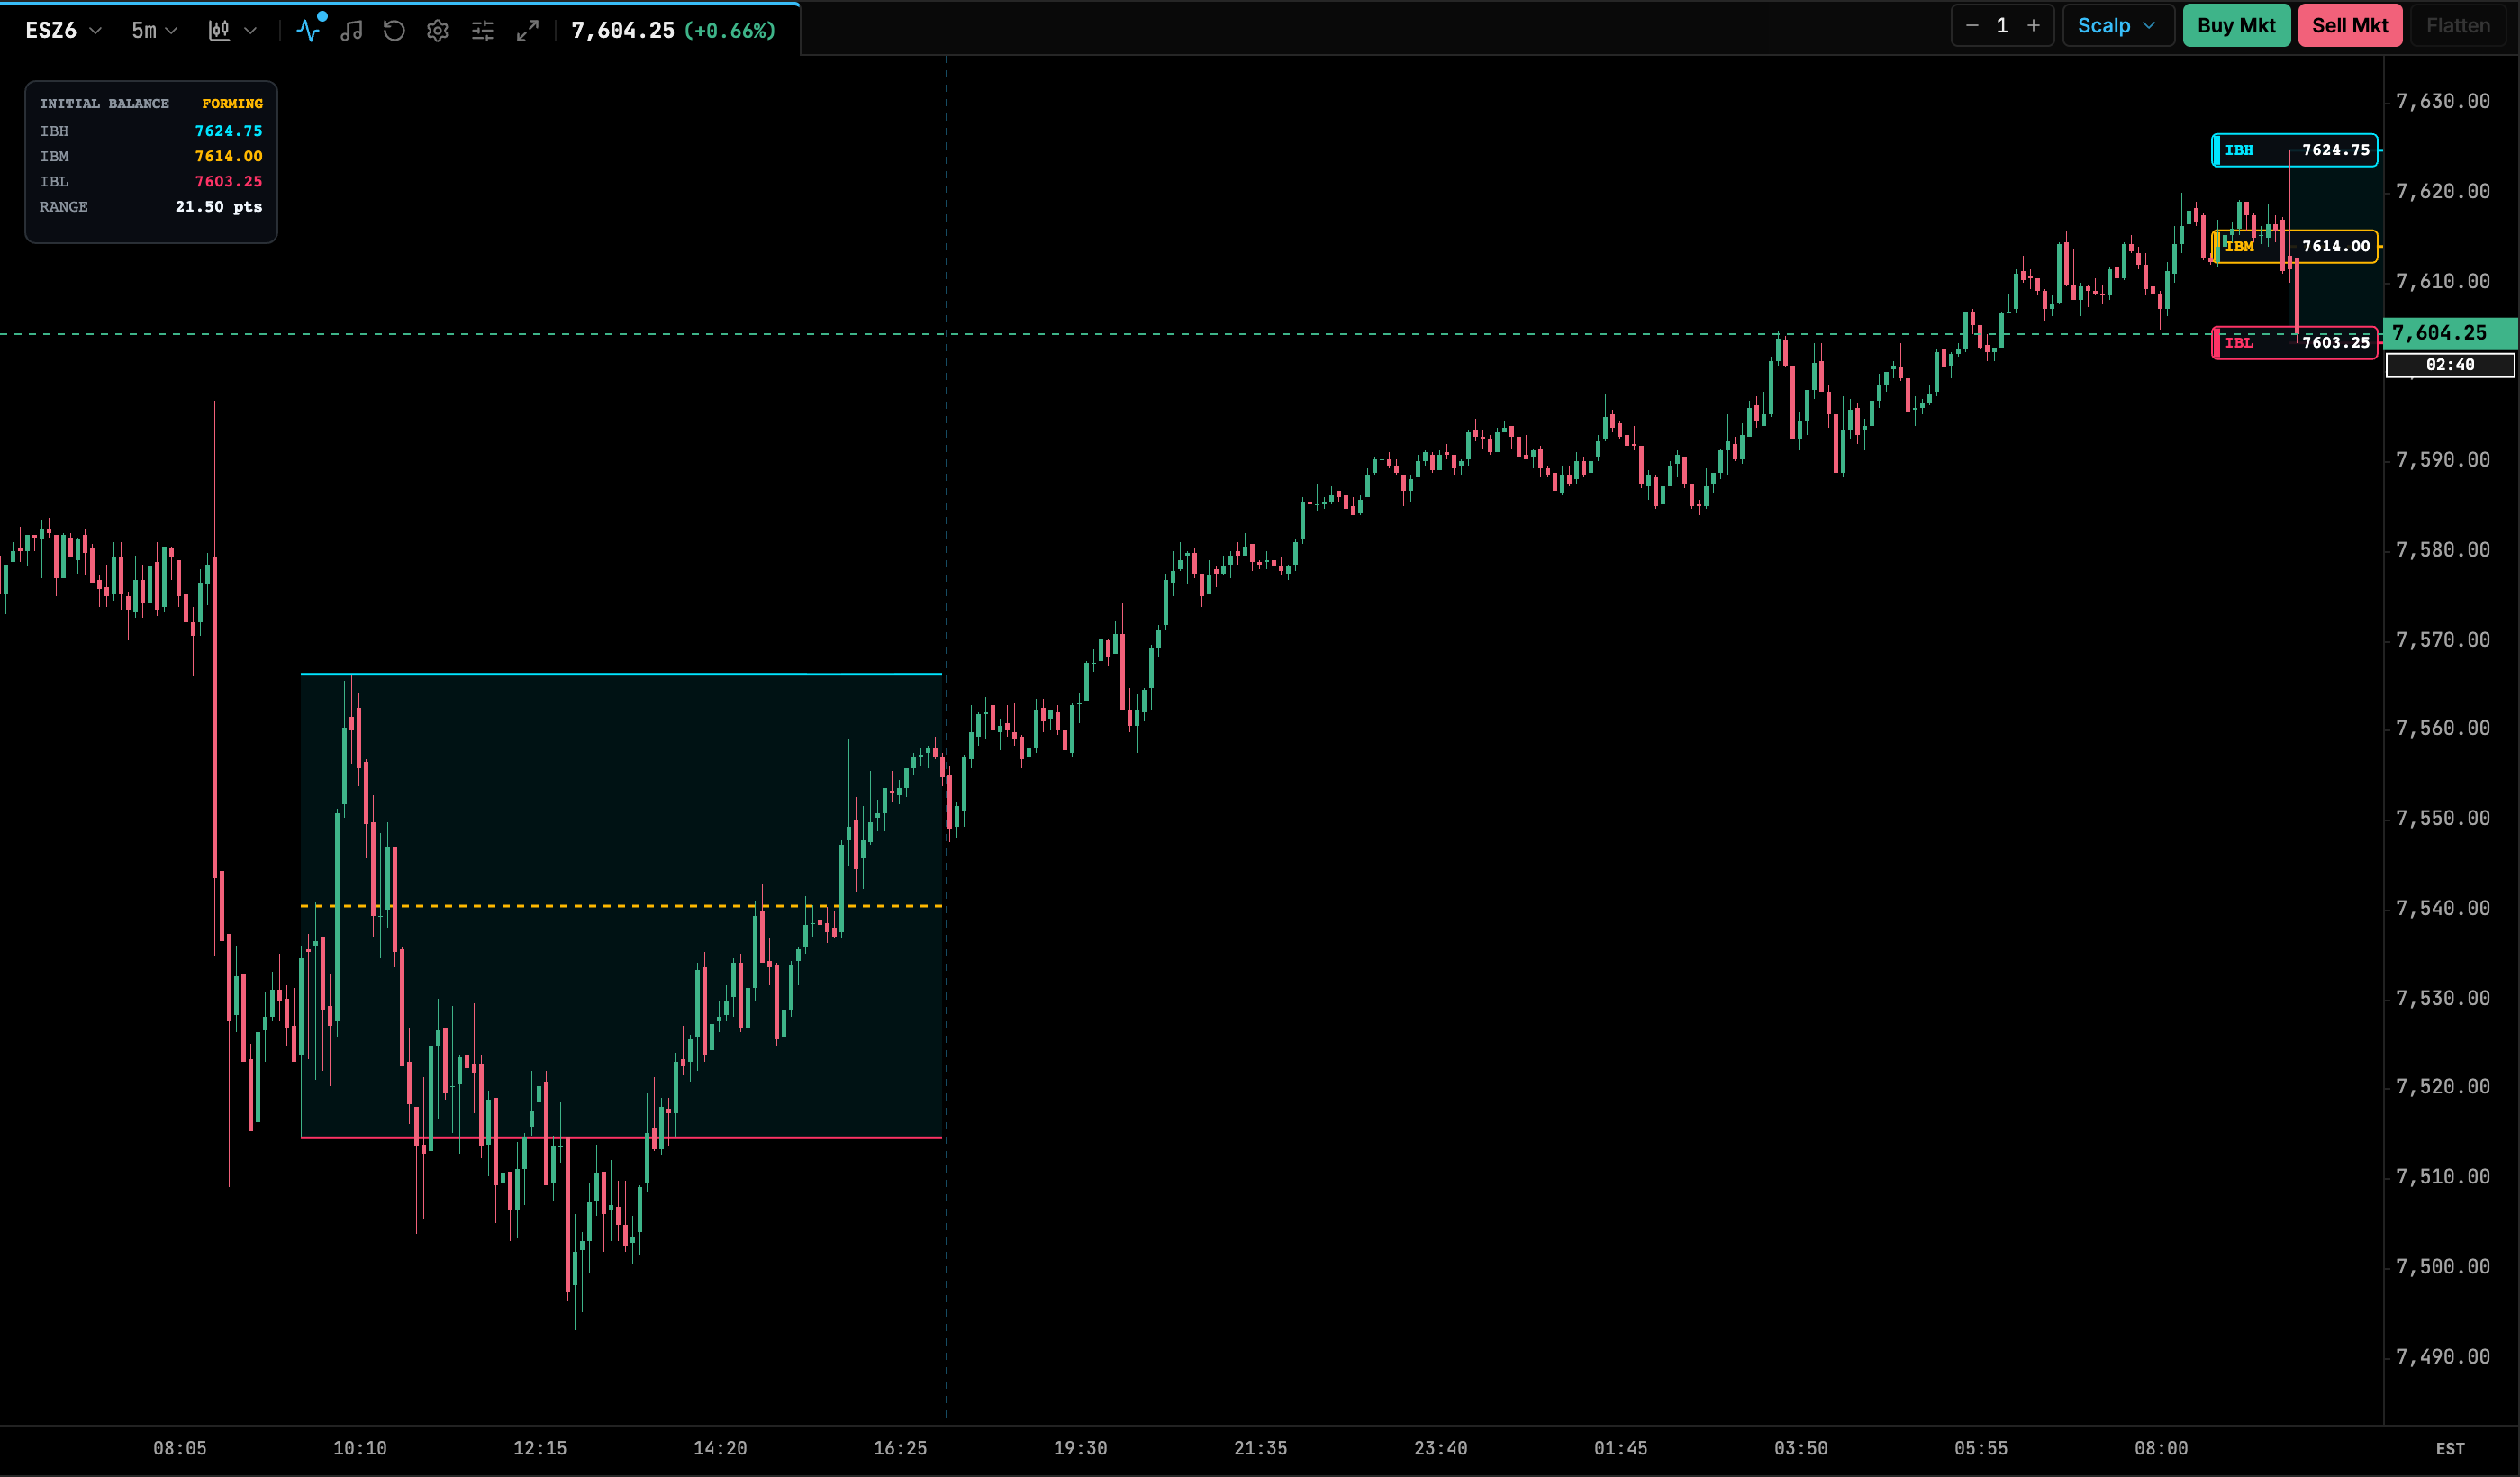
Where it tends to work and fail. A narrow IB compared with recent sessions is often read as room for range extension later. A wide IB may already contain much of the day’s range, so a breakout has less room to travel. IB breaks can fail when price pokes through, finds no follow-through and returns inside, which some traders then treat as a signal in the other direction.
What to look at: the IB width relative to recent IBs, whether the break comes with rising volume, and where the IB sits against the prior day’s value area.
When do traders use VWAP for reversion, and when for trend?
VWAP (volume-weighted average price) is the average price weighted by volume since the session began. Many institutions use it as an execution benchmark, which is one reason intraday traders watch it. It’s often plotted with standard-deviation bands above and below.
The same line supports two opposite setups. Which one you use depends on what kind of day you think it is.
VWAP reversion
The idea. On balanced or rotational days, price tends to oscillate around VWAP. When price stretches far from it, for example to the second band, a reversion trader looks for signs that the move is tiring and targets a return toward VWAP.
- Entry: a rejection at an outer band, often confirmed by a reversal bar or by order flow.
- Stop: beyond the band or beyond the extreme of the stretch.
- Target: VWAP itself, or the first band on the way back.
VWAP trend days
The idea. On trend days, price stays on one side of VWAP for most of the session and VWAP slopes steadily. Pullbacks to VWAP or to the first band can act as areas where trend traders rejoin.
- Entry: a pullback that holds VWAP or the first band, then resumes in the trend direction.
- Stop: a clear move through VWAP to the other side.
- Target: prior highs or lows, the next band, or a trailing stop.
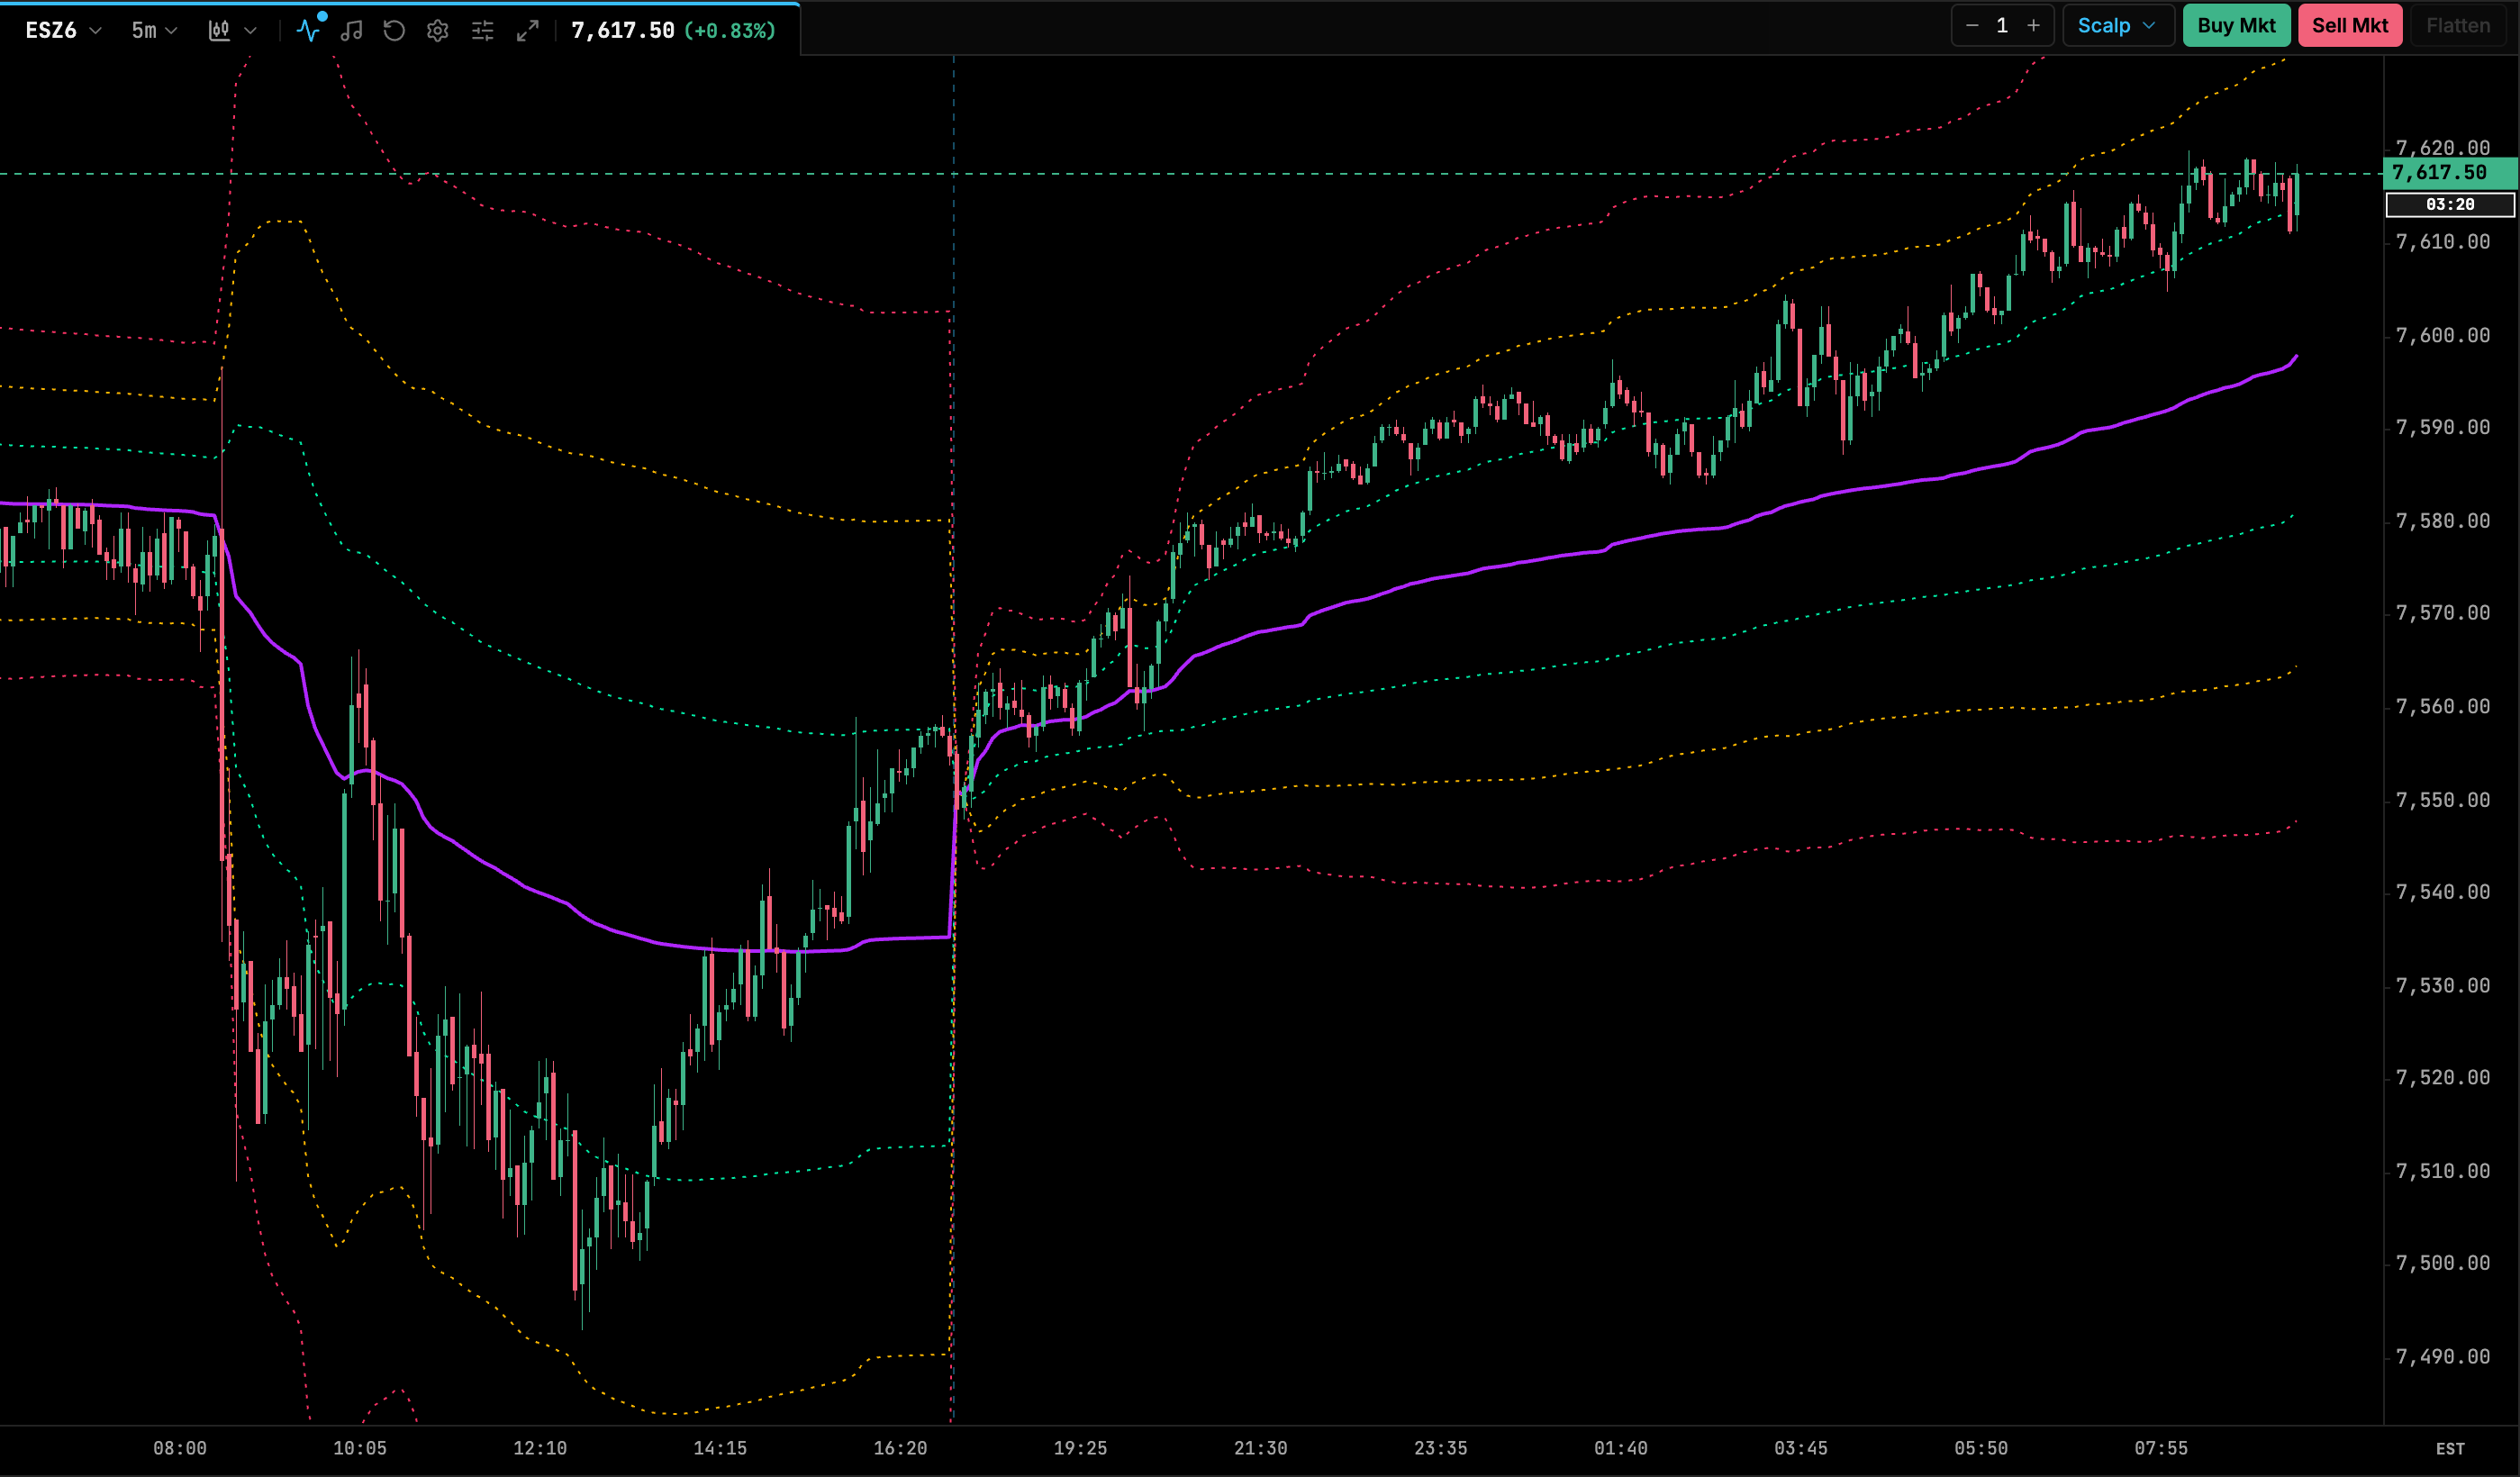
Where they work and fail. Reversion trades tend to struggle on trend days, because price can ride an outer band for a long time. Trend pullback trades tend to struggle on rotational days, where price crosses VWAP repeatedly. Some traders use the slope of VWAP and the number of times price has crossed it as a rough filter for which approach to consider. Others anchor a VWAP to a specific event, such as the RTH open or a major high, instead of the session start.
What is the value area 80% rule?
The 80% rule is a market profile heuristic about the prior day’s value area. The value area is the price range where a set share of the session’s volume or time took place, conventionally about 70%, with the point of control (POC) at the price where the most volume or time occurred. For how value areas are built, see volume profile explained.
The heuristic. If price opens outside the prior day’s value area, then moves back inside and is accepted there, traders watch for price to rotate through the value area to its opposite edge. “Accepted” is often defined as trading inside the value area for two consecutive 30-minute periods on a TPO chart, although traders use different versions.
The name is traditional. Don’t read “80%” as a probability, and don’t assume it describes how often the rotation happens in the market you trade. This article makes no claim about that. If you want to know how the idea behaves, test it yourself.
How traders typically define it:
- Entry: once the acceptance condition is met, in the direction of the far side of the value area.
- Stop: back outside the value area on the side price came from, or beyond the most recent swing.
- Target: the opposite edge of the prior value area, sometimes with a partial exit at the prior POC.
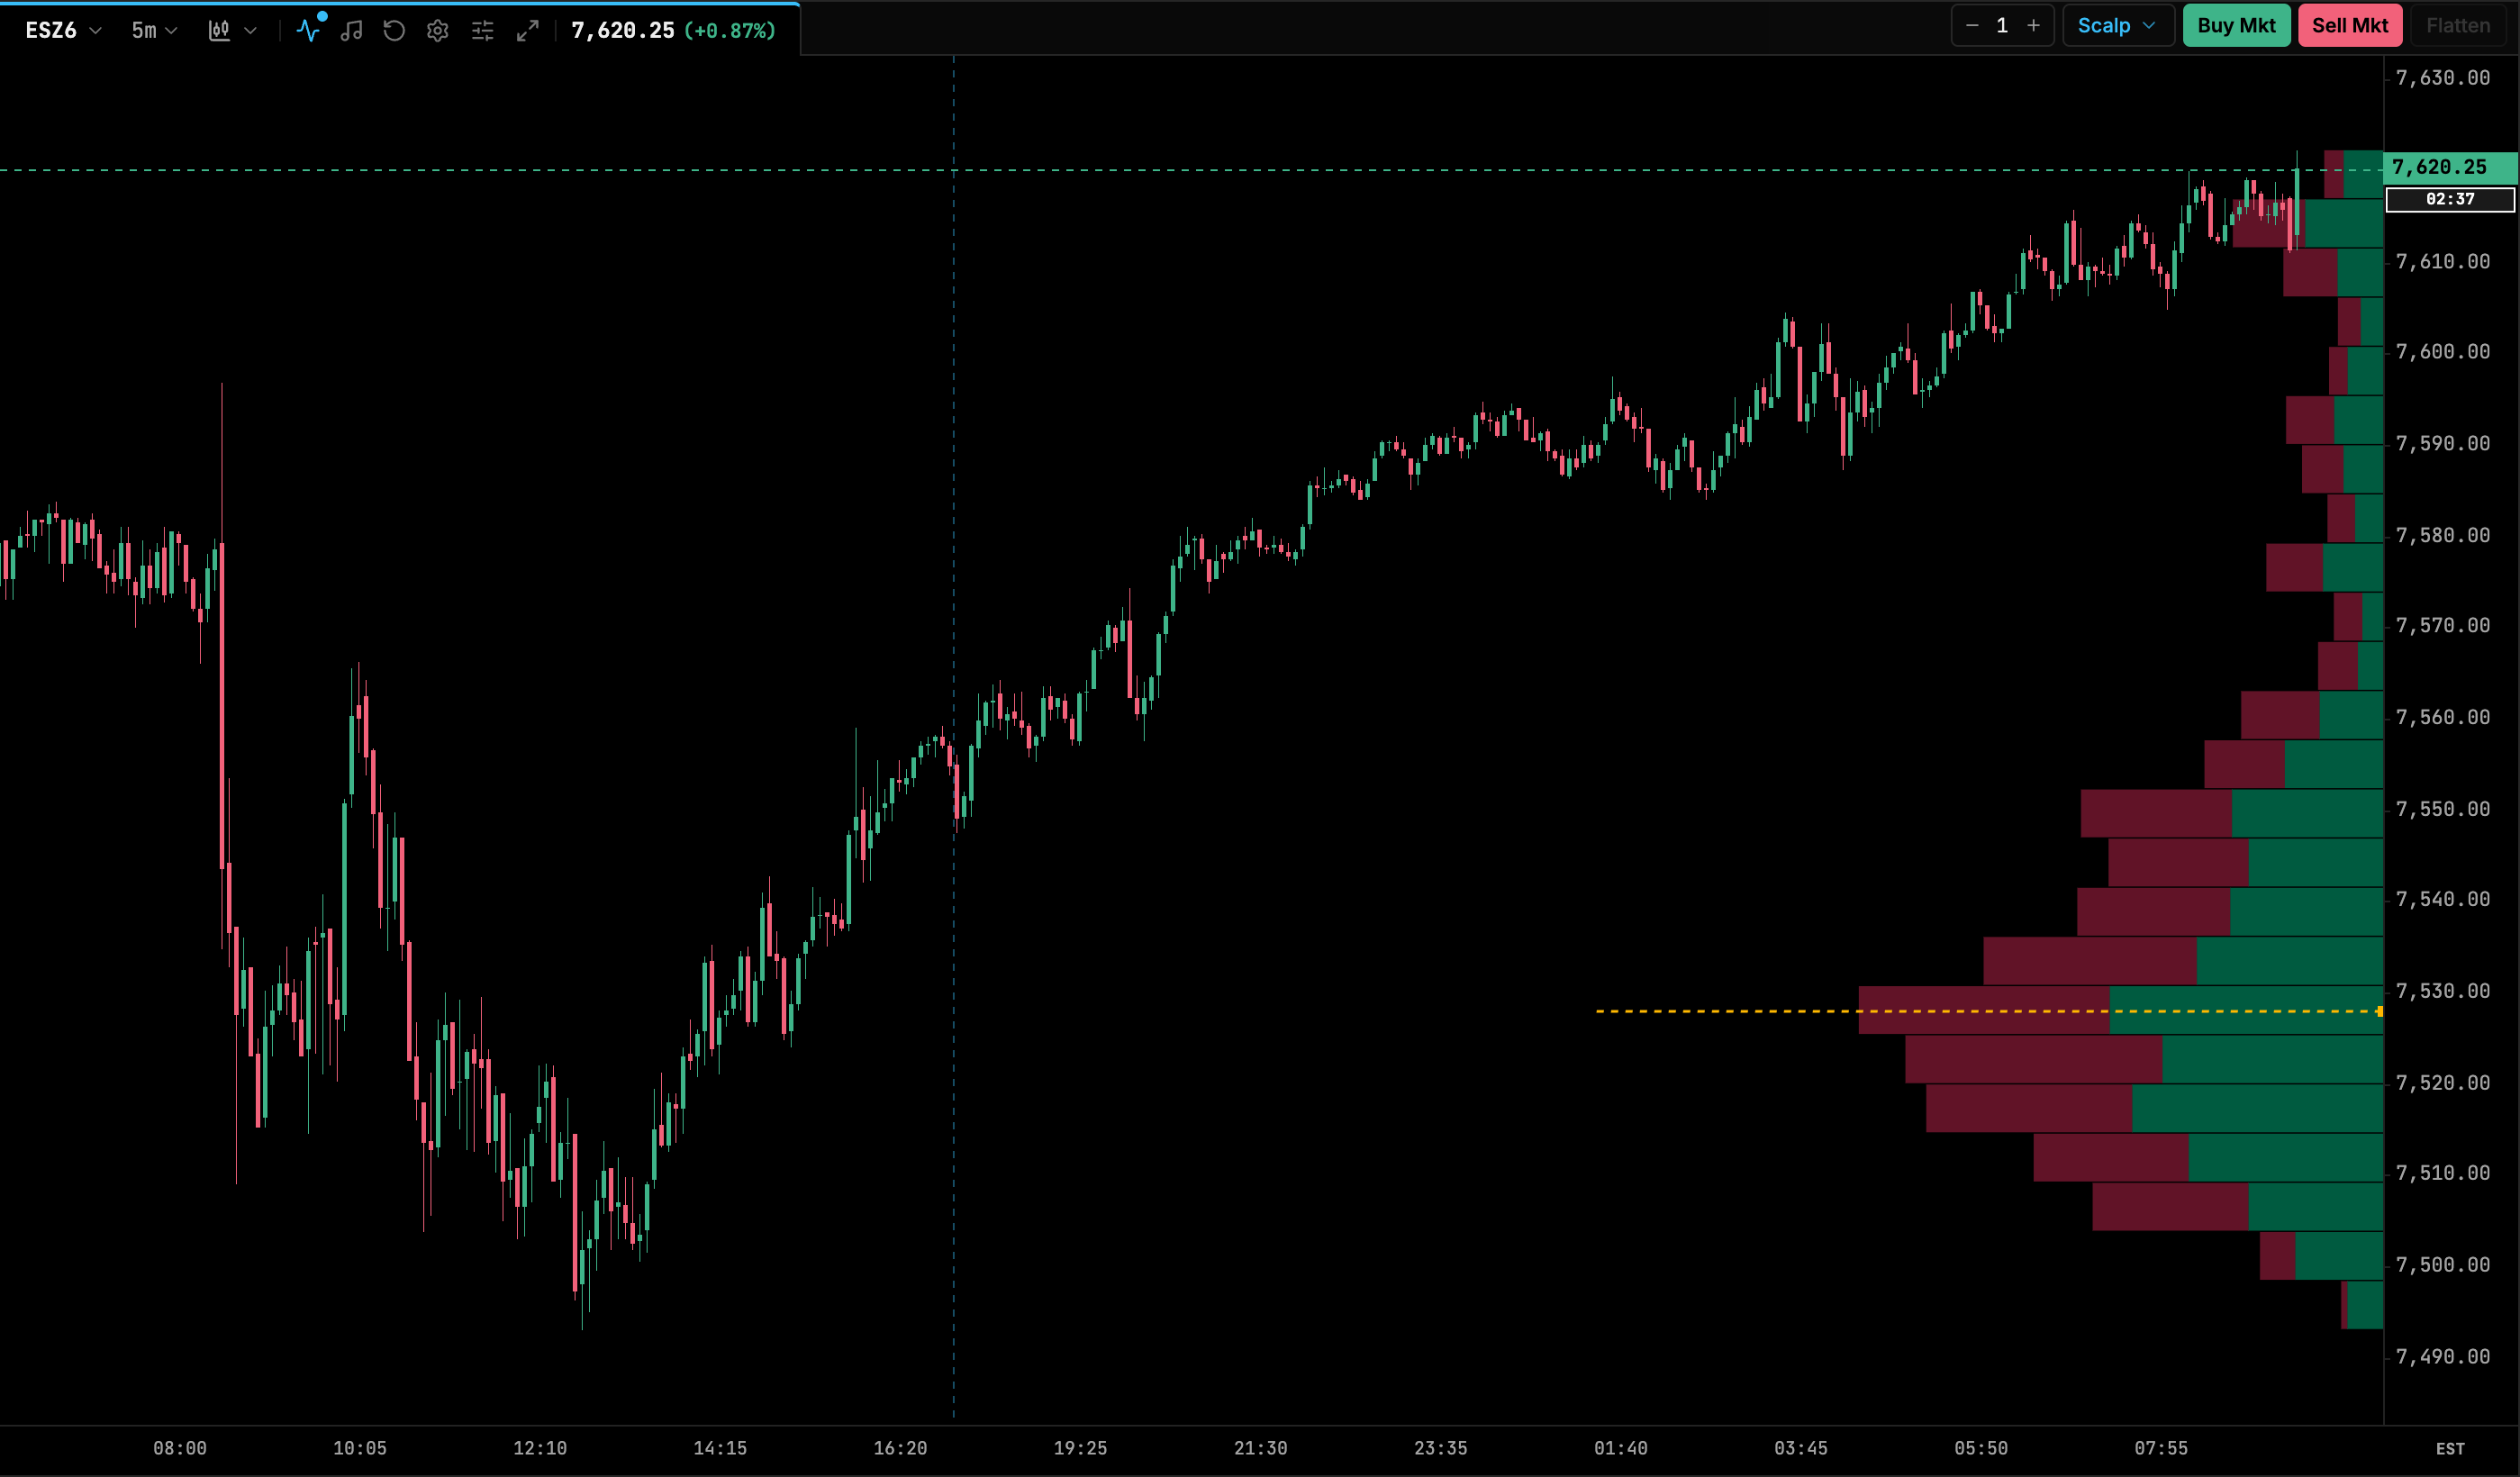
Where it tends to work and fail. The idea assumes that once price returns to an area where it recently traded heavily, it may explore that whole area. It tends to struggle when the return inside is brief and price is rejected back out, or when news changes the picture. It also depends on which value area you use: volume-based or TPO-based, and full session or RTH only.
How do trend pullbacks with moving averages and market structure work?
The idea. In a trending market, price rarely moves in a straight line. Trend traders wait for a pullback against the trend and look to join when it ends, so their stop can be placed closer than it would be on a breakout.
There are two common ways to define the trend:
- Moving averages: price above a rising moving average (for example a 20-period EMA) is treated as an uptrend, and pullbacks to the average are watched for entries.
- Market structure: an uptrend is a series of higher highs (HH) and higher lows (HL). A break of the last high in the trend direction is often called a break of structure (BOS). The first break against the trend, for example a lower low in an uptrend, is often called a change of character (CHoCH) and is read as a warning that the trend may be ending.
How traders define it:
- Entry: a pullback that holds above the prior higher low or the moving average, then a bar that resumes in the trend direction.
- Stop: below the most recent higher low (long) or above the most recent lower high (short).
- Target: a retest of the prior high, the next reference level, or a trailing stop under each new higher low.
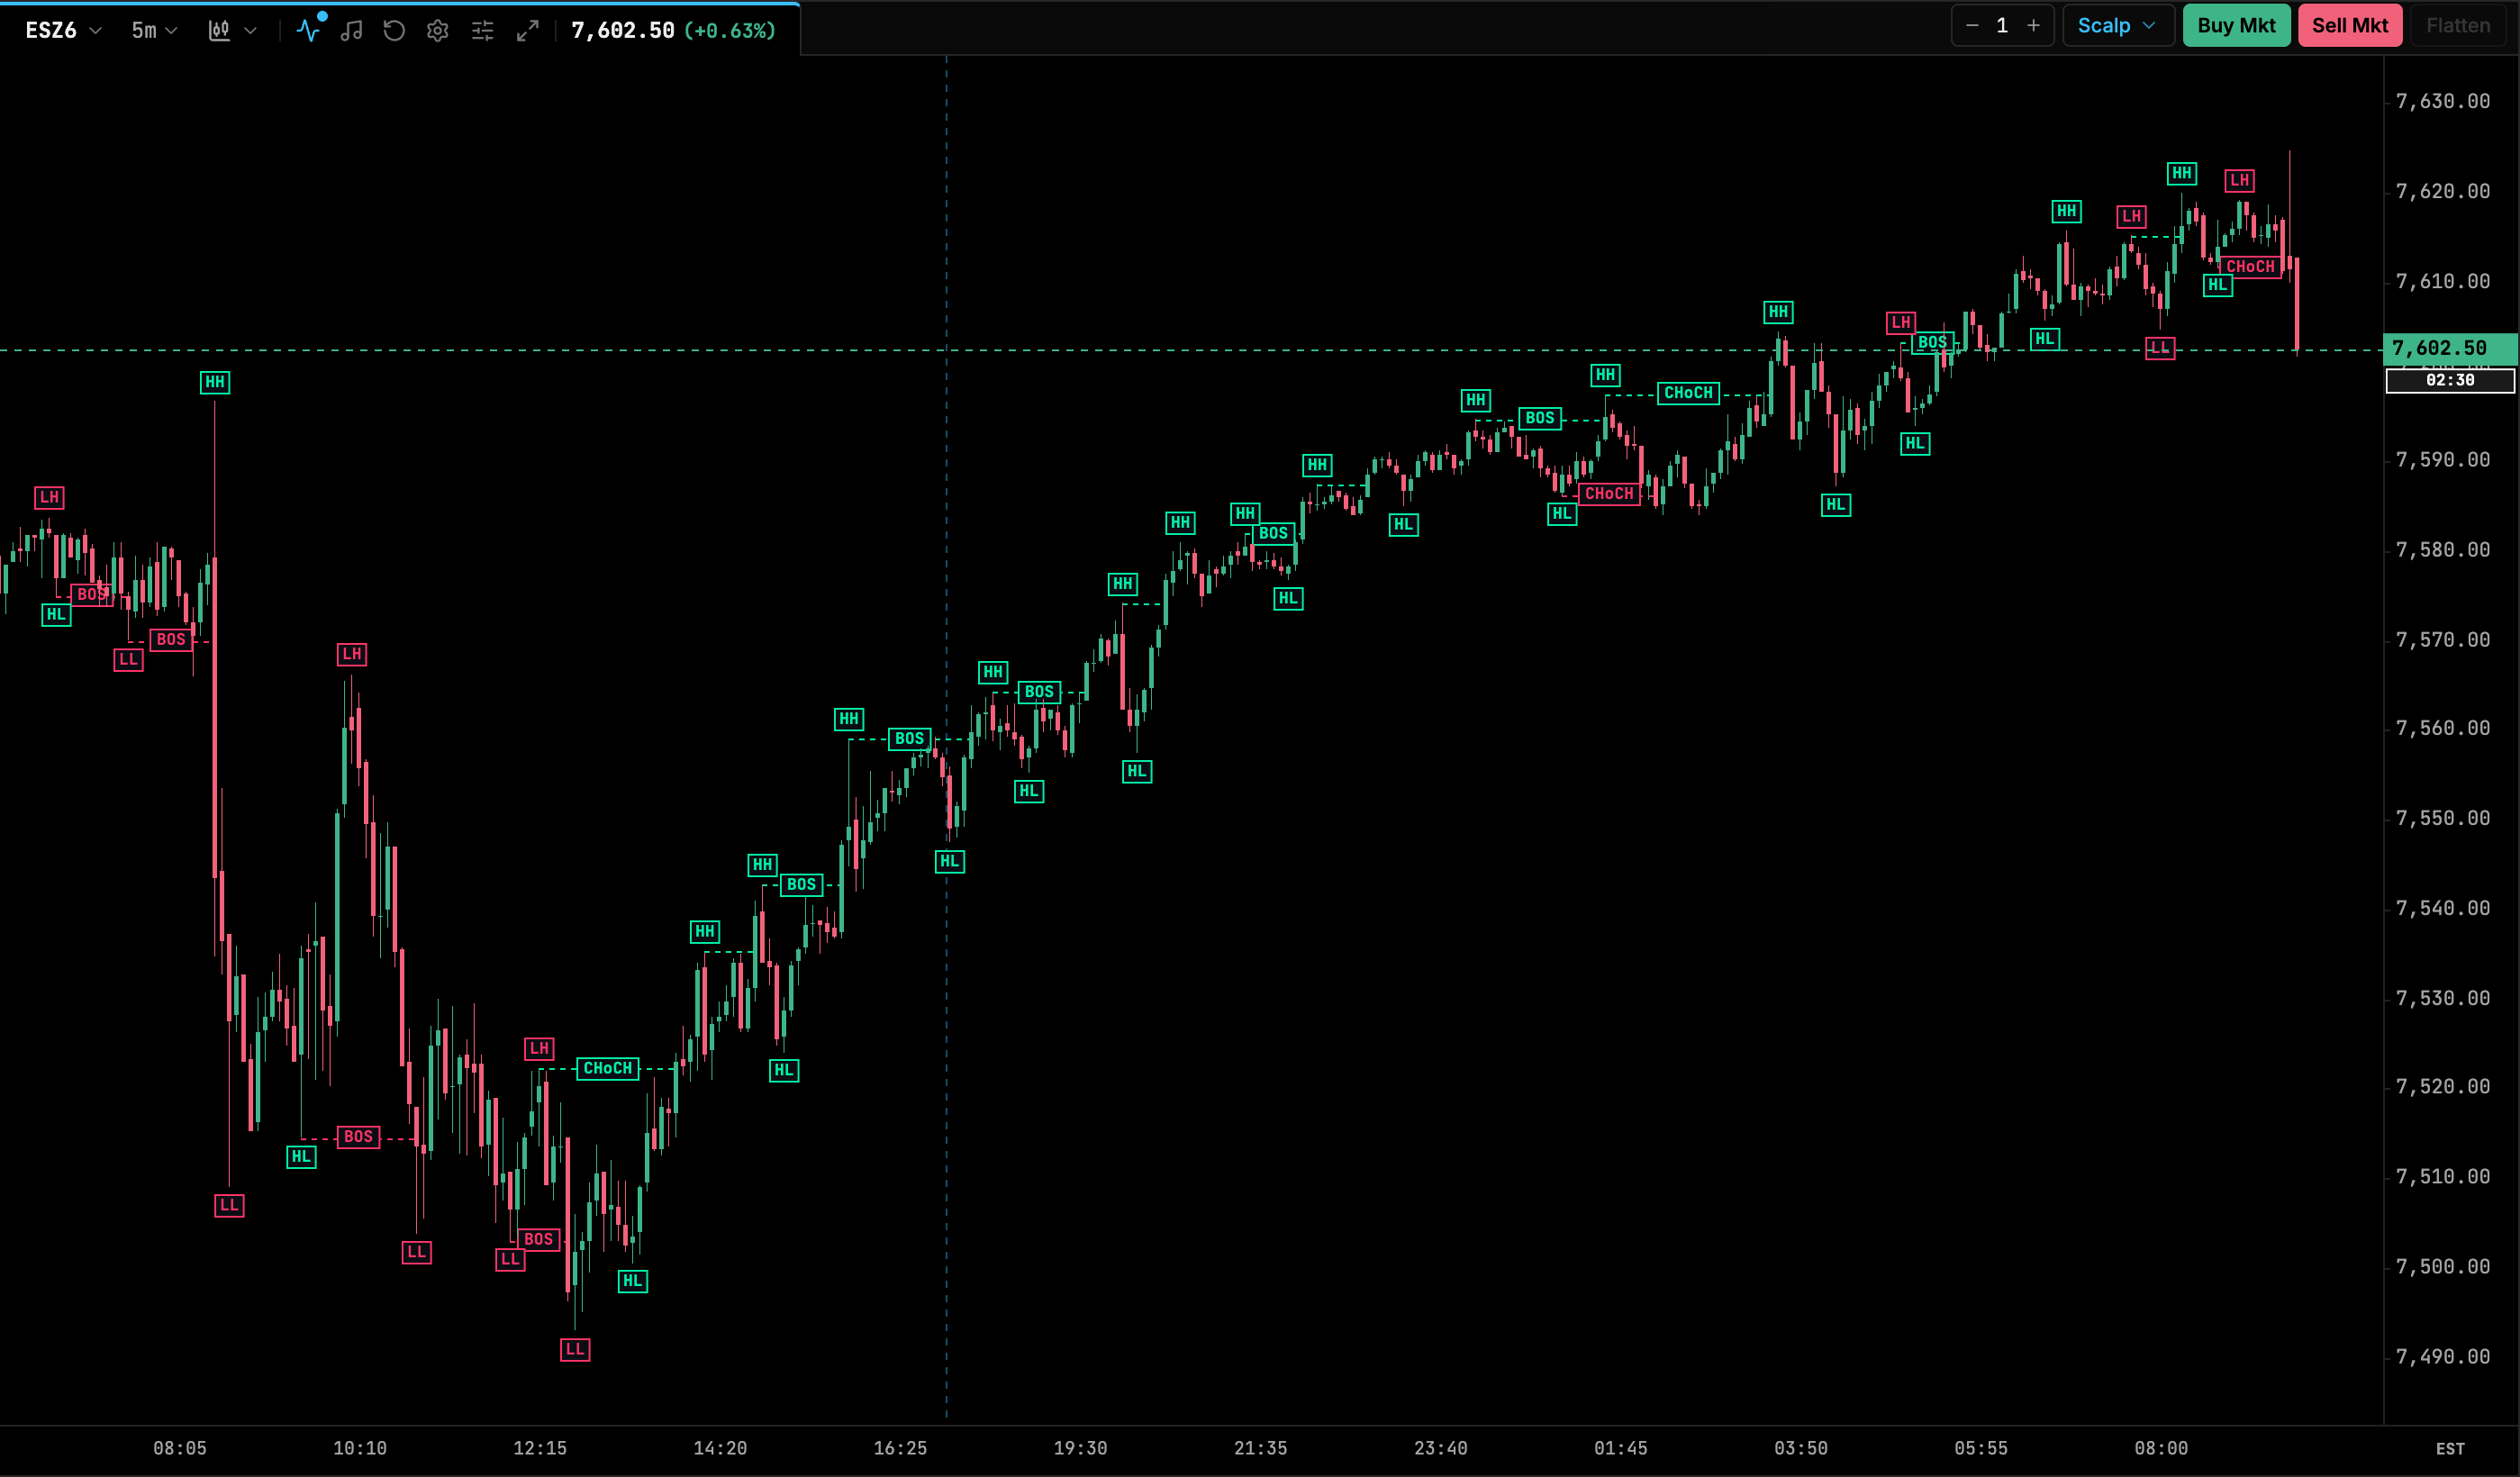
Where it tends to work and fail. Pullback entries tend to fit steady trends. In choppy markets, swings are small and overlapping, so structure flips back and forth and moving averages go flat. Every trend eventually ends, and the last pullback before a reversal looks just like the earlier ones, which is why the stop matters.
What to look at: the slope of the average, how deep pullbacks are compared with the moves before them, and whether pullbacks are happening on lighter volume than the trend moves.
How do failed breakouts and reversals at prior day levels work?
The idea. The prior day’s high and low, and the overnight high and low, are levels many traders watch. Stop orders often sit just beyond them, and breakout traders enter on a break. If price breaks a level, triggers those orders and then can’t hold beyond it, the traders who bought the break may be trapped. Their exits can push price back the other way.
How traders define it:
- Entry: price trades beyond the level, then moves or closes back inside. Some traders wait for a retest of the level from the inside.
- Stop: beyond the extreme of the failed break. This gives a clear, nearby invalidation point.
- Target: VWAP, the middle of the prior day’s range, or the opposite side of the overnight range.
Where it tends to work and fail. Failed breakouts tend to appear on range-bound days and around levels that many traders can see. They tend to fail when the break is the start of a genuine trend: price returns inside briefly, then breaks out again and runs. This is the mirror image of the opening range breakout, which is a useful reminder that the same price action is a win for one setup and a loss for the other.
What to look at: how far price traveled beyond the level, whether volume increased on the break and then dried up, and whether order flow showed heavy aggressive trading that failed to move price.
How is order flow used to confirm a setup?
Order flow analysis looks at the trades themselves: who was aggressive, at which prices, and how much traded. Most traders don’t use it as a standalone setup. They use it to confirm or reject a trade at a level they already planned, such as the prior day low or a VWAP band. For a full introduction, see the order flow trading guide.
Absorption at a level. Absorption happens when aggressive market orders hit a price repeatedly but price doesn’t move, because large passive limit orders soak them up. On a footprint chart this can show as heavy selling at the bid near a low while the low holds, or heavy buying at the offer near a high while the high holds. See footprint charts explained for how to read that data.
How traders define it:
- Context: price reaches a level from your plan.
- Confirmation: heavy aggressive volume or a strong delta reading at the level, but price fails to continue, then the next bars move away.
- Entry: as price moves away from the absorbed level.
- Stop: a few ticks beyond the level where absorption occurred. If the passive orders get filled through, the reason for the trade is gone.
- Target: the next reference level, VWAP, or the other side of the range.
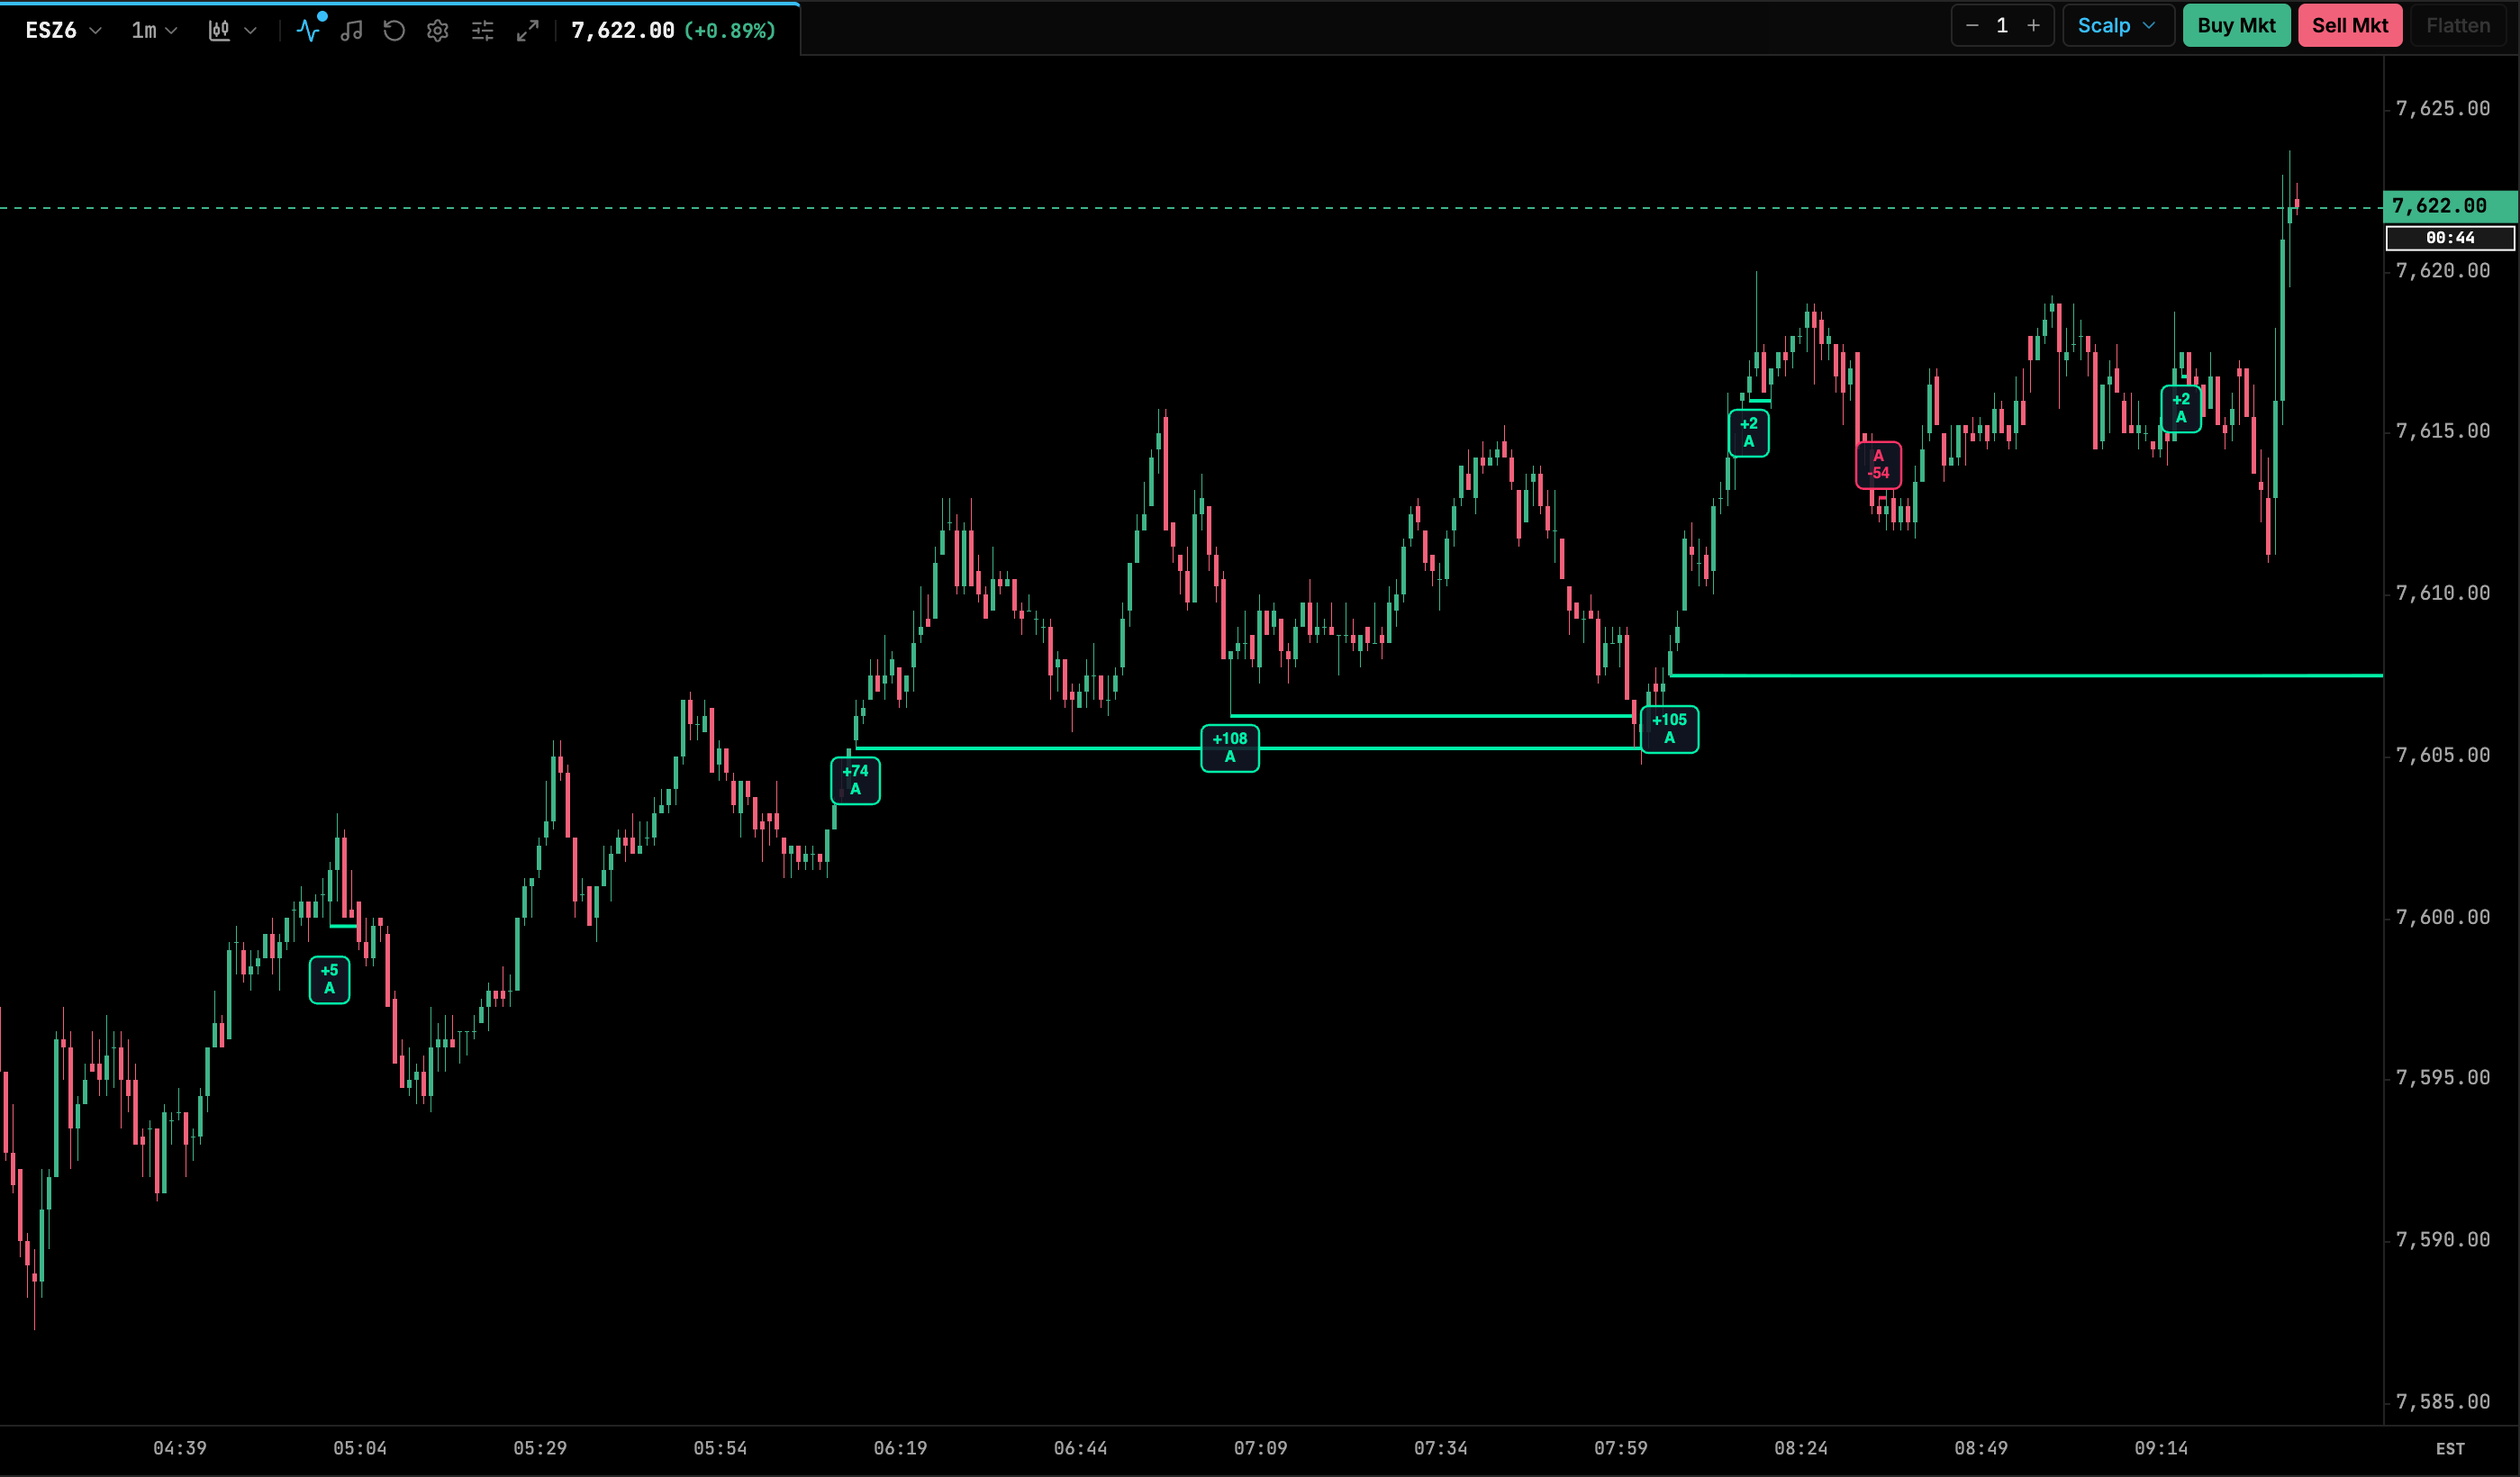
Where it tends to work and fail. Absorption is easier to read in liquid markets at clear levels. It can mislead when passive orders are pulled before price arrives, or when the absorbing side is eventually overwhelmed and the level breaks hard. Some order flow data on older historical bars is estimated rather than recorded trade by trade, so check how your platform builds it.
How do you choose a setup that fits your schedule and personality?
A setup that doesn’t fit your day is hard to execute consistently, whatever its merits.
Start with your schedule:
| If you can trade… | Setups that happen in that window |
|---|---|
| The first hour of RTH | Opening range breakouts, IB formation, early reversals at overnight levels |
| Mid-morning | IB breaks and extensions, VWAP trades, the 80% rule once acceptance is clear |
| Midday or afternoon | VWAP trend pullbacks, market structure pullbacks |
| Overnight sessions | Range trades around overnight levels, usually in thinner markets |
Then consider how you like to make decisions:
- Breakout and trend setups suit traders who are comfortable entering when price already looks extended and who accept frequent small losses while waiting for larger moves.
- Reversion and failed breakout setups suit traders who prefer entering against a move at a defined level, with tight stops and nearer targets.
- Order flow confirmation suits traders who can watch fast data closely. It can be tiring over a full session.
Match the market too. ES, NQ and CL behave differently, and their tick values are different. A 20-tick stop means something different on each, so translate your rules into dollars for the contract you trade.
Many traders find it easier to learn one setup well than to switch between several. Once one is familiar, adding a second that suits the opposite kind of day can help.
How do you test a day trading setup before trading it live?
Testing is how you find out whether you can execute a setup and how it behaves in the market you trade. Results from past sessions don’t guarantee anything about future ones, but testing removes guesswork about your own rules.
Write the rules down
Write the context, entry, stop, target and skip conditions precisely enough that someone else could follow them. “Buy the breakout” isn’t testable. “Buy one tick above the 15-minute opening range high, stop one tick below the range low, skip if the range is wider than the last 10 sessions’ average” is.
Practice on market replay
Market replay plays back a past session so you can trade it as if it were live, without risking money. It lets you rehearse a setup many times, at the time of day it actually forms, and practice the mechanics of placing entries and brackets. Treat replay fills with some caution: they may not reflect the queue position and slippage you’d get live.
Build a meaningful sample
A handful of trades tells you very little, because any setup can have a good or bad run by chance. Keep testing until you have enough occurrences across different kinds of days, including trend days, range days and news days. Record every occurrence that meets your rules, not only the ones you liked.
Keep a journal
A trading journal turns practice into data. For each trade, record:
- the setup name and the context (day type, where price opened, any news);
- entry, stop, target and exit prices;
- the result in R, meaning multiples of the amount you risked;
- a screenshot of the chart, and a note on whether you followed your rules.
Understand expectancy
Expectancy is the average amount a setup gains or loses per trade over many trades, often measured in R. Conceptually, it combines how often trades win, the average size of winners, how often they lose and the average size of losers. A setup can have a low share of winning trades and a positive expectancy if its winners are much larger than its losers, and the reverse is also possible.
Expectancy is only as good as the sample behind it, and it describes the past. Include commissions, fees and slippage in your results, because they matter most on setups with small targets.
Why doesn’t any setup work in all market conditions?
Every setup in this article encodes an assumption about the session:
- Breakouts assume range expansion and follow-through.
- Reversion and failed breakouts assume balance and a return toward value.
- Pullbacks assume a trend that continues.
- Order flow confirmation assumes the passive orders you see will hold.
Markets alternate between trending and balancing, and between quiet and volatile conditions, often within the same week. News releases, holidays, the overnight session and contract rollover periods all change how price behaves. When conditions don’t match a setup’s assumption, its rules can produce a string of losses even if you follow them perfectly.
That’s why experienced traders tend to focus as much on when not to take a setup as on the setup itself. Breakout and reversion setups are opposites by design. On any given day, at most one of them fits.
Putting it together
- Pick one or two setups that match the hours you can trade and the way you like to make decisions.
- Define context, entry, stop, target and skip conditions in writing, in ticks and dollars for your contract.
- Practice on replay or a simulator, journal every occurrence and judge the setup on a meaningful sample, including costs.
- Expect every setup to have periods when it doesn’t fit the market, and decide in advance how you’ll handle them.
To go deeper on the tools behind these setups, read volume profile explained and the order flow trading guide.
Frequently asked questions
What is the most common futures day trading strategy?
There isn't a single standard one. Opening range breakouts, VWAP-based trades, initial balance breaks and reversals at prior day levels are all widely discussed, and each suits different market conditions and schedules.
Is there a day trading strategy that works every day?
No. Each setup assumes something about the session, such as a trend or a range. When the market behaves differently, the same rules can produce a run of losing trades, which is why traders also define when to skip a setup.
What is the 80% rule in market profile?
It's a market profile heuristic: if price opens outside the prior day's value area, then moves back inside and is accepted there, traders watch for a rotation to the opposite edge of that value area. The name is traditional and shouldn't be read as a probability.
How should I test a day trading setup?
Write down exact rules, then practice them on market replay or a simulator, record every occurrence in a journal and review the results in terms of risk units. A small number of trades tells you little, so build a larger sample before drawing conclusions.