Volume & Profile Indicators
These indicators show where and how much volume traded: volume-weighted benchmarks, volume histograms, cumulative flow and price-by-volume profiles. They are calculated from bar volume (Session Volume Profile also uses footprint data when it is available), so they work in Market Replay. See the Indicators Overview. Tick-level order flow tools such as delta and big trades are covered in Order Flow.
New to this concept? ReadVolume Profile Explained: POC, Value Area, HVN and LVN.
VWAP
The volume-weighted average of the typical price (HLC/3), with up to three standard-deviation bands around it. It resets at the start of each CME session (18:00 ET), so each trading day starts fresh. Institutions use VWAP as an execution benchmark. Intraday traders treat it and its bands as dynamic support, resistance and mean-reversion targets.
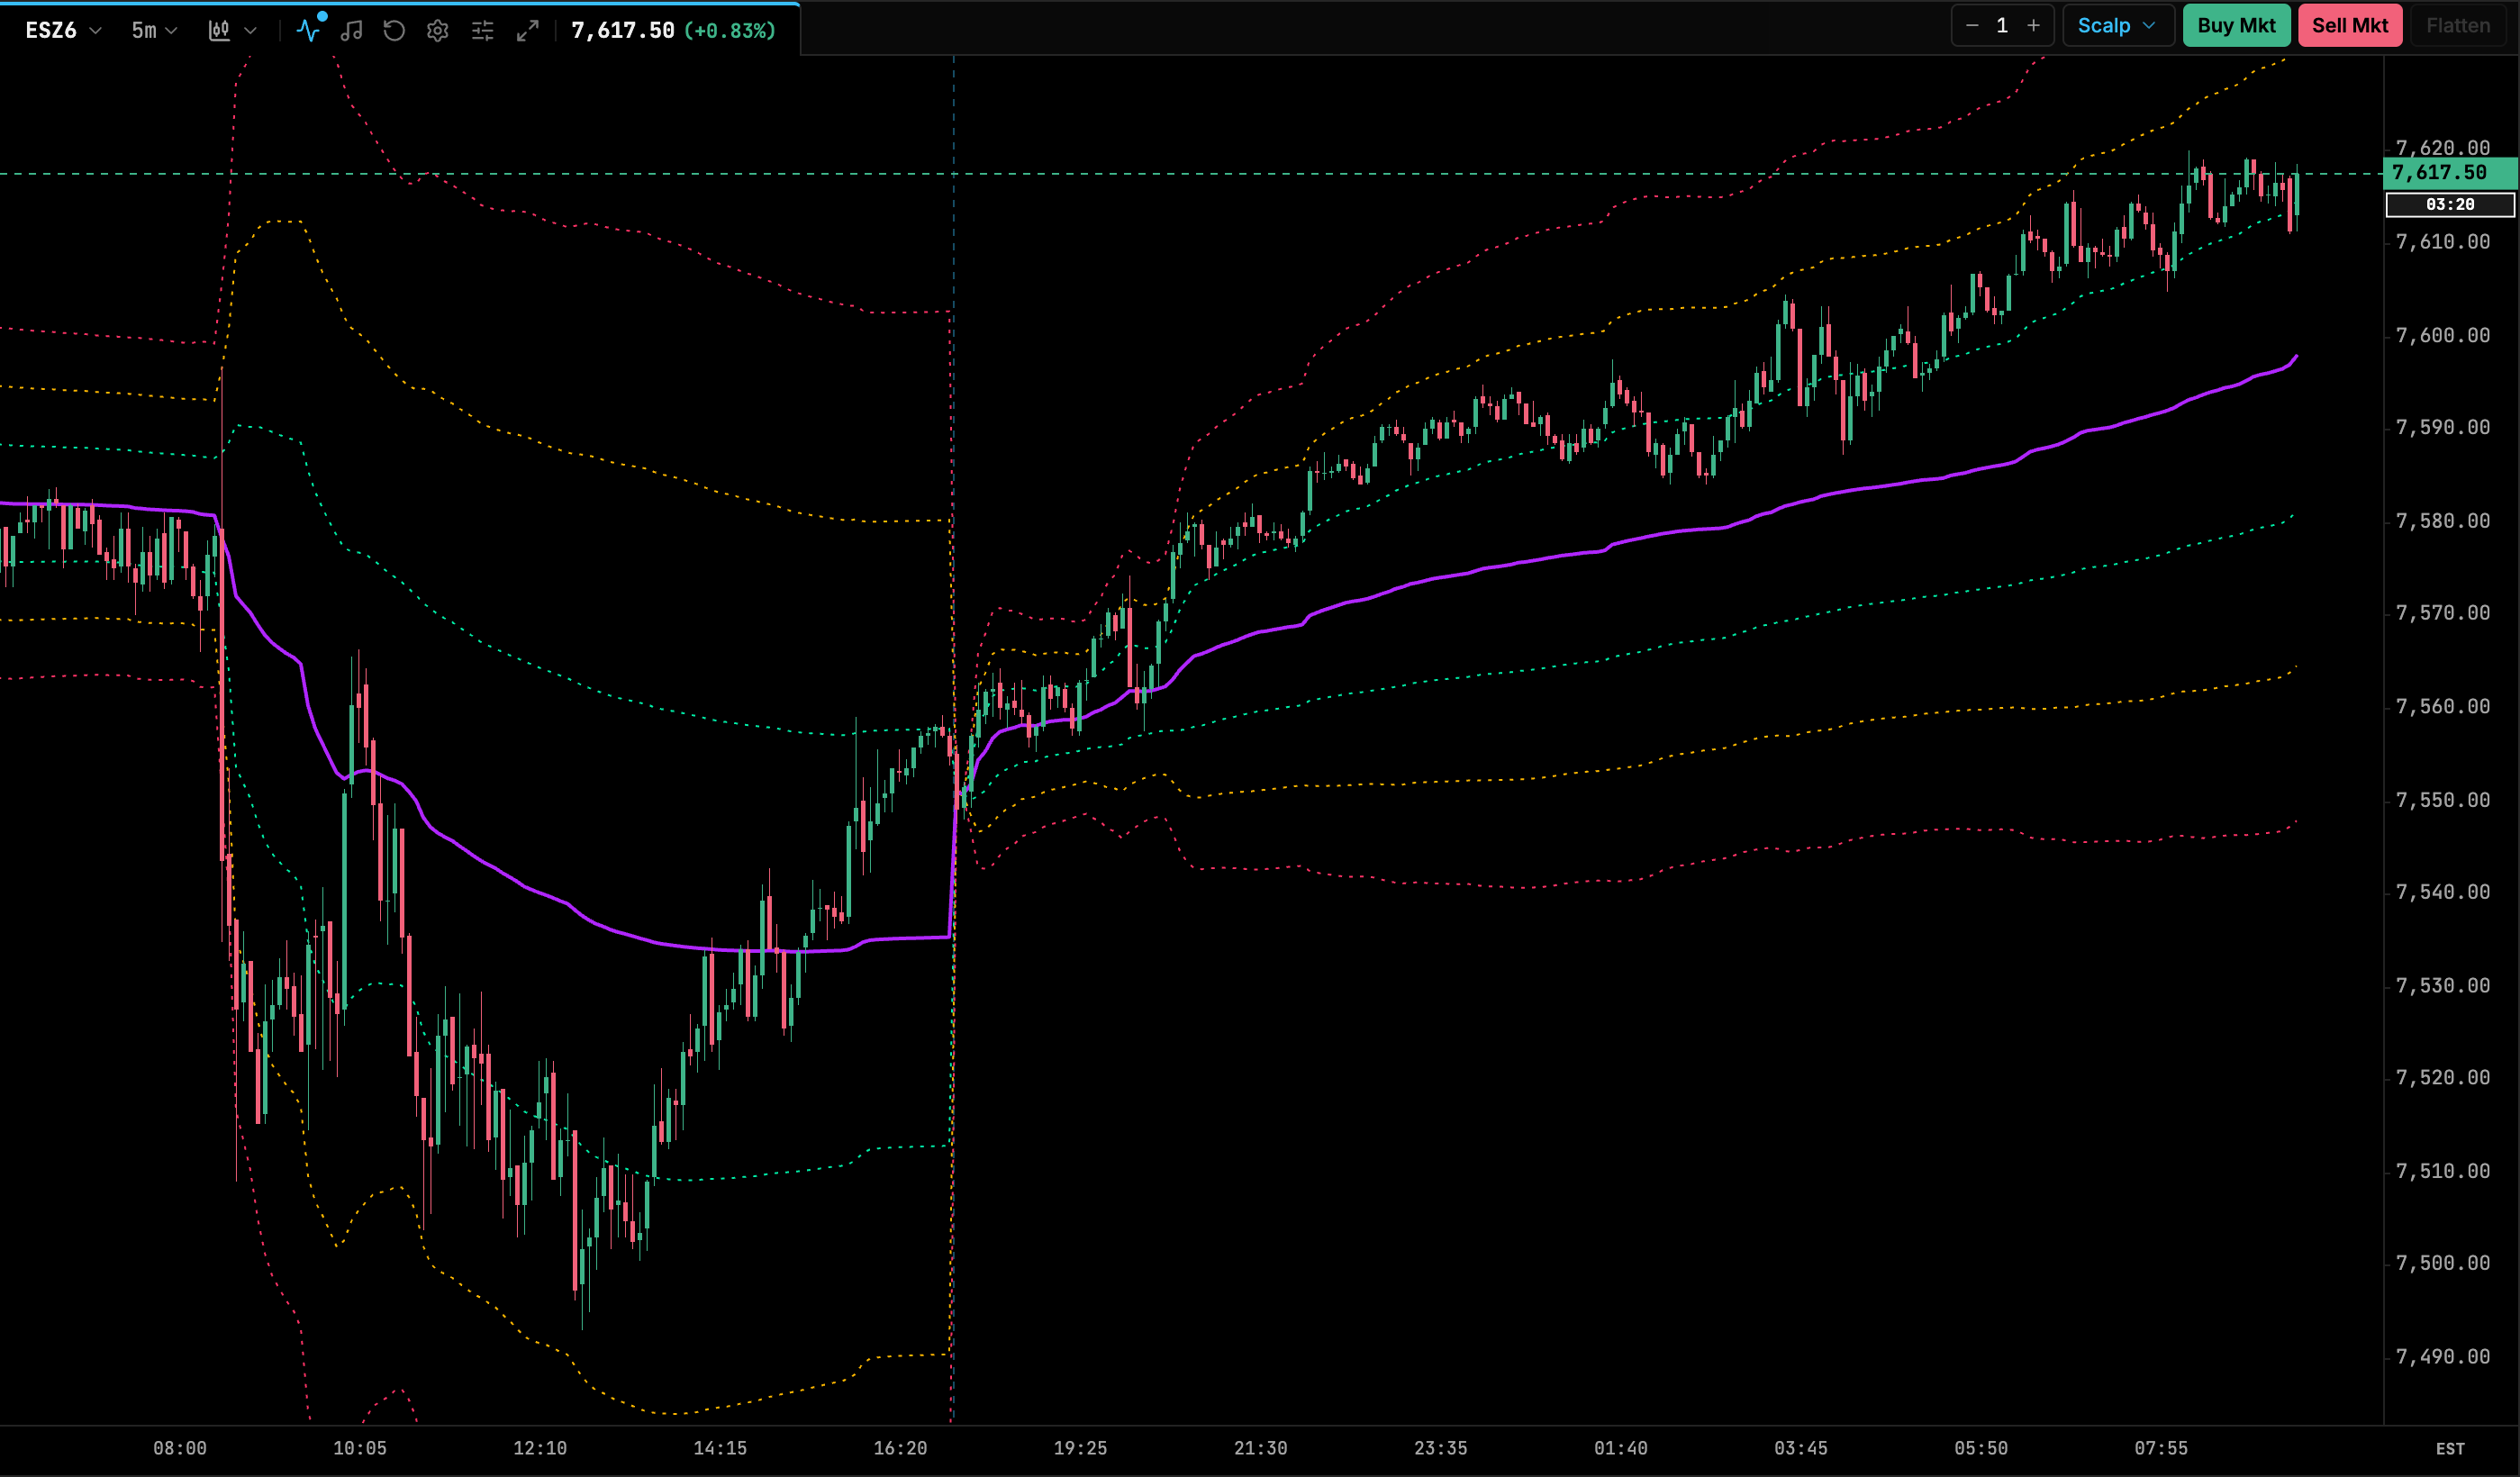
| Setting | Default | Range / options | Notes |
|---|---|---|---|
| VWAP | |||
| VWAP Color | #B026FF |
color | |
| Line Thickness | 2 |
1–5 (step 1) | |
| Show Deviation Bands | On | on / off | Master switch for all three bands. |
| Band 1 | |||
| Show Band 1 | On | on / off | |
| Band 1 Std Dev | 1 |
0.5–5 (step 0.5) | |
| Band 1 Color | #00F0A8 |
color | |
| Band 2 | |||
| Show Band 2 | On | on / off | |
| Band 2 Std Dev | 2 |
0.5–5 (step 0.5) | |
| Band 2 Color | #FFB800 |
color | |
| Band 3 | |||
| Show Band 3 | On | on / off | |
| Band 3 Std Dev | 3 |
0.5–5 (step 0.5) | |
| Band 3 Color | #FF3366 |
color |
Volume
Volume bars in their own sub-pane with an independent scale. A bar is colored up when its close is at or above its open and down otherwise. You can add an optional simple moving average of volume to spot above-average activity.
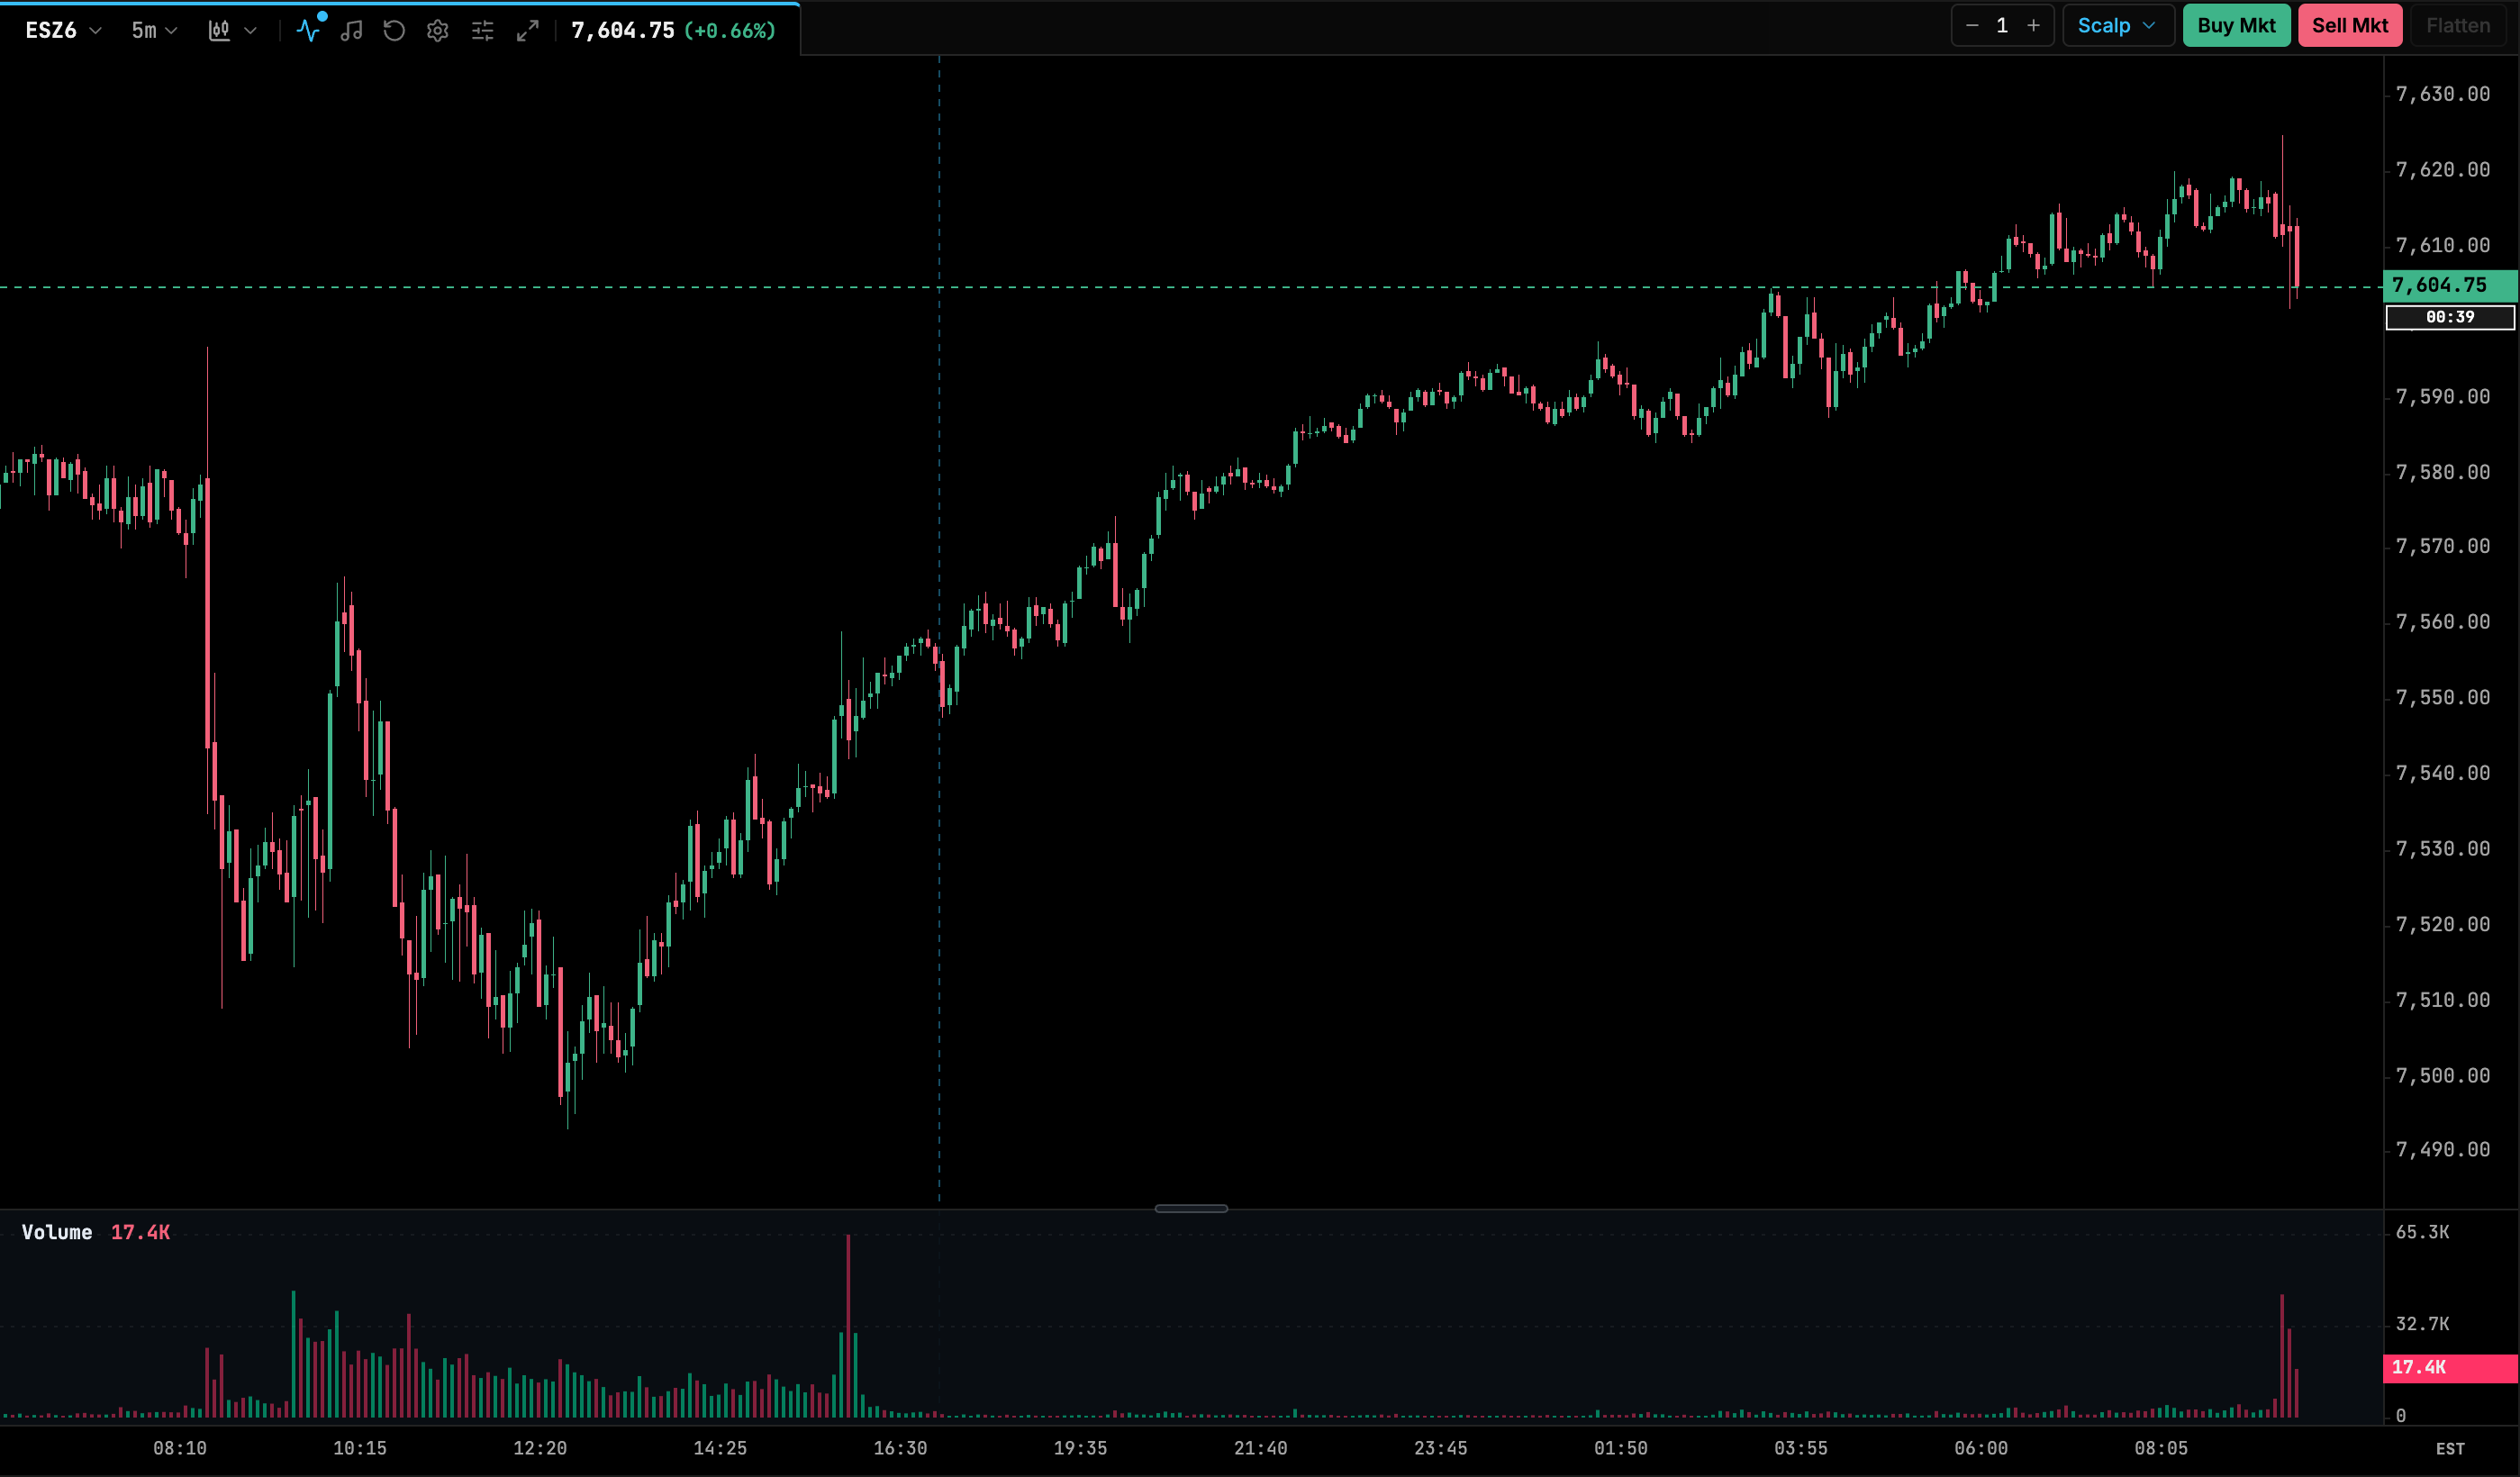
| Setting | Default | Range / options | Notes |
|---|---|---|---|
| Up Bar Color | #00F0A8 |
color | |
| Down Bar Color | #FF3366 |
color | |
| Volume Opacity | 0.5 |
0.05–1 (step 0.05) | |
| Show Volume MA | Off | on / off | |
| Volume MA Length | 20 |
2–100 | Simple average of volume. |
| Volume MA Color | #00E5FF |
color |
On Balance Volume
A running total that adds a bar’s volume when it closes higher than the previous bar and subtracts it when it closes lower. The absolute value matters less than the slope: OBV rising while price is flat suggests accumulation. An optional signal moving average helps show turns.
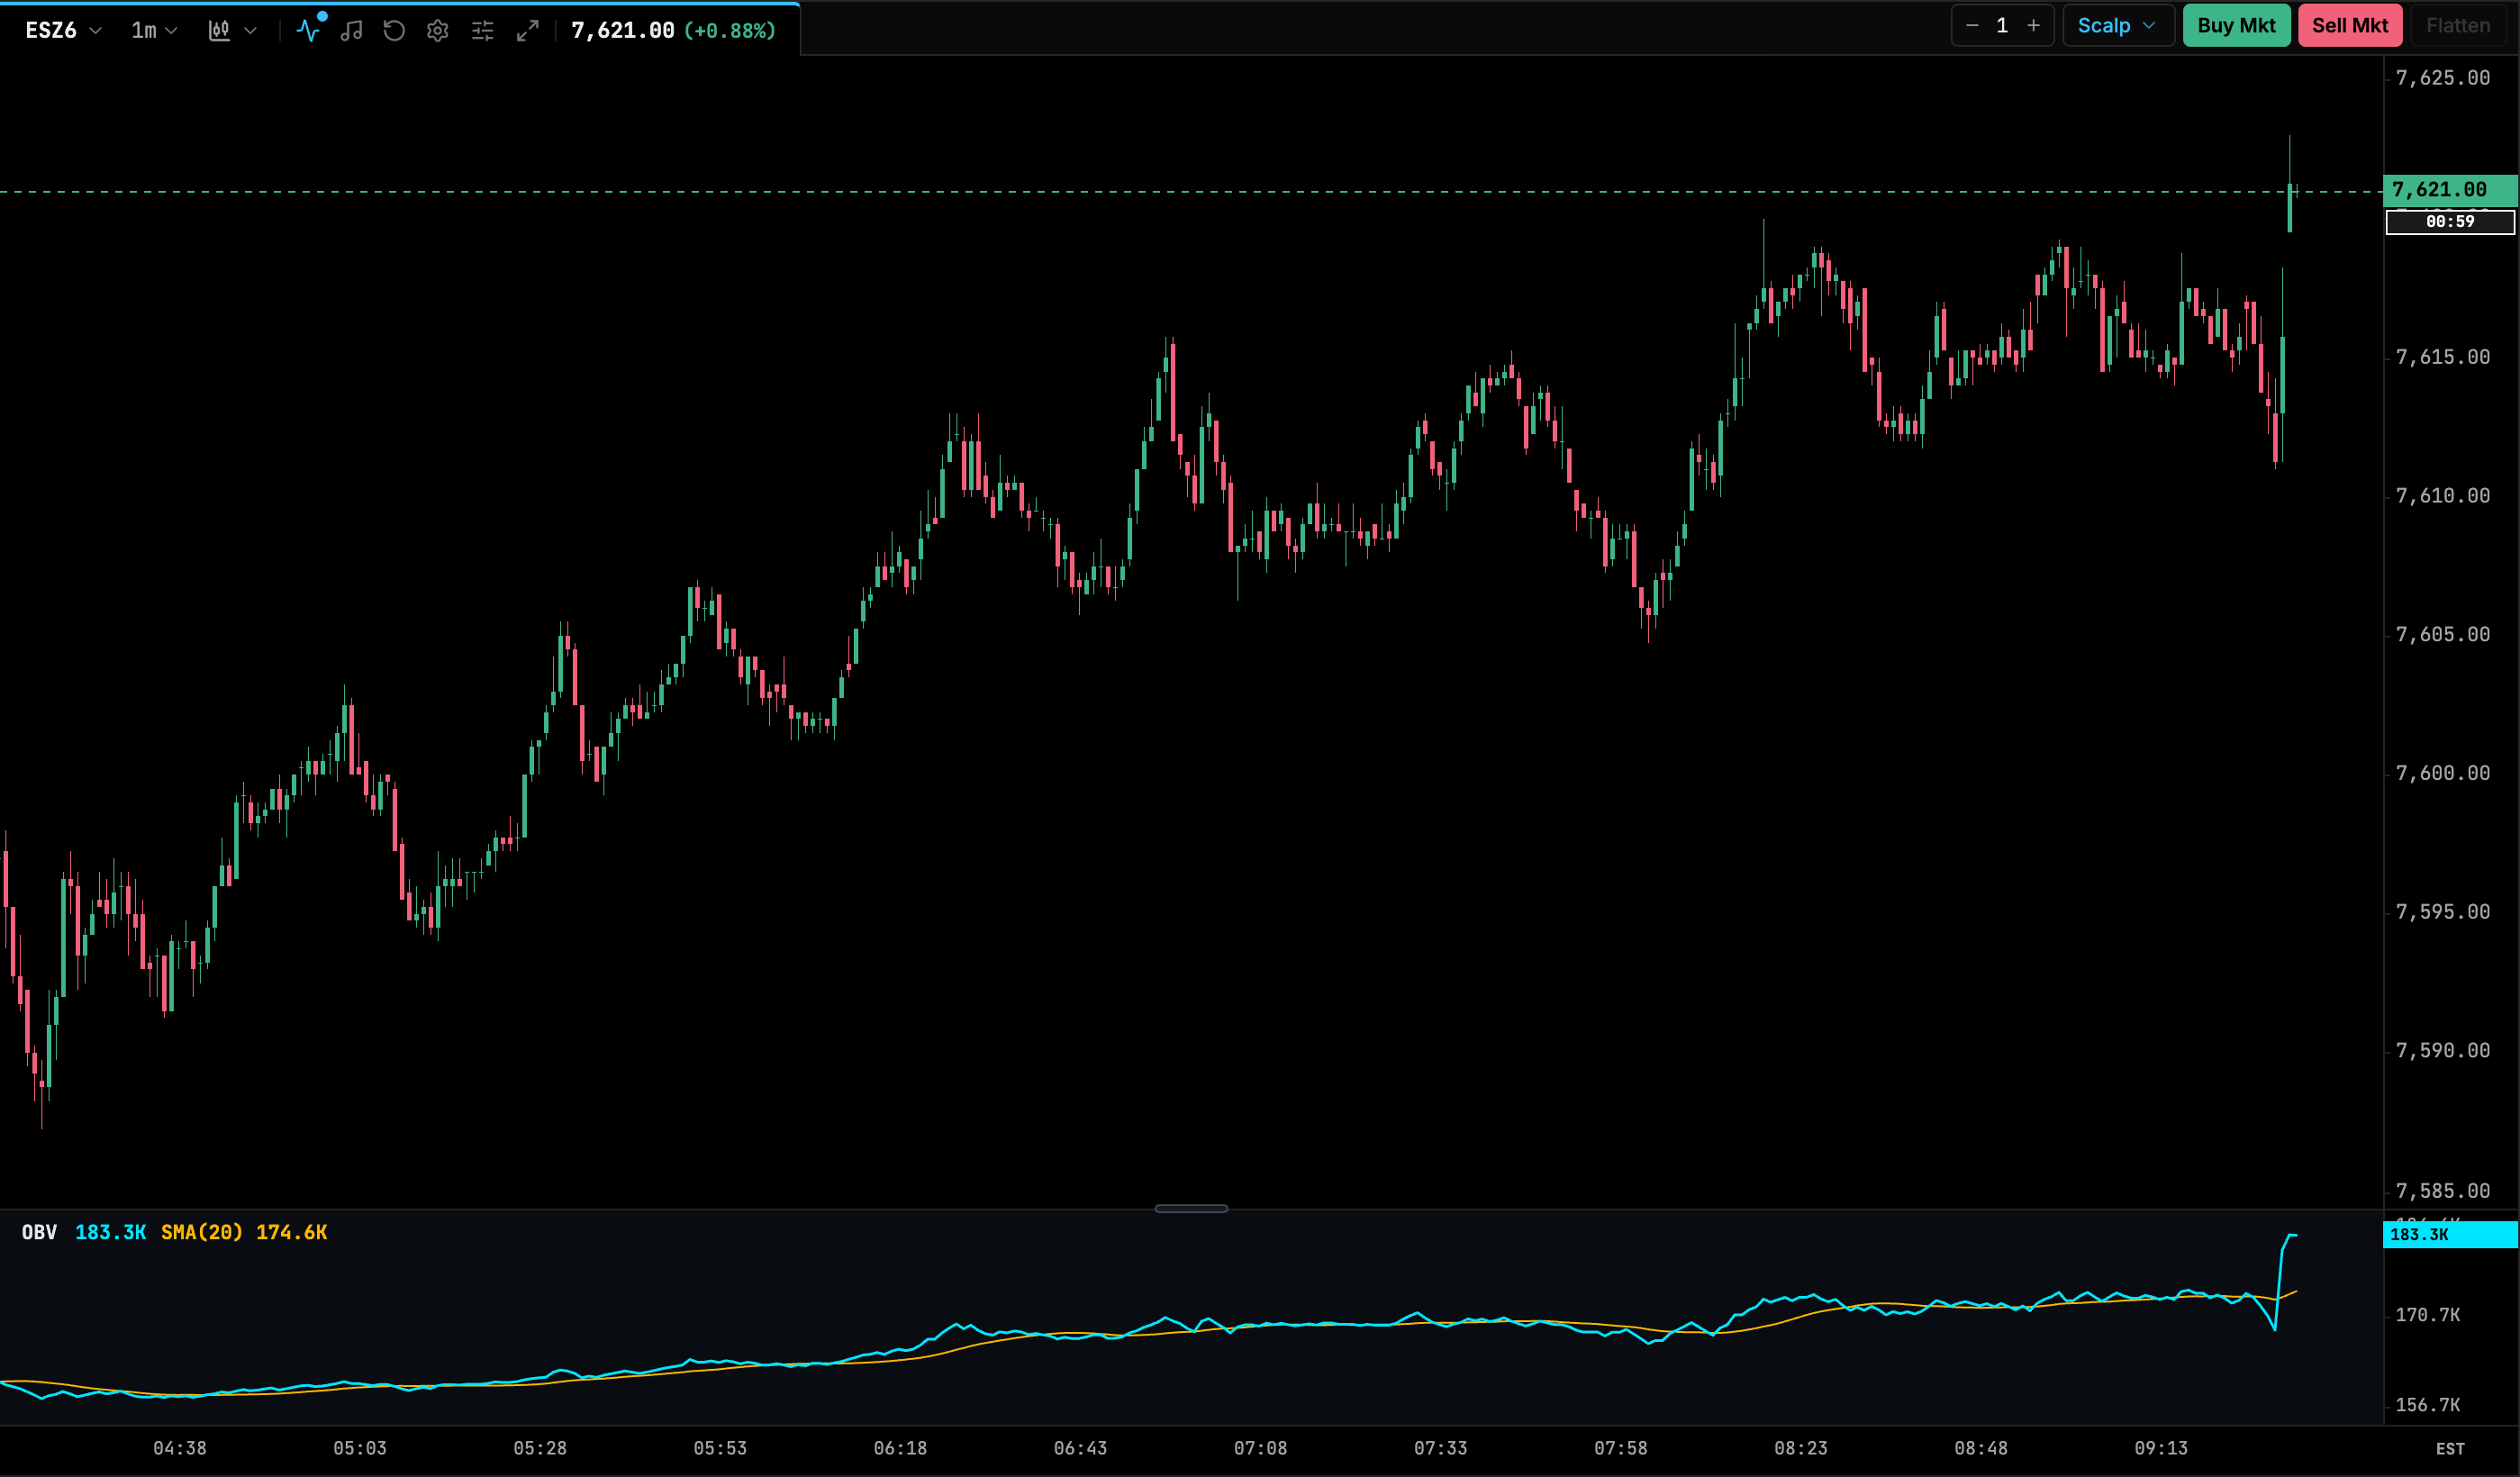
| Setting | Default | Range / options | Notes |
|---|---|---|---|
| Signal MA Length | 20 |
0–200 | 0 disables the signal line. |
| MA Smoothing Type | SMA | SMA, EMA | |
| OBV Line Color | #00E5FF |
color | |
| Signal MA Color | #FFB800 |
color | |
| Line Thickness | 1.5 |
1–4 (step 0.5) | |
| Show Signal MA | On | on / off |
Chaikin Money Flow
Marc Chaikin’s measure of accumulation and distribution. Each bar’s volume is weighted by where the close sits within its range (the money flow multiplier). The sum over the period is then divided by total volume, giving a value between −1 and +1. Readings above zero suggest buying pressure and readings below zero suggest selling pressure. The area above and below the zero line is tinted.
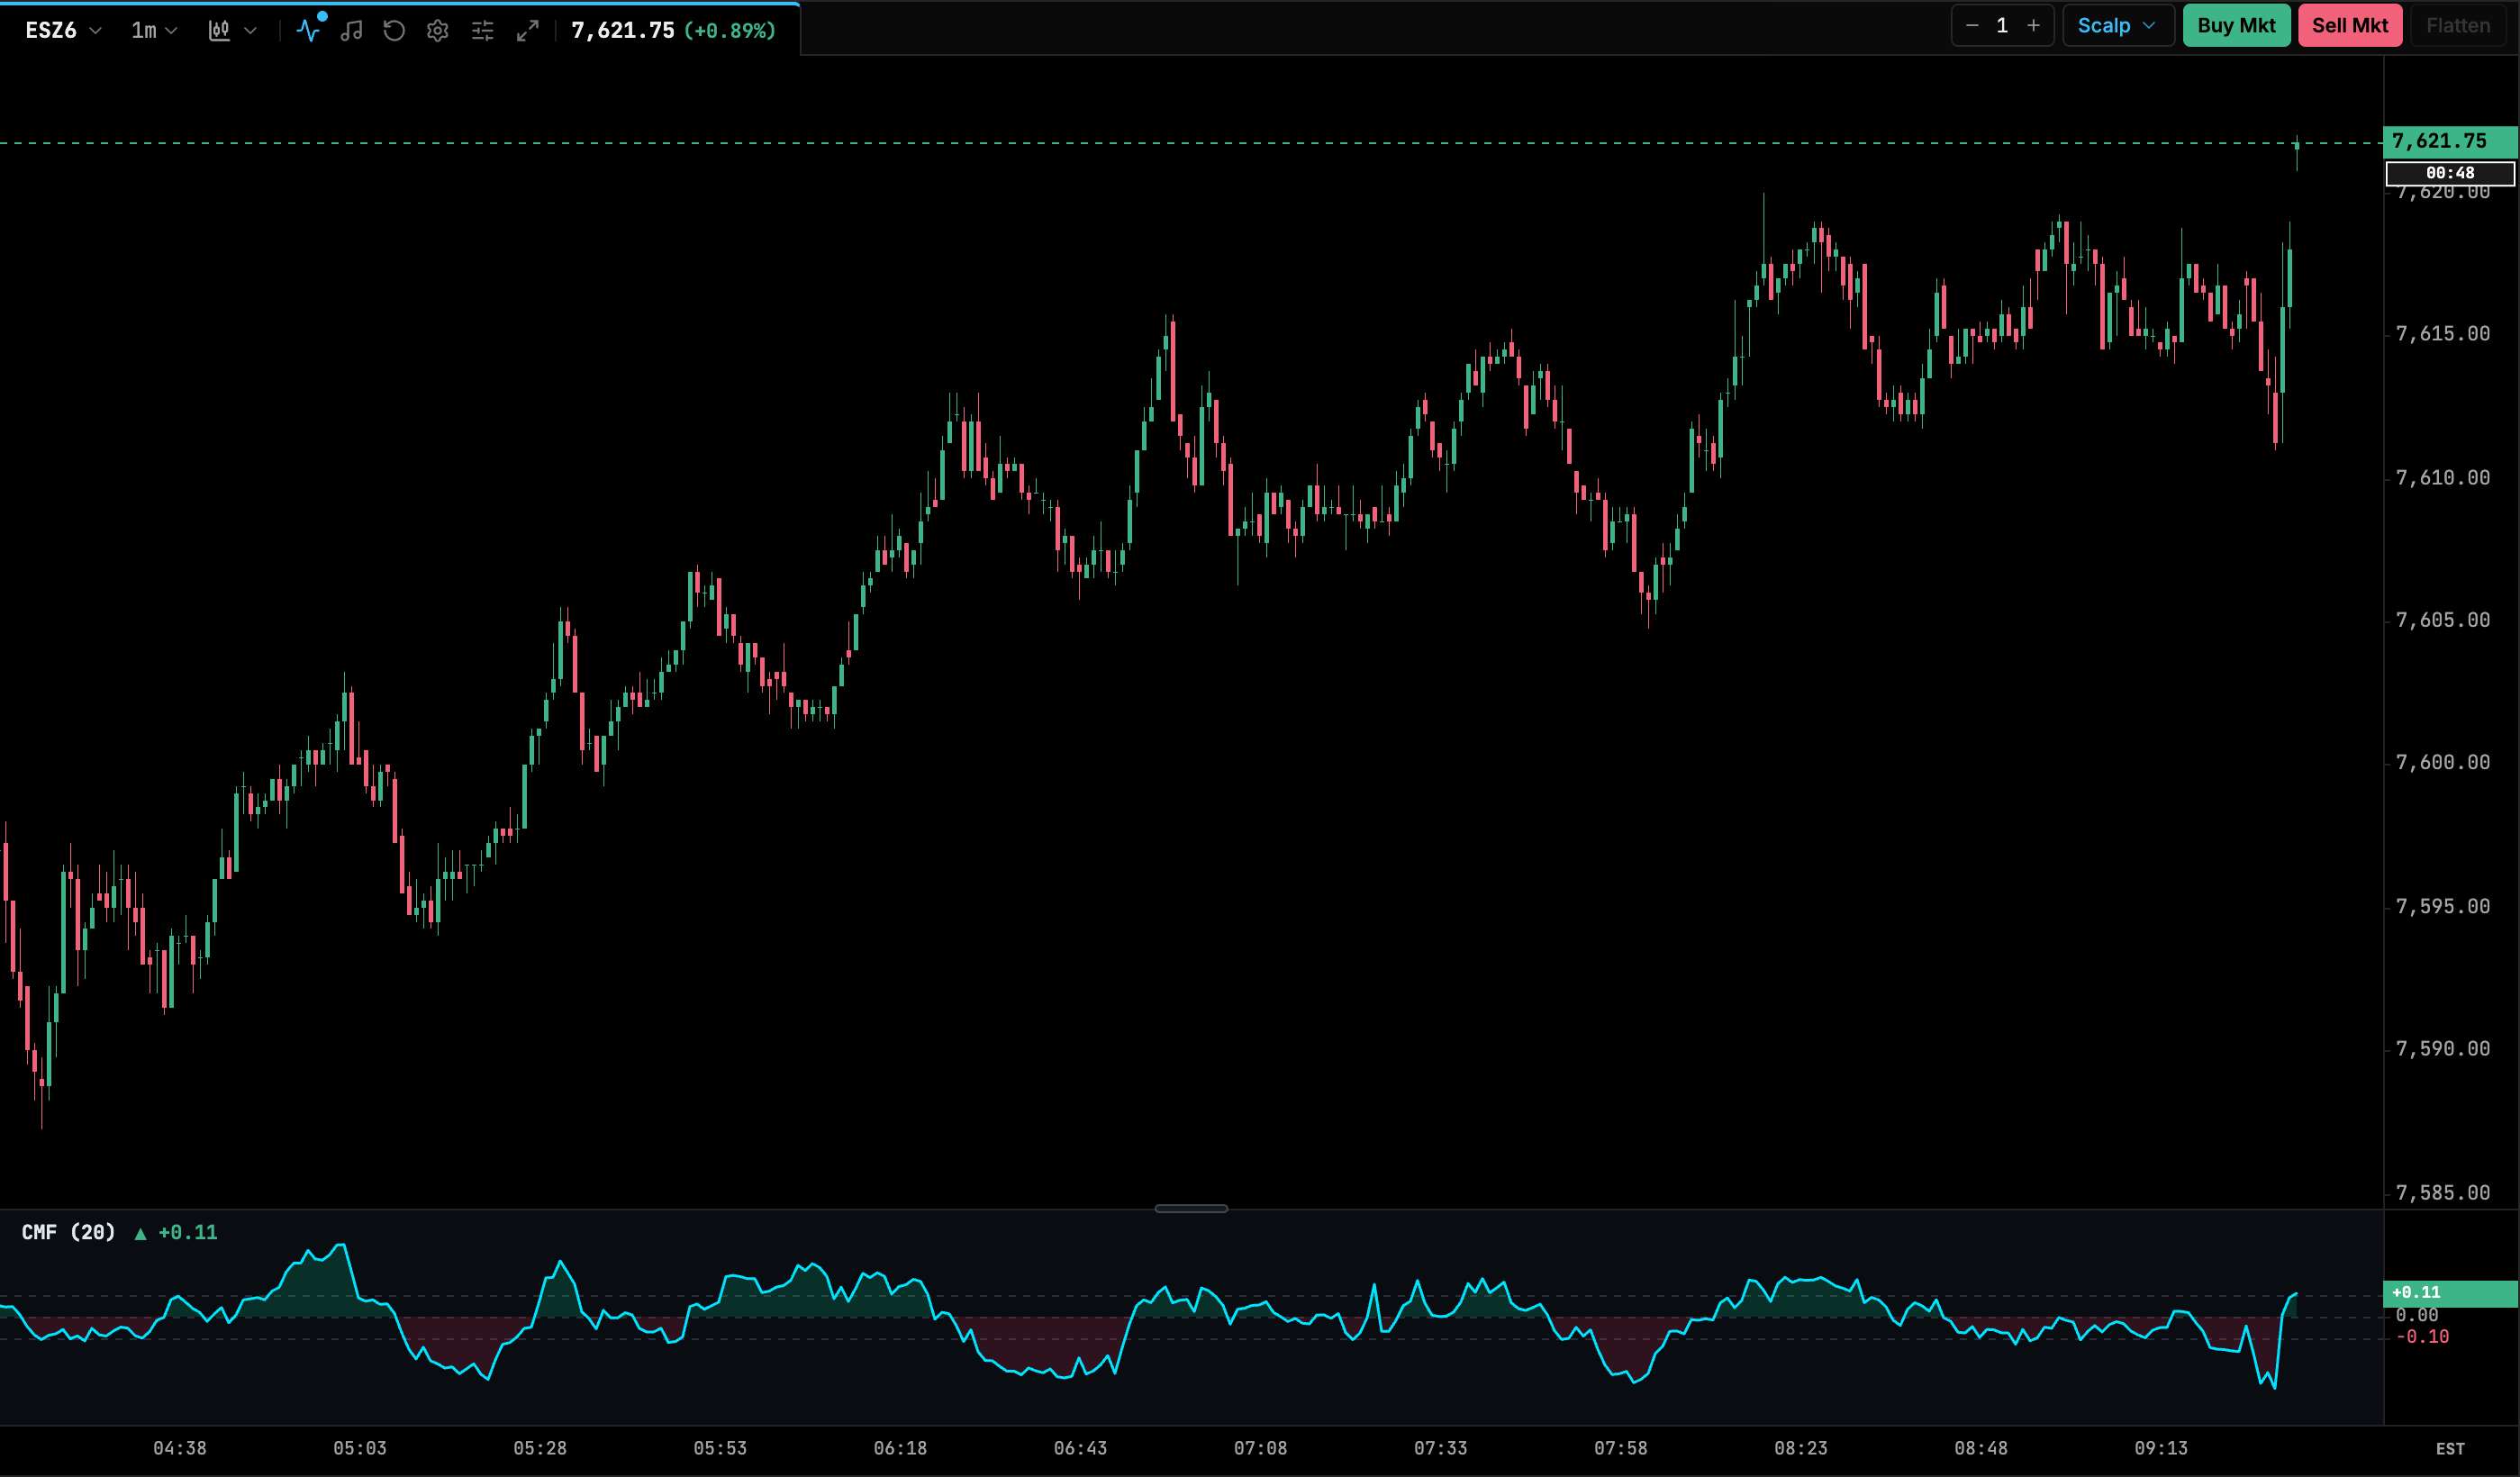
| Setting | Default | Range / options | Notes |
|---|---|---|---|
| Length / Period | 20 |
2–100 | |
| Line Color | #00E5FF |
color | |
| Line Thickness | 1.5 |
1–4 (step 0.5) |
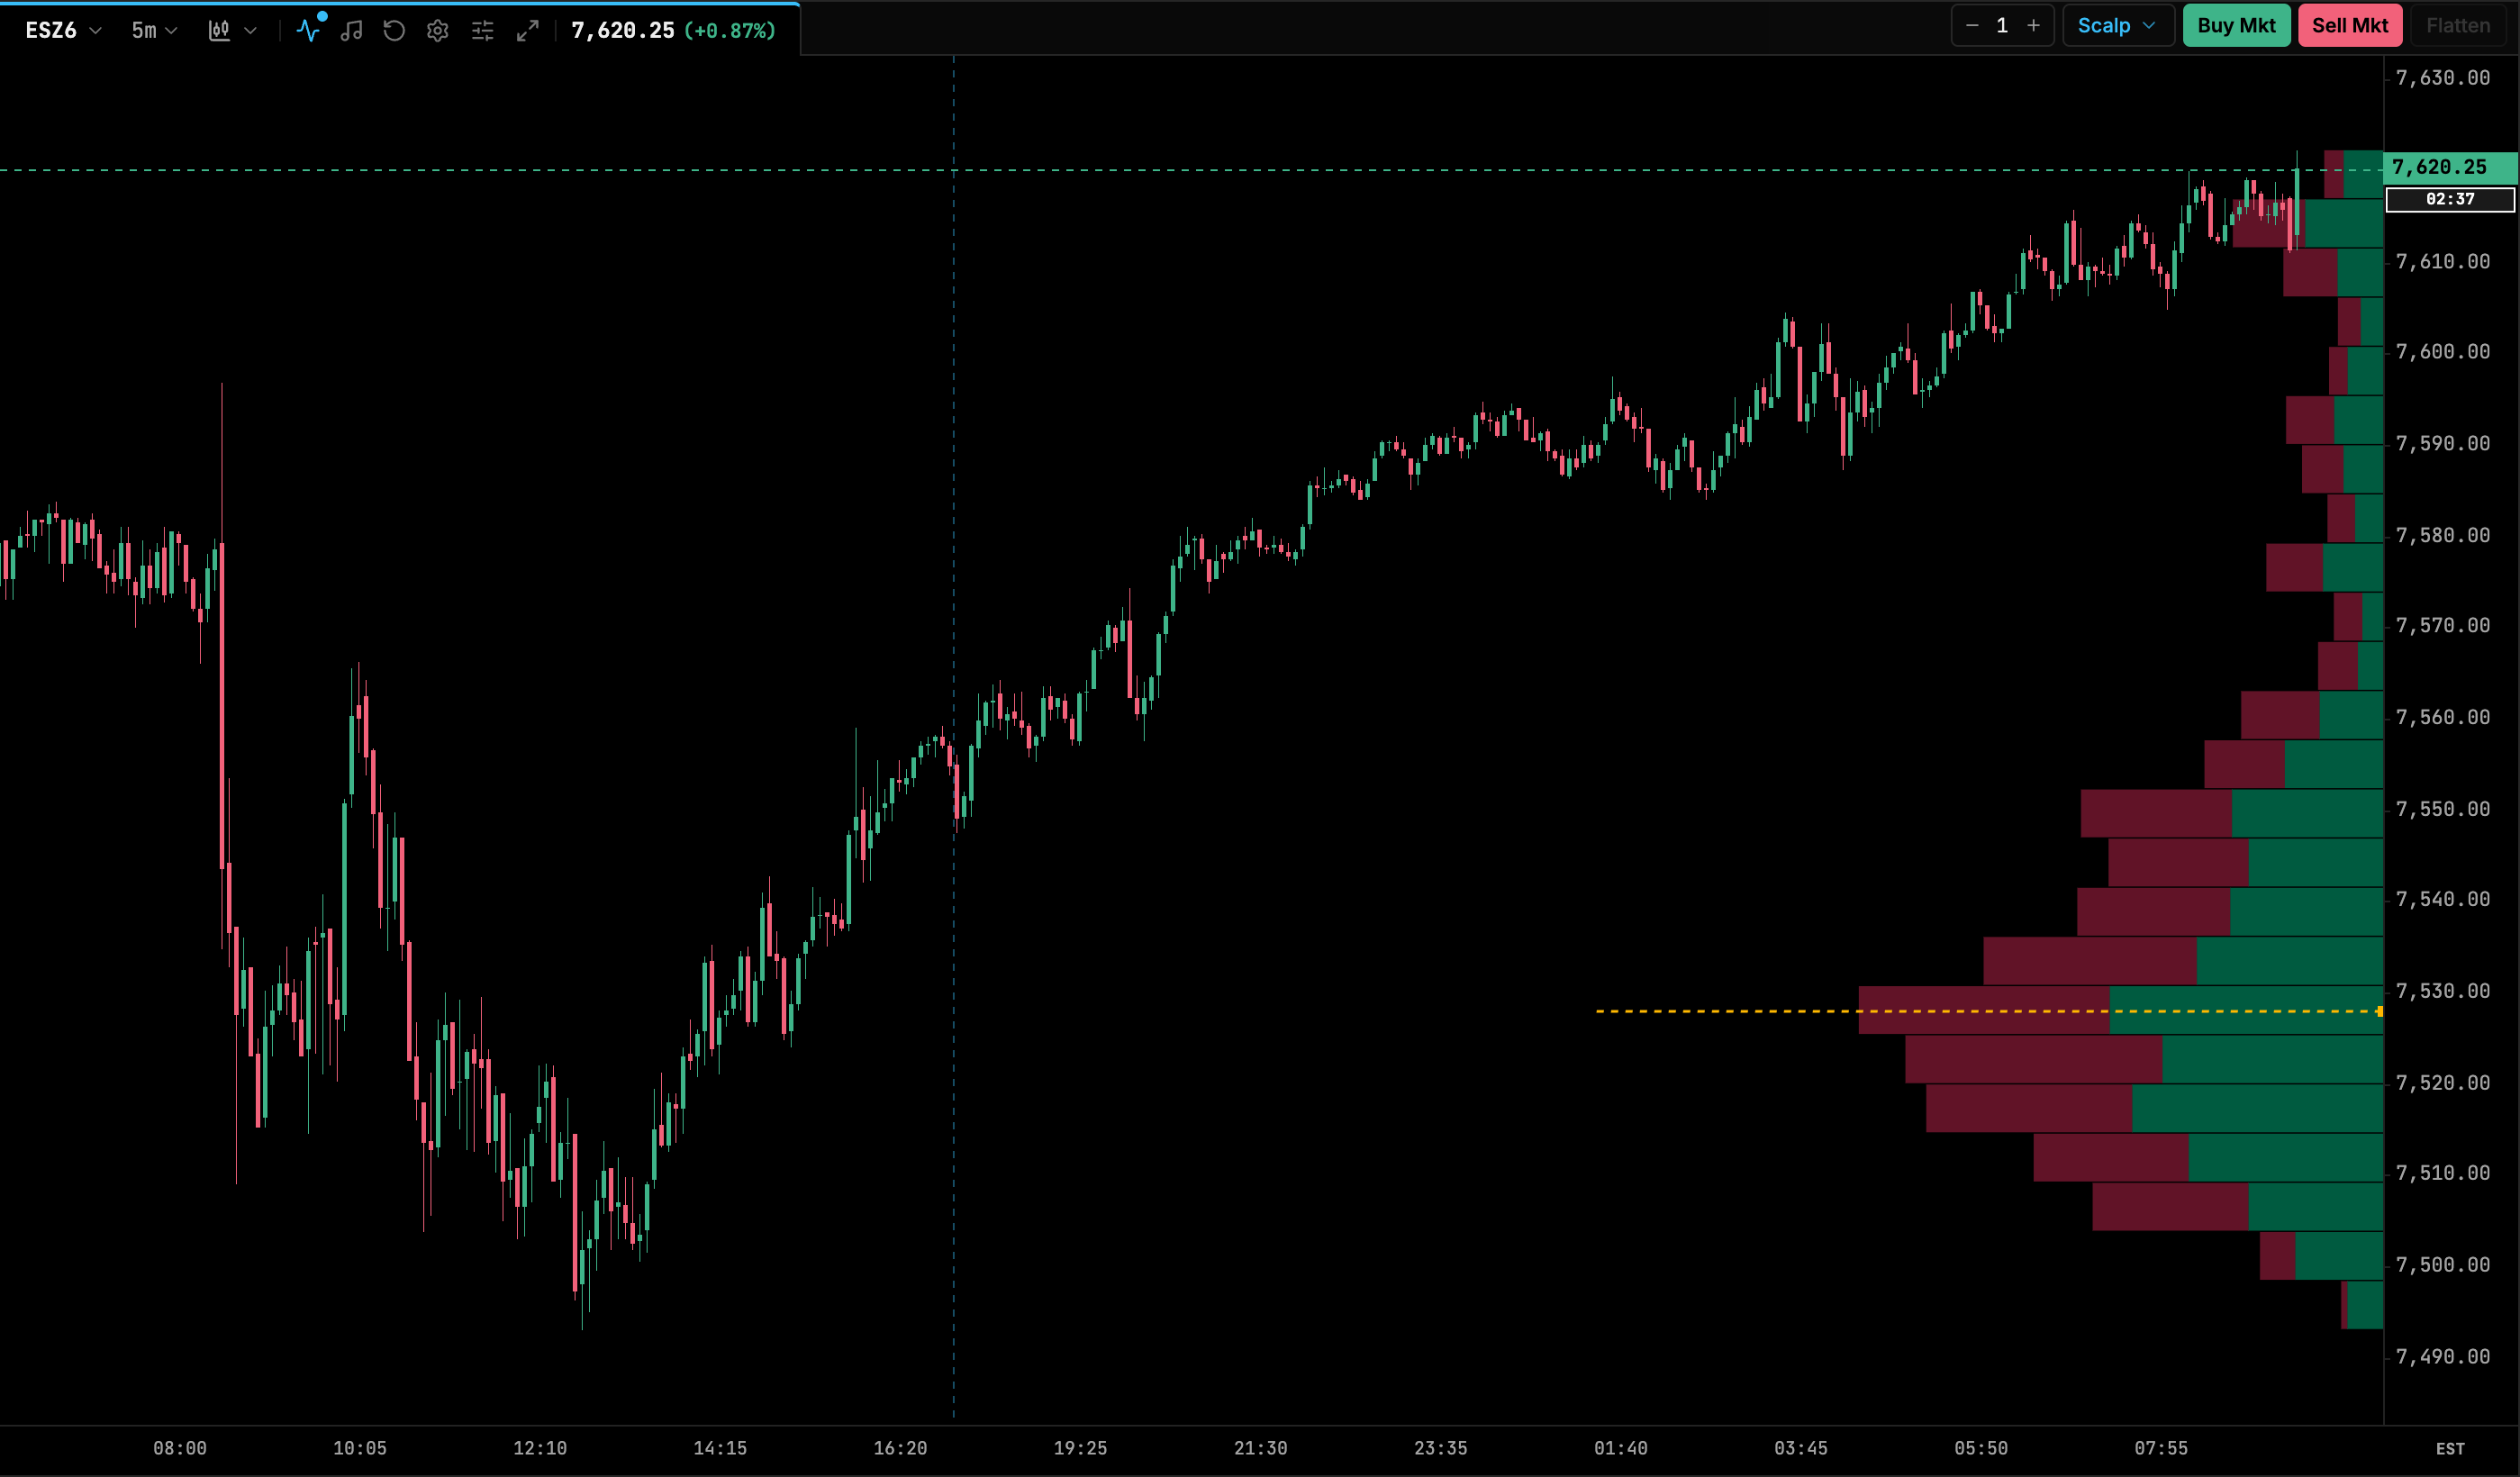
Volume Profile (Visible Range)
A horizontal histogram of volume by price for the bars currently visible on screen. It recalculates as you scroll or zoom. Each bar’s volume is spread across its high–low range and split into bullish and bearish volume by bar direction. The Point of Control (POC), the price with the most volume, is marked with a ray.
| Setting | Default | Range / options | Notes |
|---|---|---|---|
| Price Levels / Rows | 50 |
10–500 (step 5) | Number of price rows in the histogram. |
| Width Ratio of Chart | 0.22 |
0.1–0.5 (step 0.05) | Histogram width as a fraction of the chart. |
| Bullish Volume Color | rgba(0, 240, 168, 0.38) |
color | |
| Bearish Volume Color | rgba(255, 51, 102, 0.38) |
color | |
| Point of Control (POC) Color | #FFB800 |
color | |
| Show Point of Control Ray | On | on / off |
Session Volume Profile
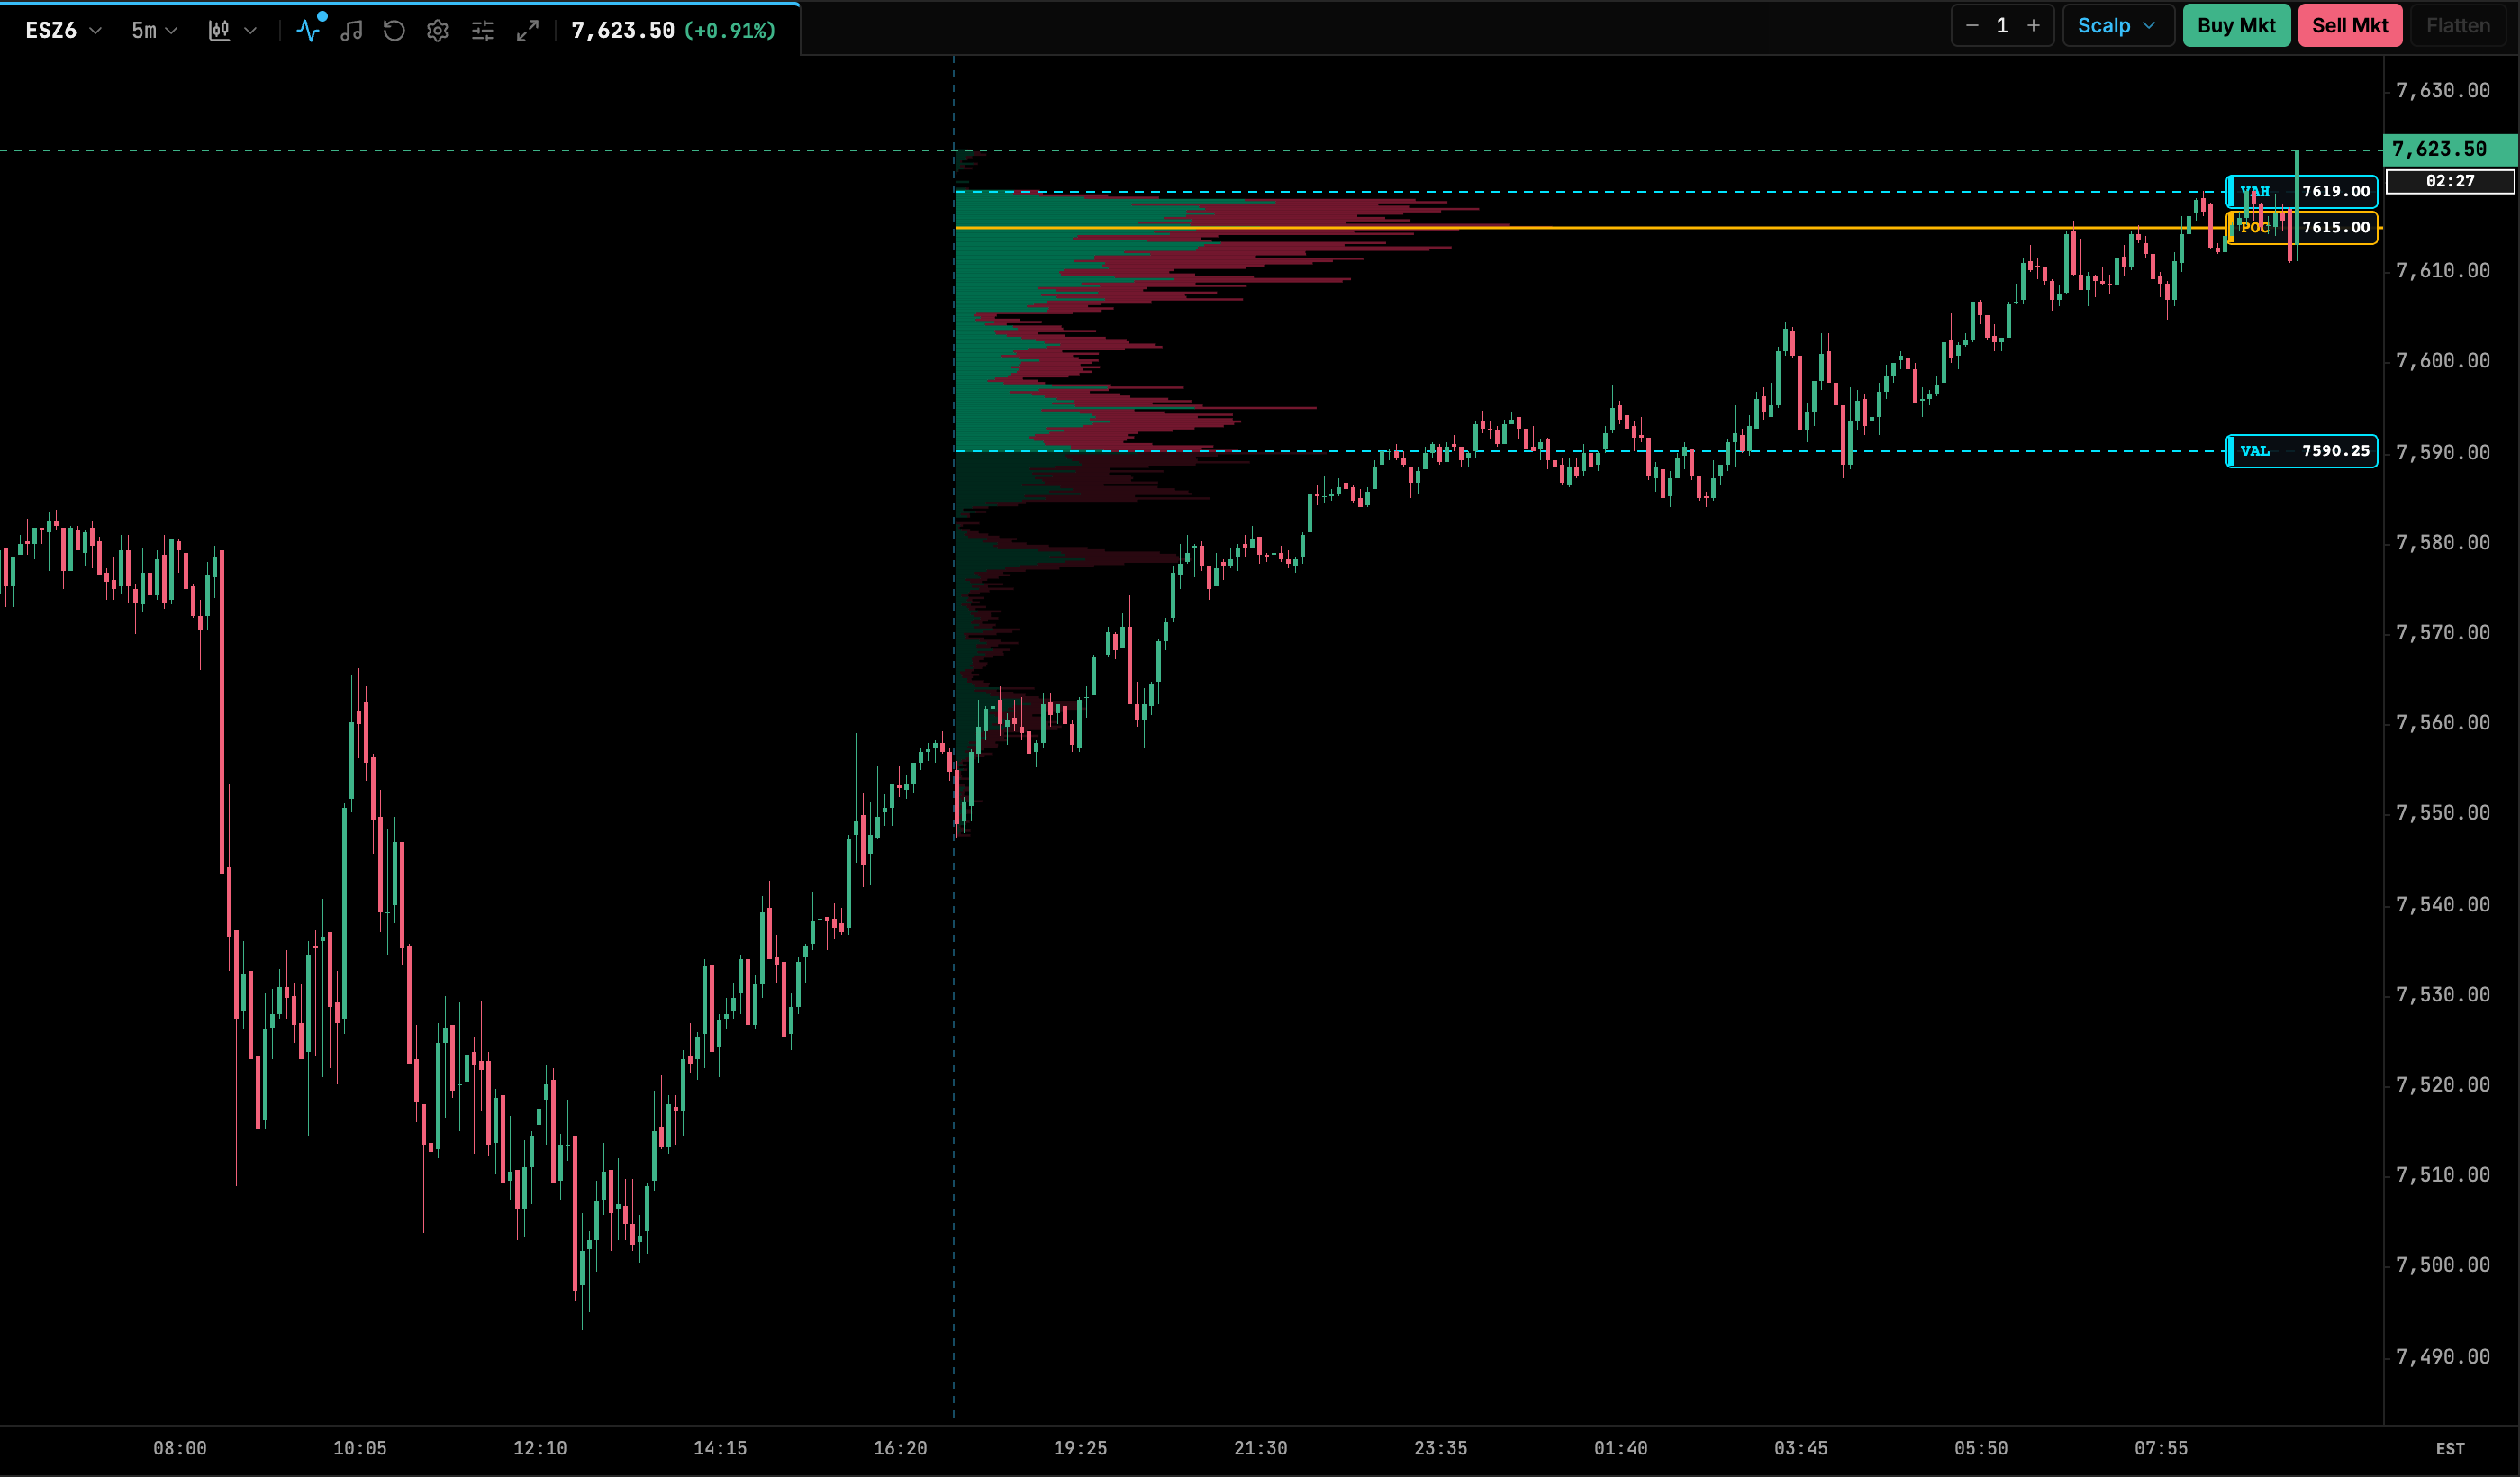
A volume profile for each trading session, with the POC, Value Area High (VAH) and Value Area Low (VAL). The value area is the range around the POC that holds the chosen share of session volume (70% by default). When per-price footprint data is loaded, the profile uses real bid/ask volume at each price. Otherwise it spreads each bar’s volume across its range. You can show prior sessions alongside the current one. For time-at-price profiles, see TPO / Market Profile. For per-price bid/ask detail inside each bar, see Order Flow Footprint.
| Setting | Default | Range / options | Notes |
|---|---|---|---|
| Session | |||
| Session Scope | Full Session (Globex 18:00 ET) | Full Session (Globex 18:00 ET), Regular Trading Hours (RTH 09:30 ET) | Full CME session (ETH + RTH) or RTH only. |
| Volume Mode | Bid/Ask Split (Bull vs Bear) | Bid/Ask Split (Bull vs Bear), Total Volume, Net Delta (Ask − Bid) | In Net Delta mode the histogram shows ask − bid per row. POC and value area are still based on total volume. |
| Show Historical Sessions | Off | on / off | Draws separate profiles for prior sessions. |
| Historical Sessions Count | 5 |
1–20 | |
| Levels | |||
| Value Area (%) | 70 |
50–95 | Share of session volume between VAH and VAL. |
| Layout | |||
| Histogram Placement | Left of Session (Anchor at Open) | Left of Session (Anchor at Open), Right of Session (Right of Chart) | |
| Histogram Width (% of Chart) | 0.25 |
0.1–0.5 (step 0.05) | |
| Highlight Value Area | On | on / off | Dims rows outside the value area. |
| POC (Point of Control) | |||
| Show POC Line | On | on / off | |
| POC Color | #FFB800 |
color | |
| POC Thickness | 1.5 |
1–3 (step 0.5) | |
| POC Style | Solid | Solid, Dashed, Dotted | |
| Value Area High (VAH) | |||
| Show VAH Line | On | on / off | |
| VAH Color | #00E5FF |
color | |
| VAH Thickness | 1 |
1–3 (step 0.5) | |
| VAH Style | Dashed | Dashed, Solid, Dotted | |
| Value Area Low (VAL) | |||
| Show VAL Line | On | on / off | |
| VAL Color | #00E5FF |
color | |
| VAL Thickness | 1 |
1–3 (step 0.5) | |
| VAL Style | Dashed | Dashed, Solid, Dotted | |
| Colors | |||
| Bullish (Ask/Buy) Color | #00F0A8 |
color | Used in Bid/Ask Split mode and for positive delta. |
| Bearish (Bid/Sell) Color | #FF3366 |
color | |
| Total Volume Color | #00E5FF |
color | Used in Total Volume mode. |
| Display | |||
| Extend Lines to Right Axis | On | on / off | |
| Show Price Badges | On | on / off | POC, VAH and VAL price labels. |