Order Flow & Delta
These indicators read the trade tape: who hit the bid, who lifted the offer, and how much traded at each price. To add one, open Indicators in the chart panel header, search by name, then click it. The workflow is described in Indicators overview.
New to this concept? ReadOrder Flow Trading: A Practical Guide.
Data requirements
- Ticks (bid/ask). Delta is computed from live trades classified as buyer or seller aggressor, and TickMint stores that data on every bar it builds from the live feed. Historical bars loaded from the server may not have per-trade detail. In that case CVD, Delta Volume, Delta Divergence and Absorption estimate delta from the bar itself:
((close − open) / (high − low)) × volume. Treat delta on old bars as an approximation and delta on bars built live as exact. - Min Trade Size filters (CVD, Delta Volume) only work on bars built live, because they need each bar’s trade-size histogram. Historical bars always use unfiltered delta.
- Big Trades and Market Speed are built only from live prints received while the chart is open. History is not backfilled, because the server’s history comes in 1-second aggregates, not individual trades.
- Iceberg needs order-book data and is not drawn during Market Replay. While replay is active, the Indicators modal marks it No depth in Replay.
Cumulative Volume Delta
A running total of buy-aggressor volume minus sell-aggressor volume, drawn as delta candles (open/high/low/close of the running total for each bar), a line, or an area. By default it resets at the start of each CME session. Look for agreement with price (new highs on rising CVD) or for divergence (price makes a new high and CVD doesn’t), which Delta Divergence marks automatically.
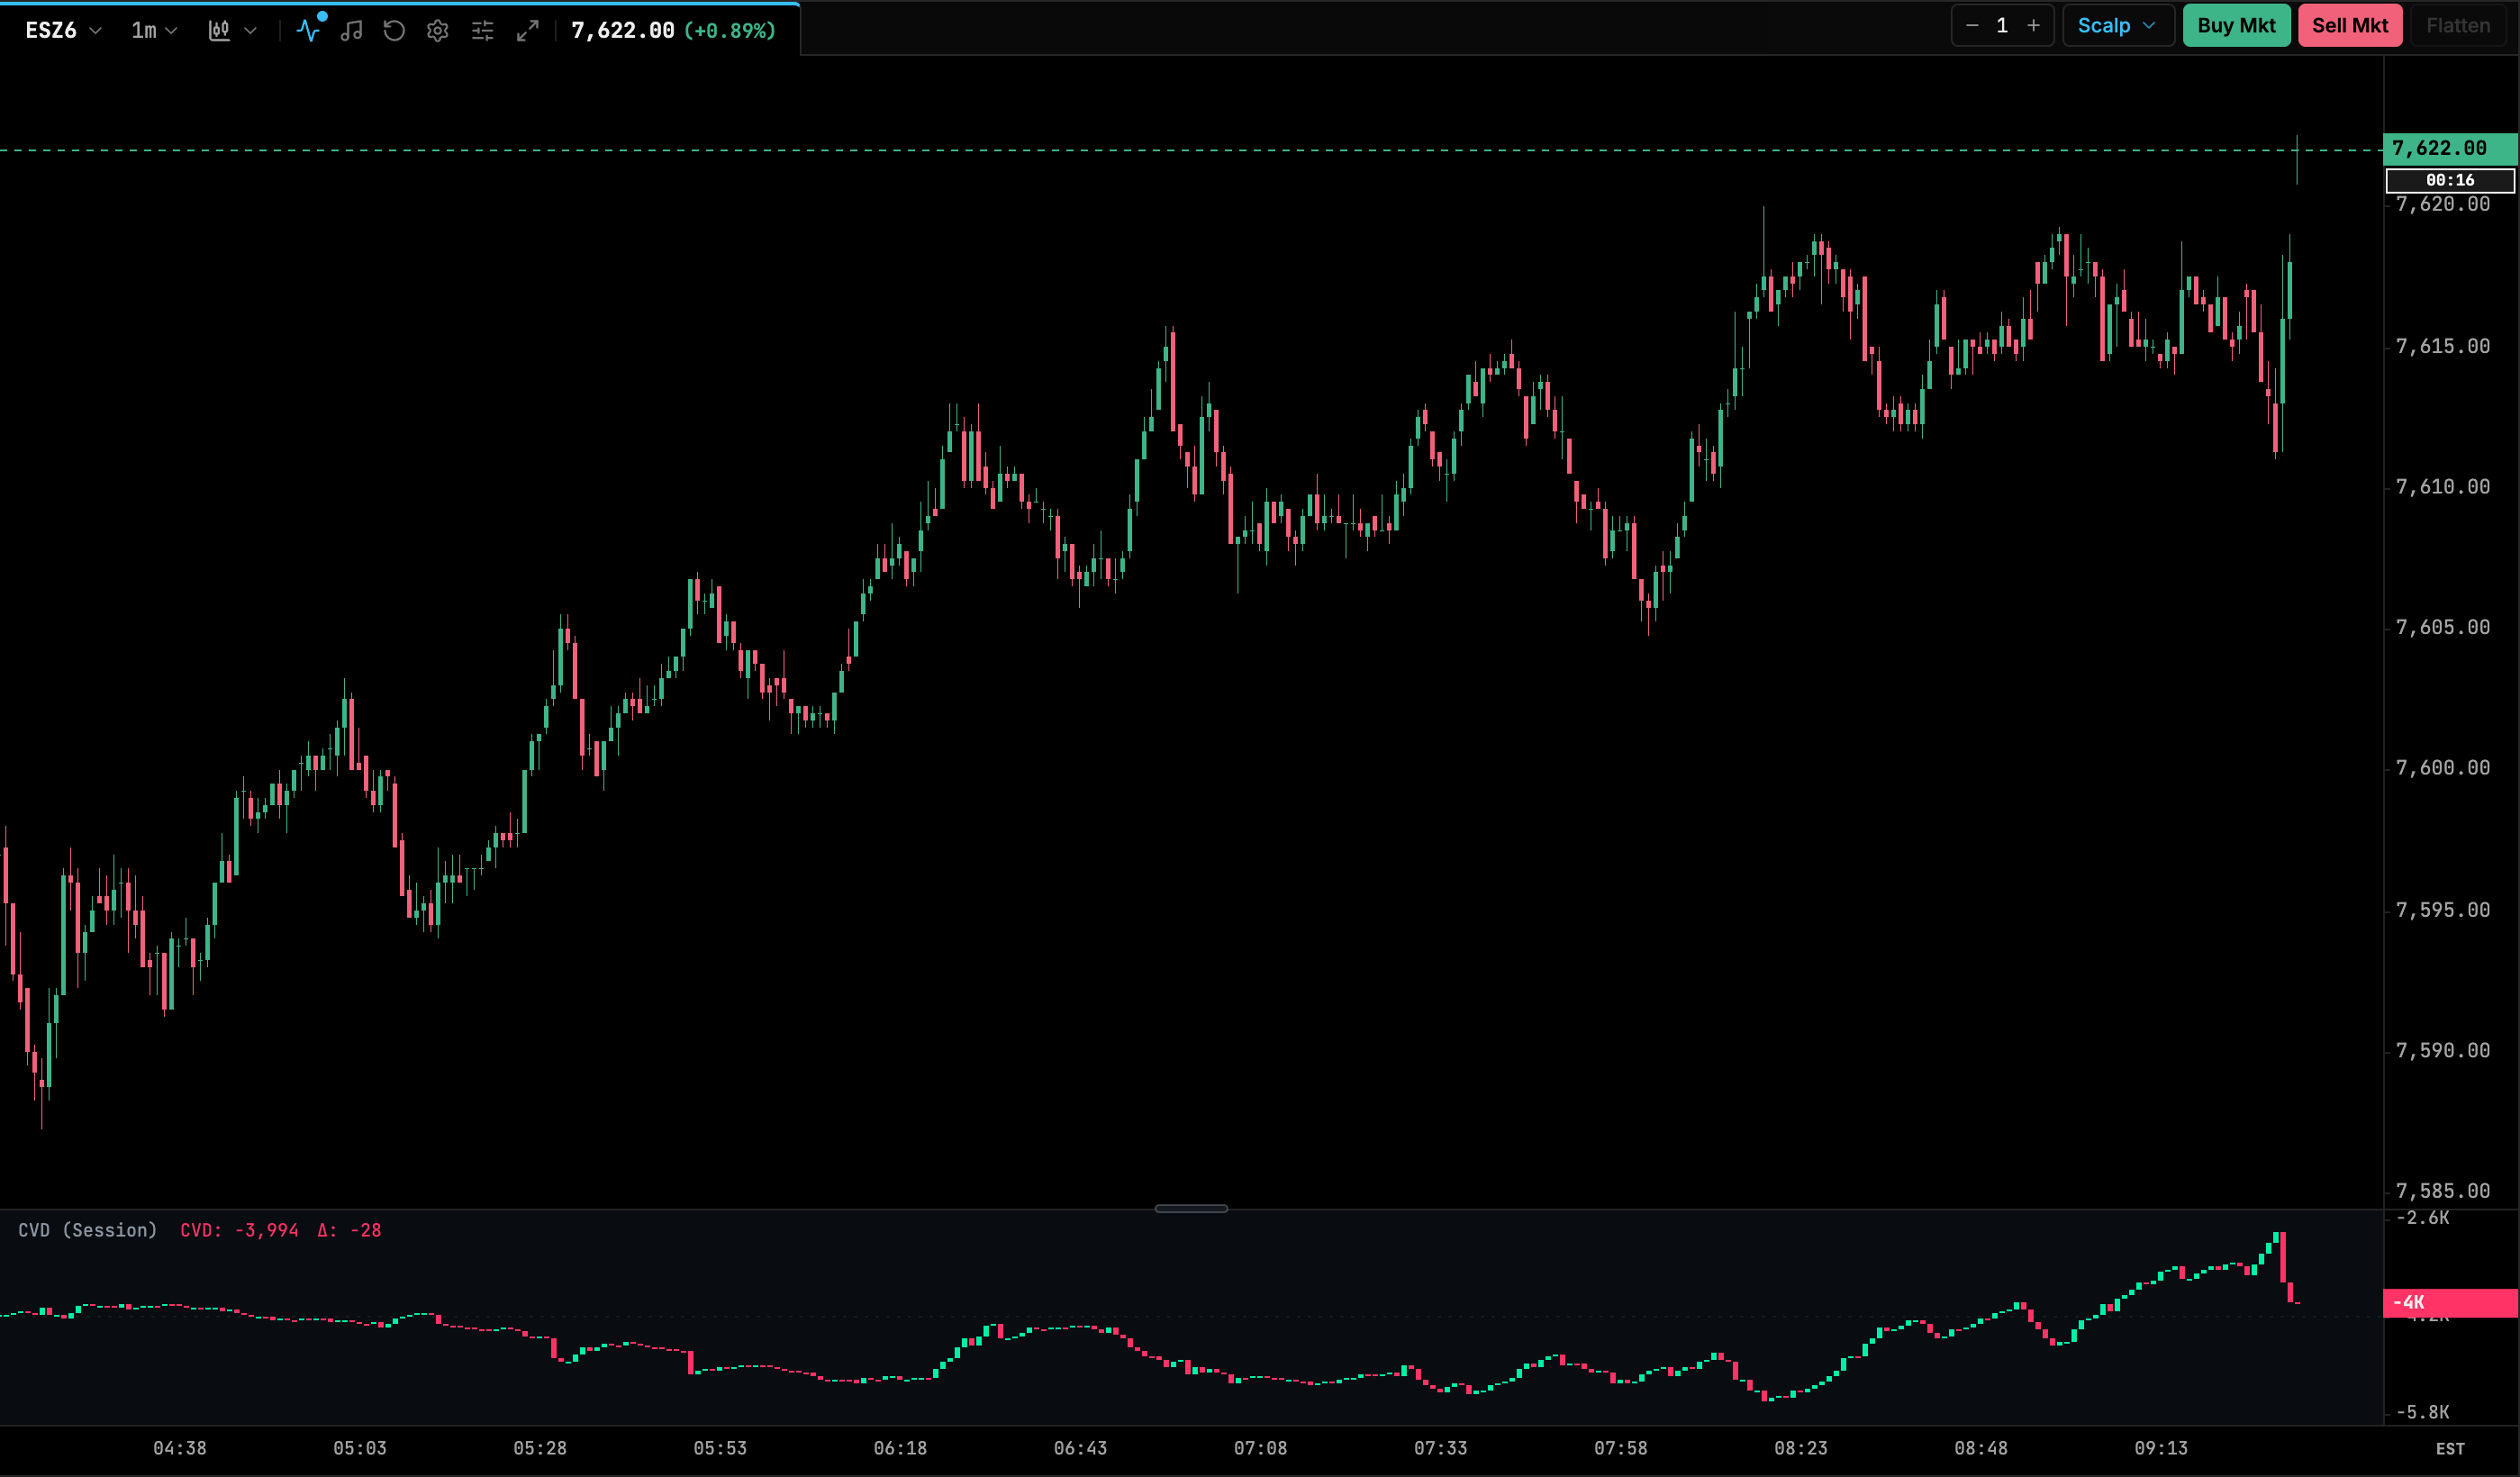
| Setting | Default | Range / options | Notes |
|---|---|---|---|
| Session Reset | Daily / Session | Daily / Session, None (Continuous) | None never resets. |
| Min Trade Size (Filtered Delta) | 1 (all trades) | 1, 2, 3, 5, 10, 20, 50, 100 | Counts only trades at or above this size. Applies to bars built live. |
| Visualization Style | Candlesticks | Candlesticks, Line, Area | |
| Bullish / Bearish Delta Color | theme bull / bear | color | Candle colors. |
| Line / Area Color | theme cyan | color | Line and area styles. |
| Line Thickness | 1.5 | ||
| Show Zero Line | off | on/off | |
| Show Moving Average | off | on/off | |
| MA Period | 14 | 2–100 | |
| MA Type | EMA | EMA, SMA | |
| MA Line Color | theme amber | color |
Delta Volume
A histogram of each bar’s net delta, with bars above zero for net buying and below zero for net selling. Two extras are available: a total-volume box drawn behind each delta bar, and delta numbers printed on the price chart under each candle. Older layouts and templates that used the ids bar_delta or bar-delta load this indicator.
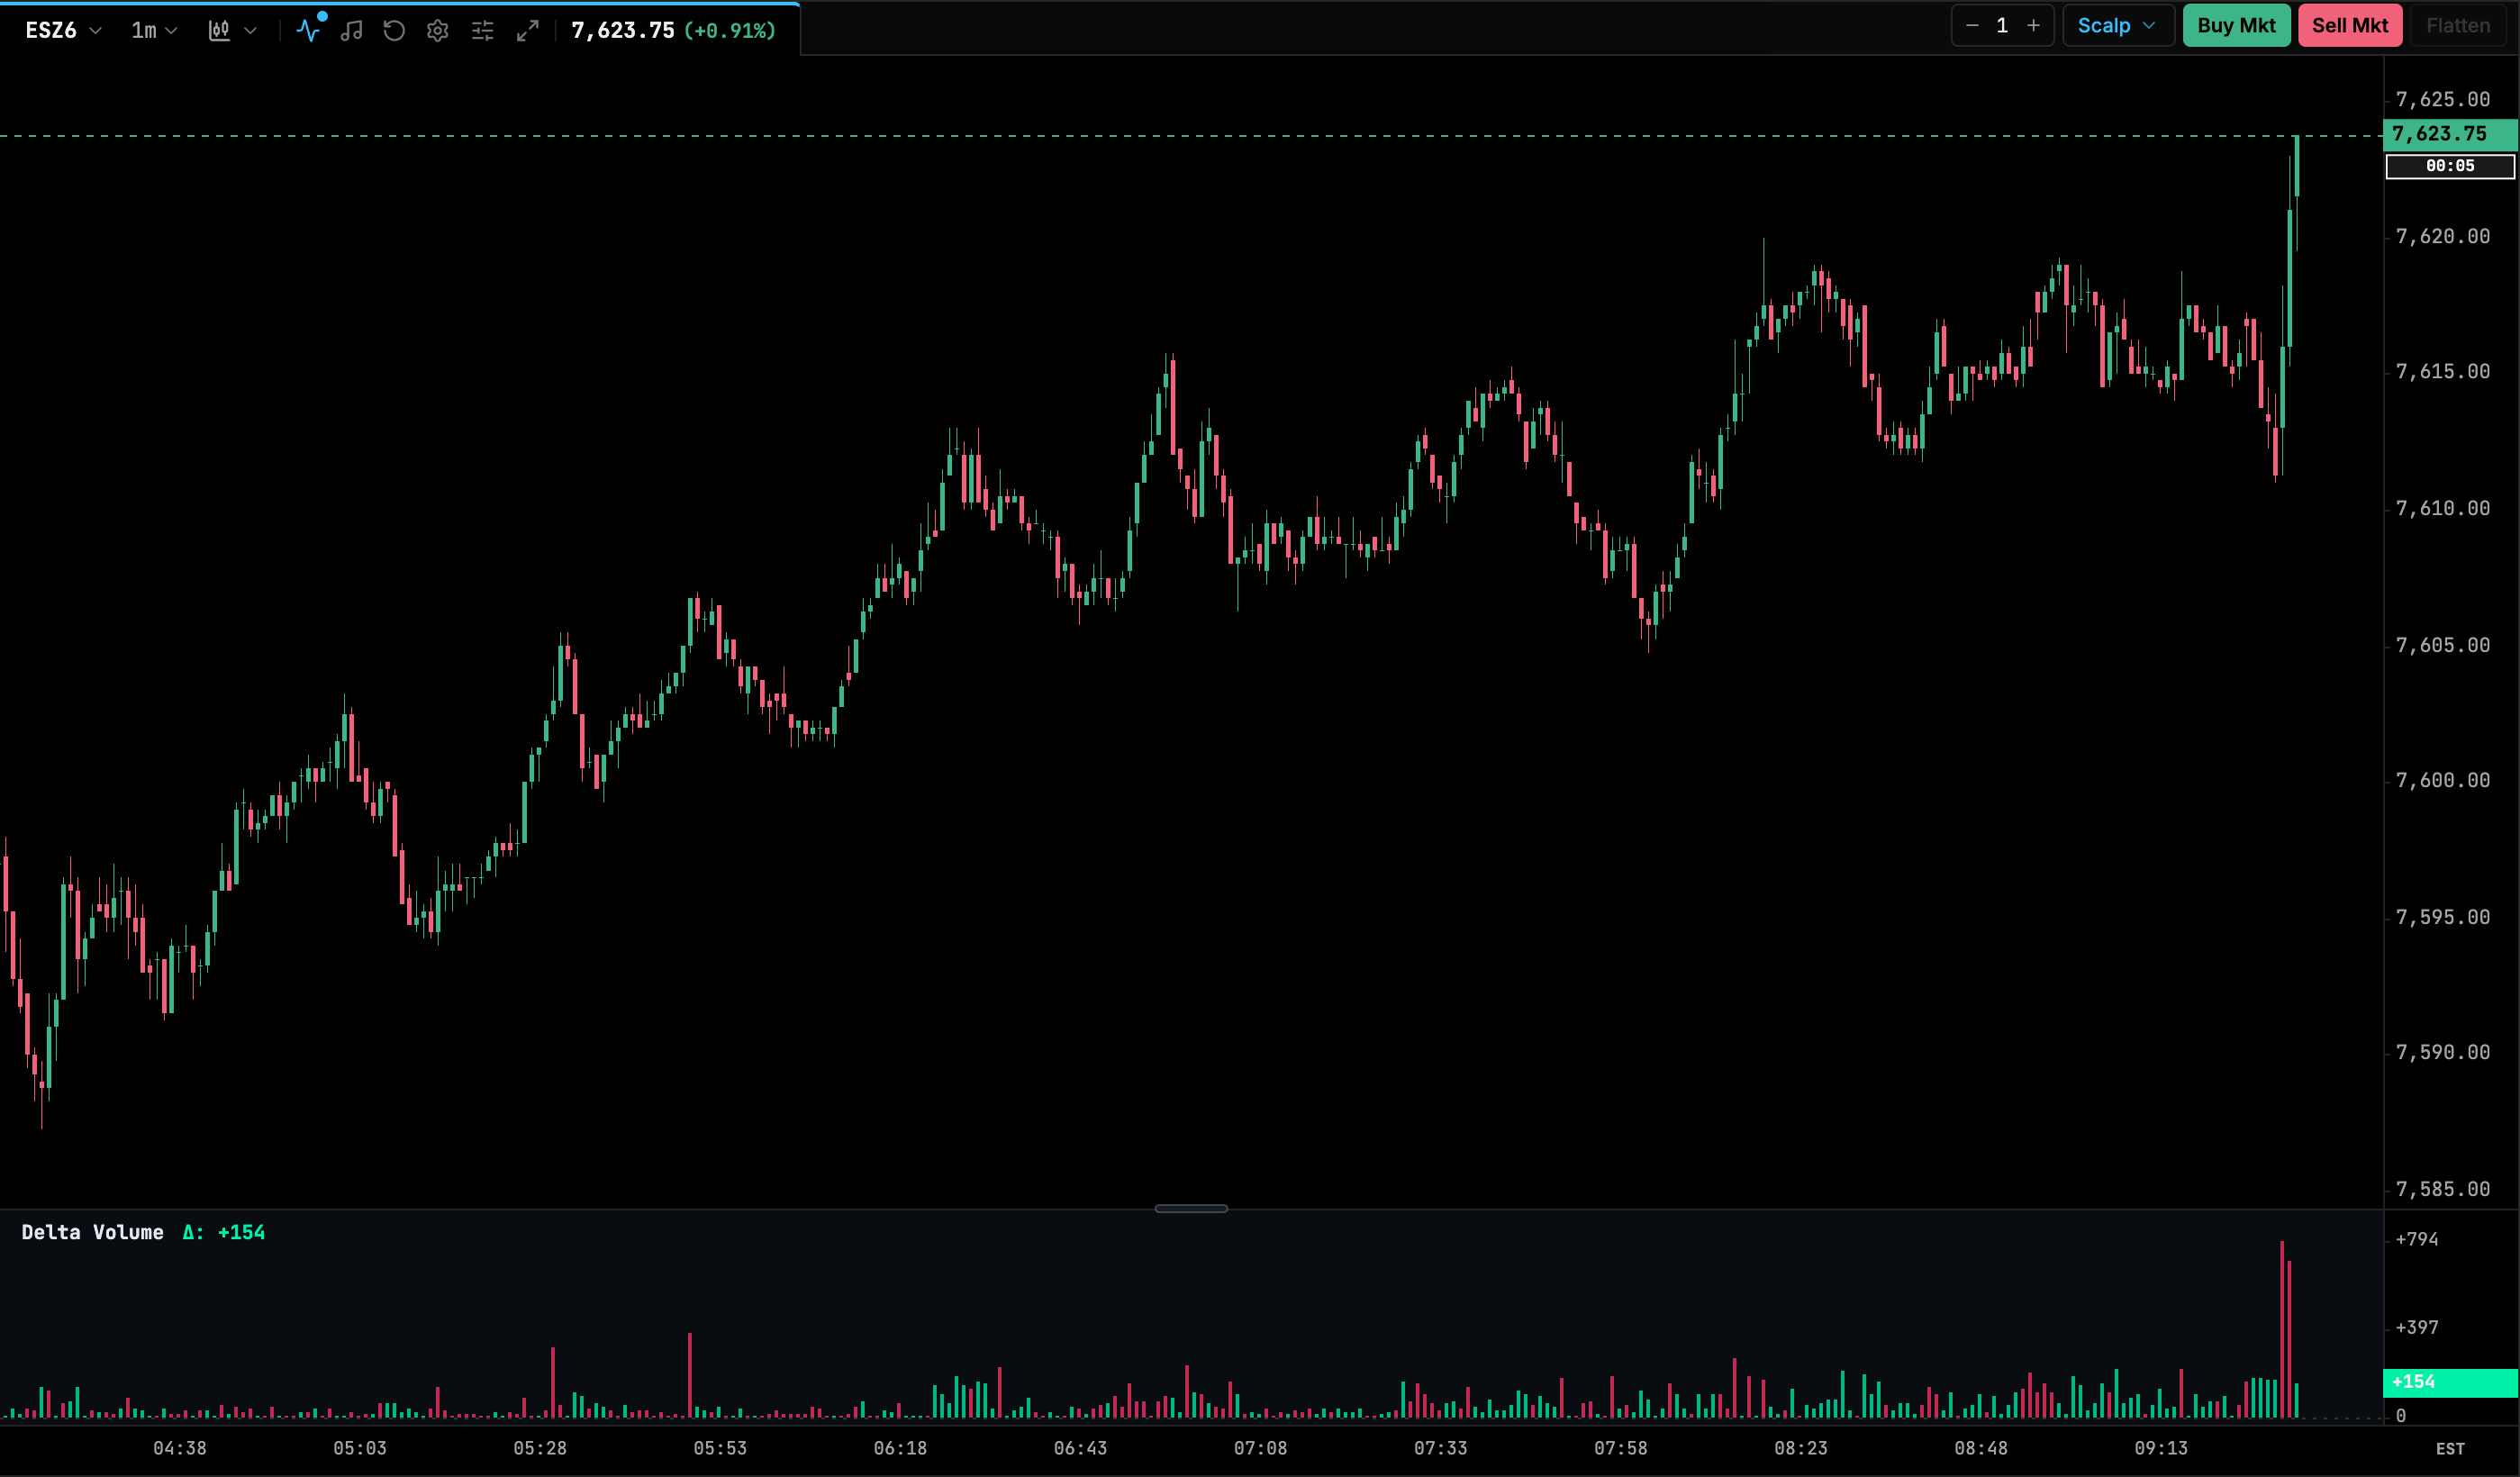
| Setting | Default | Range / options | Notes |
|---|---|---|---|
| Bullish / Bearish Delta Color | theme bull / bear | color | |
| Bar Opacity | 0.75 | 0.1–1 | |
| Show Zero Line | on | on/off | |
| Bar Width Ratio | 0.7 | 0.2–1 | Fraction of the bar slot. |
| Show Total Volume Box | off | on/off | Outlines the bar’s total volume behind the delta bar. |
| Total Volume Box Color (Optional) | empty (theme) | color | |
| Total Volume Box Offset (px) | 2 | 1–8 | |
| Calculation Methodology | Up-Tick / Down-Tick (Tick Rule) | Up-Tick / Down-Tick (Tick Rule), Bid / Ask Aggressor (Order Flow) | Applies to the bar that is still forming. |
| Min Trade Size (Filtered Delta) | 1 | 1, 2, 3, 5, 10, 20, 50, 100 | Applies to bars built live. |
| Display Delta on Price Chart | off | on/off | Prints the delta value on the price chart for each bar. |
| Font Size (px) | 10 | 8–24 | Price-chart counts. |
| Vertical Offset (px) | 6 | 1–30 | |
| Show Plus (+) for Bullish | off | on/off | |
| Show Zero Delta on Price Chart | on | on/off | |
| Min Bar Spacing (px) | 12 | 4–40 | Counts are hidden when bars are narrower than this. |
Delta Divergence
Finds swing highs and lows (pivots), then compares each one with the previous pivot of the same kind within the lookback. A bearish divergence is a higher price high with lower delta. A bullish divergence is a lower price low with higher delta. Matching pivots are joined with a line and can be labelled. Delta can be measured as CVD or as single-bar delta. With session reset on, pivots are only compared within the same CME session.
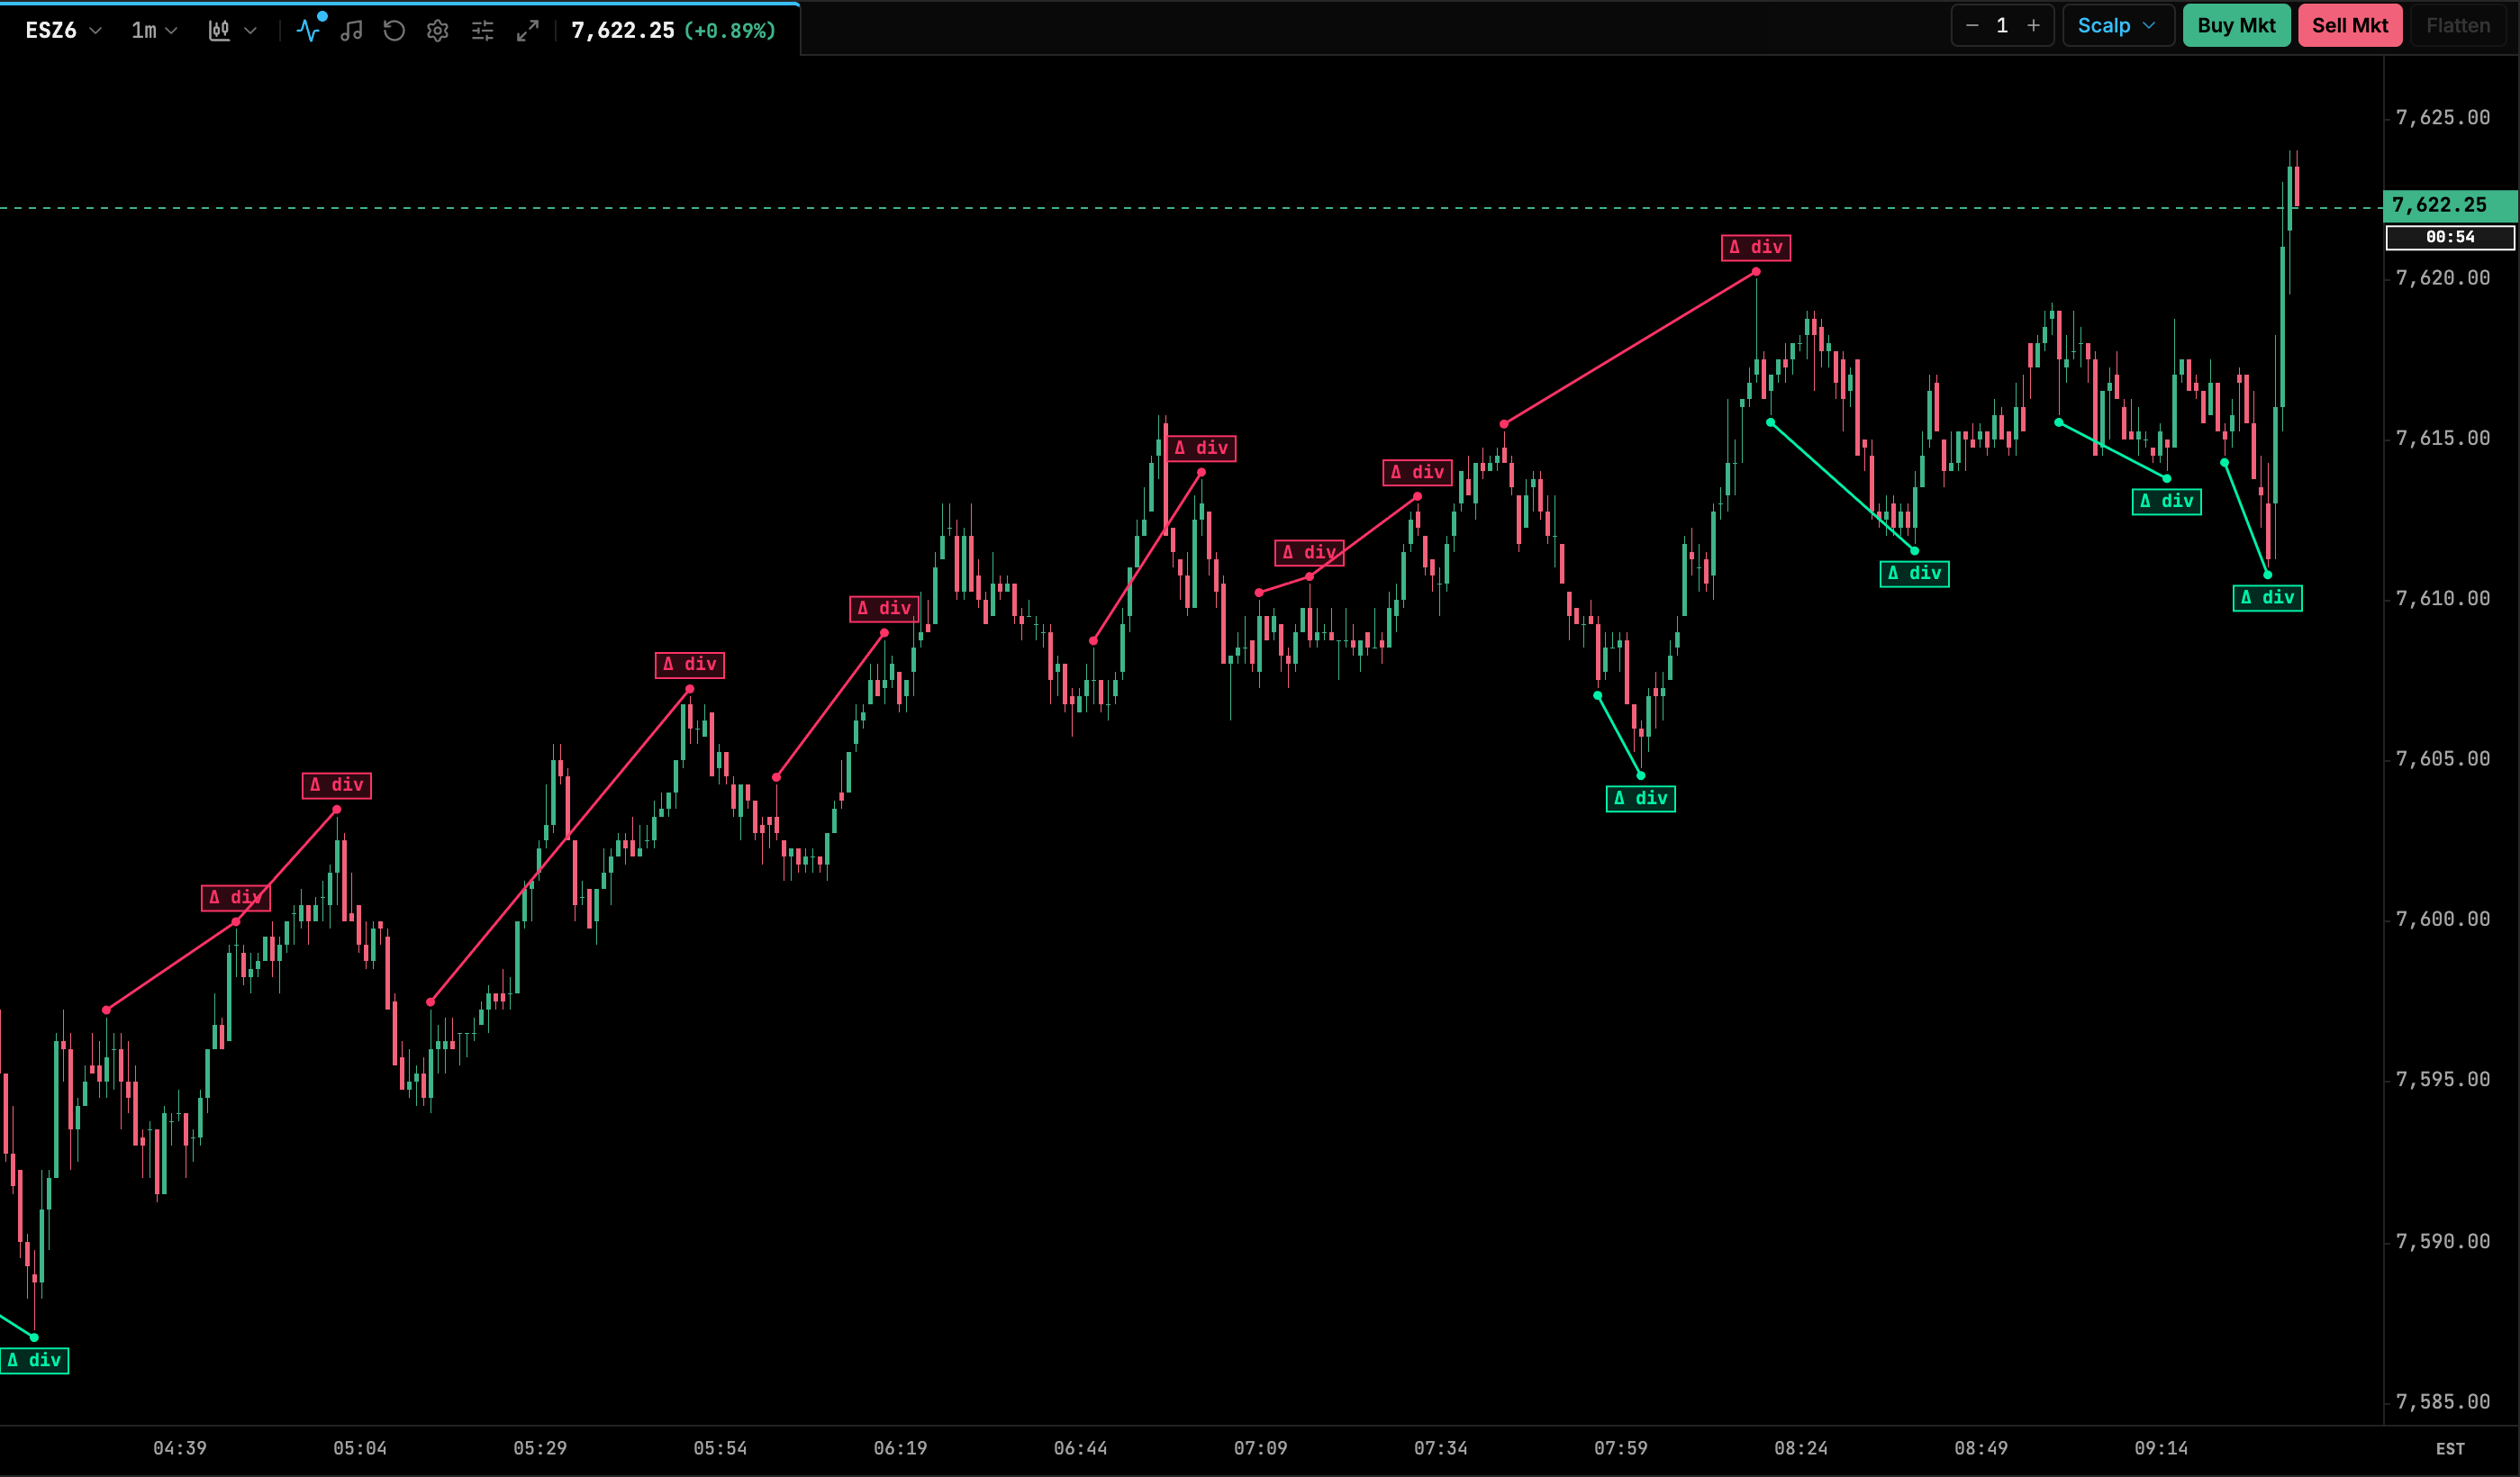
| Setting | Default | Range / options | Notes |
|---|---|---|---|
| Pivot Left Bars | 3 | 1–20 | Bars to the left that must be lower (for a high) or higher (for a low). |
| Pivot Right Bars | 3 | 1–20 | A pivot is confirmed only after this many bars, so it appears with a delay. |
| Max Bars Between Pivots | 50 | 5–500 | |
| Delta Measure | Cumulative Delta (CVD) | Cumulative Delta (CVD), Bar Delta | |
| CVD Reset | Each Session | Each Session, Never | |
| Show Bullish / Show Bearish | on / on | on/off | |
| Show Labels | on | on/off | |
| Line Width | 1.5 | ||
| Bullish / Bearish Color | theme bull / bear | color |
Absorption
A port of the NinjaScript Absorption study. A bar whose absolute delta is larger than Threshold × SMA(|delta|, Period) is a strong-delta bar. If the next bar reverses (opposite delta and opposite close direction), the strong-delta bar is marked with an A and a support or resistance ray is drawn from it until price breaks through. A developing signal on the bar that is still forming uses its own color.
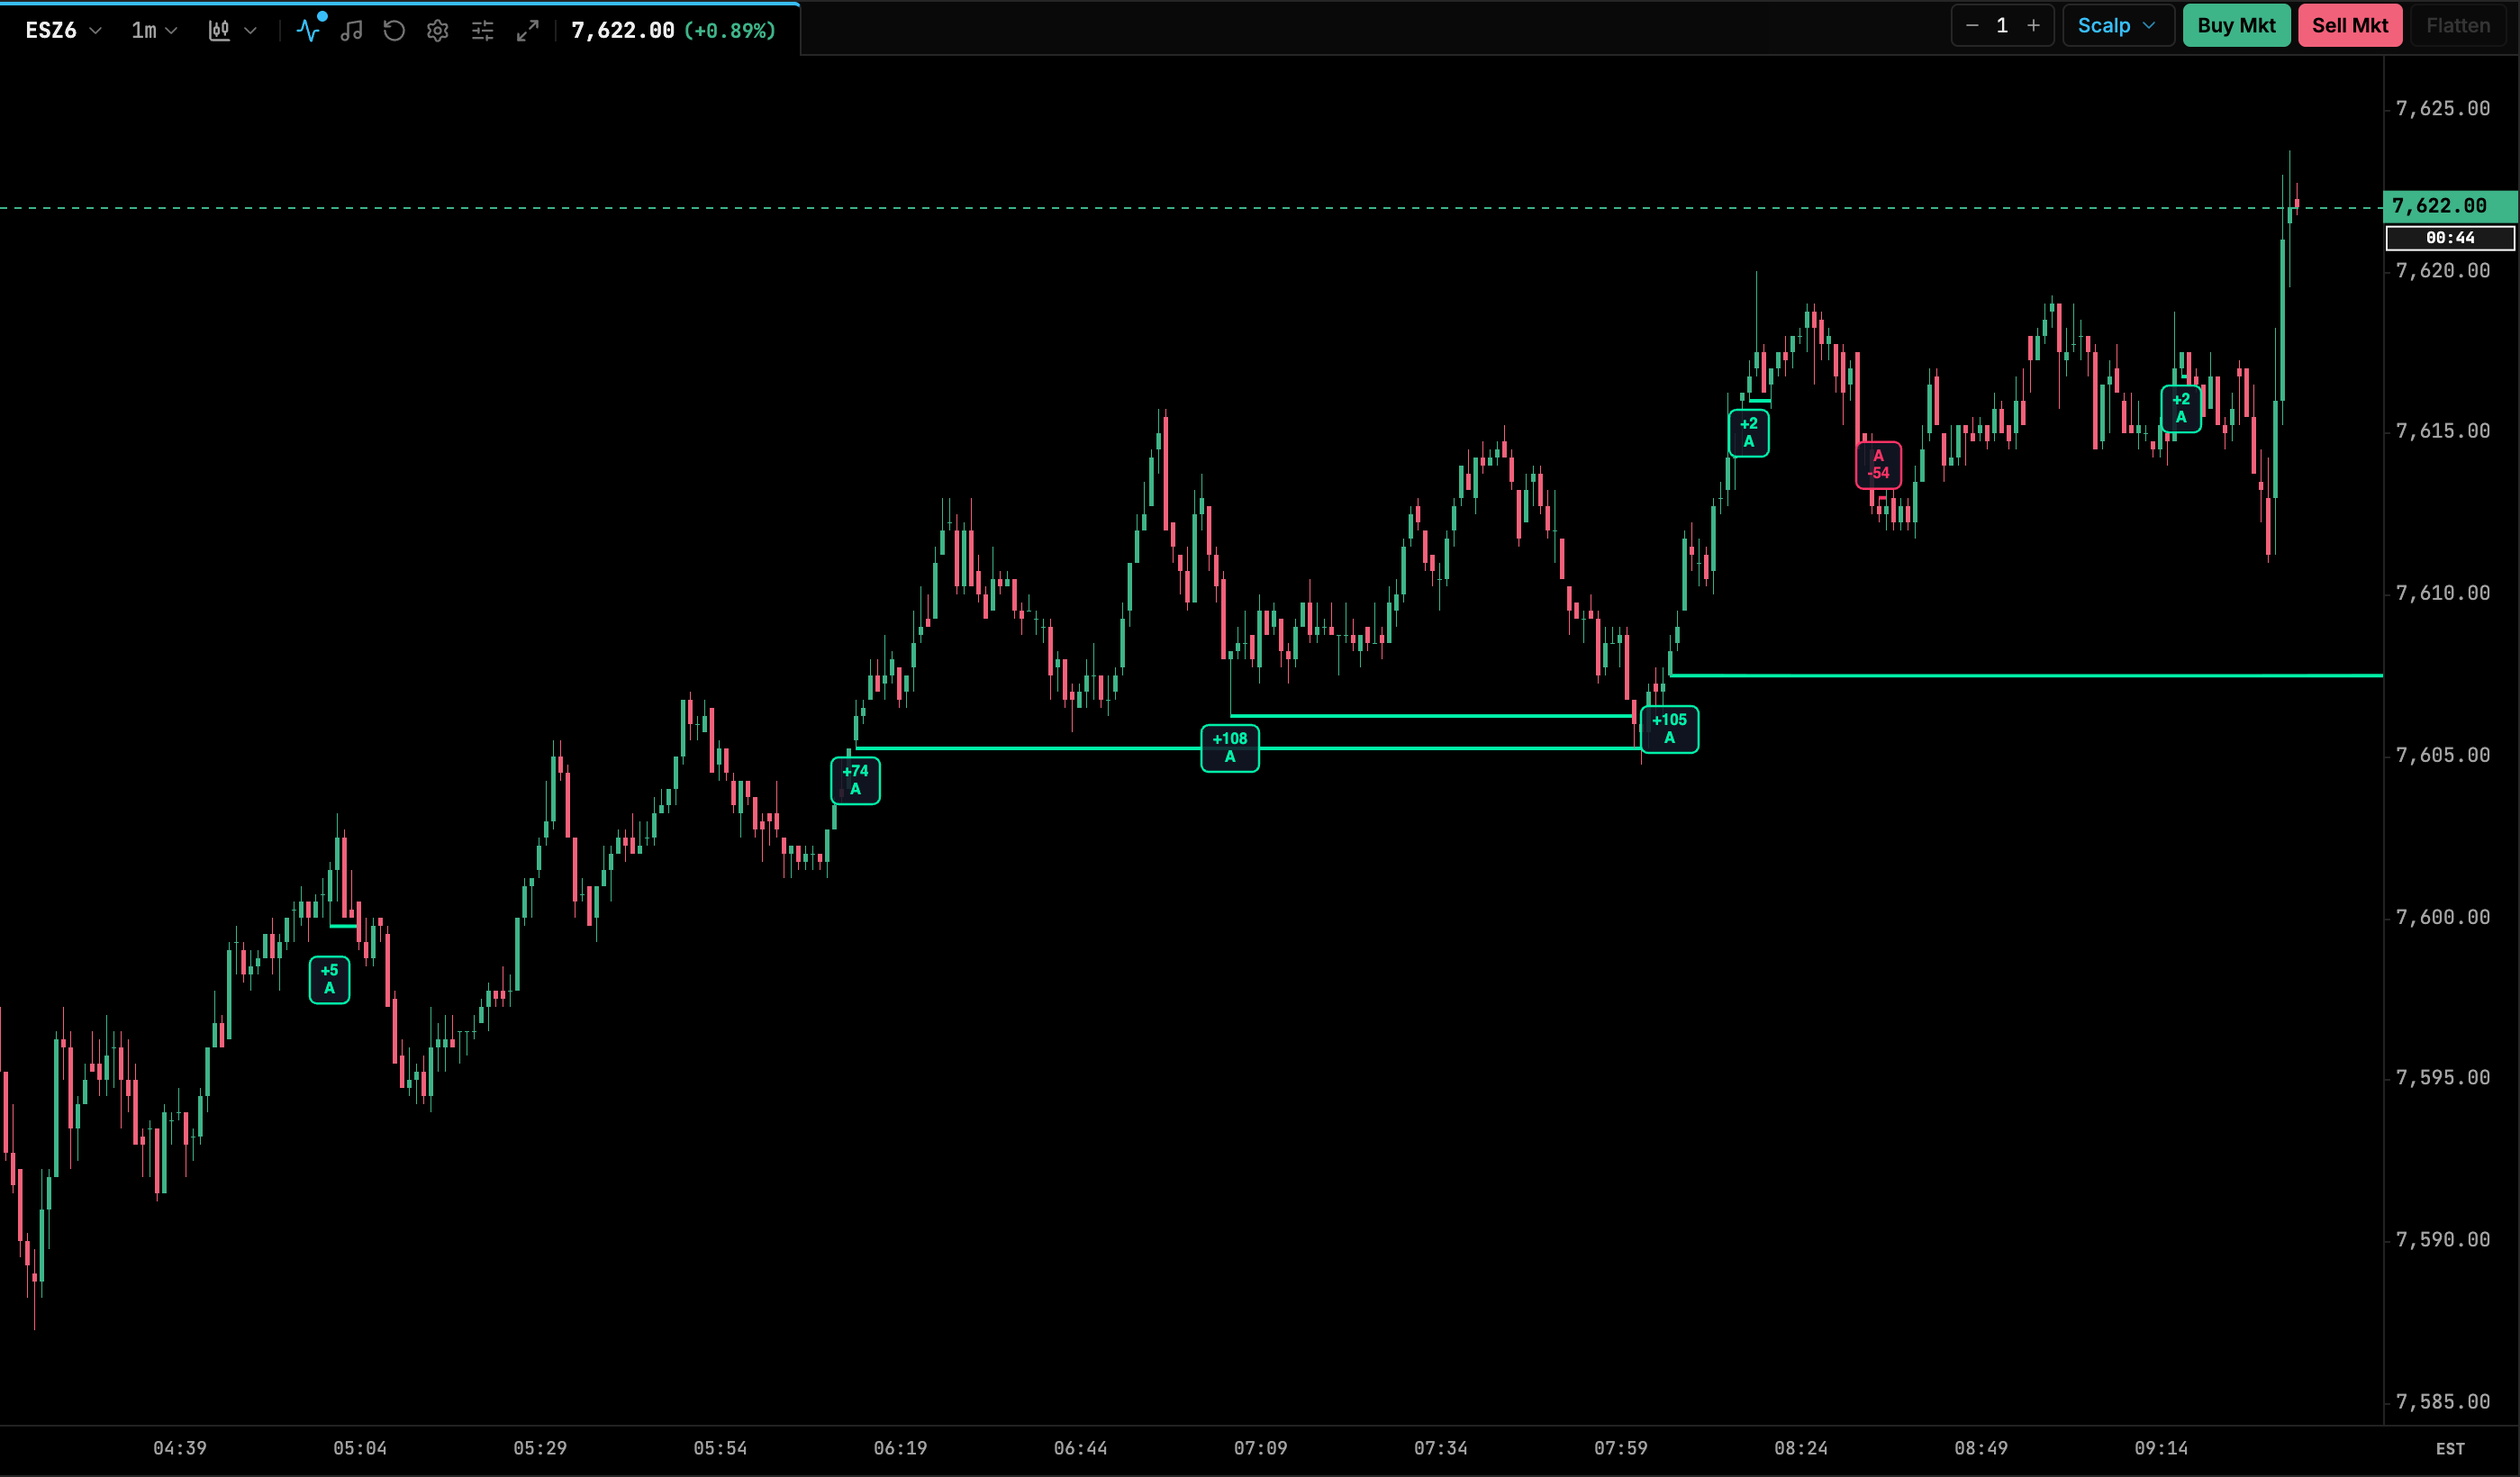
| Setting | Default | Range / options | Notes |
|---|---|---|---|
| Delta Strength Period | 20 | 1–100 | SMA length for average absolute delta. |
| Delta Strength Threshold | 1.5 | 1–10 (step 0.1) | Multiple of the average. |
| Bullish / Bearish Signal Color | theme bull / bear | color | |
| Developing Signal Color | #FFA500 | color | Signal on the forming bar. |
| Show Delta On Triggered | on | on/off | Prints delta next to confirmed signals. |
| Show Delta On Developing | off | on/off | |
| Font Size (px) | 11 | 6–30 | |
| Vertical Offset (px) | 5 | 0–50 | |
| Stagger Labels | on | on/off | |
| Abbreviate Numbers | on | on/off | For example 1.2K. |
| Scale Font Size With Zoom | on | on/off | |
| Show Absorption Rays | on | on/off | |
| Ray Width | 2 | 1–10 | |
| Ray Dash Style | Solid | Solid, Dashed, Dotted | |
| Calculate Limit Bars | 300 | 0–5000 (step 50) | Only the last N bars are scanned. 0 = unlimited. |
Big Trades
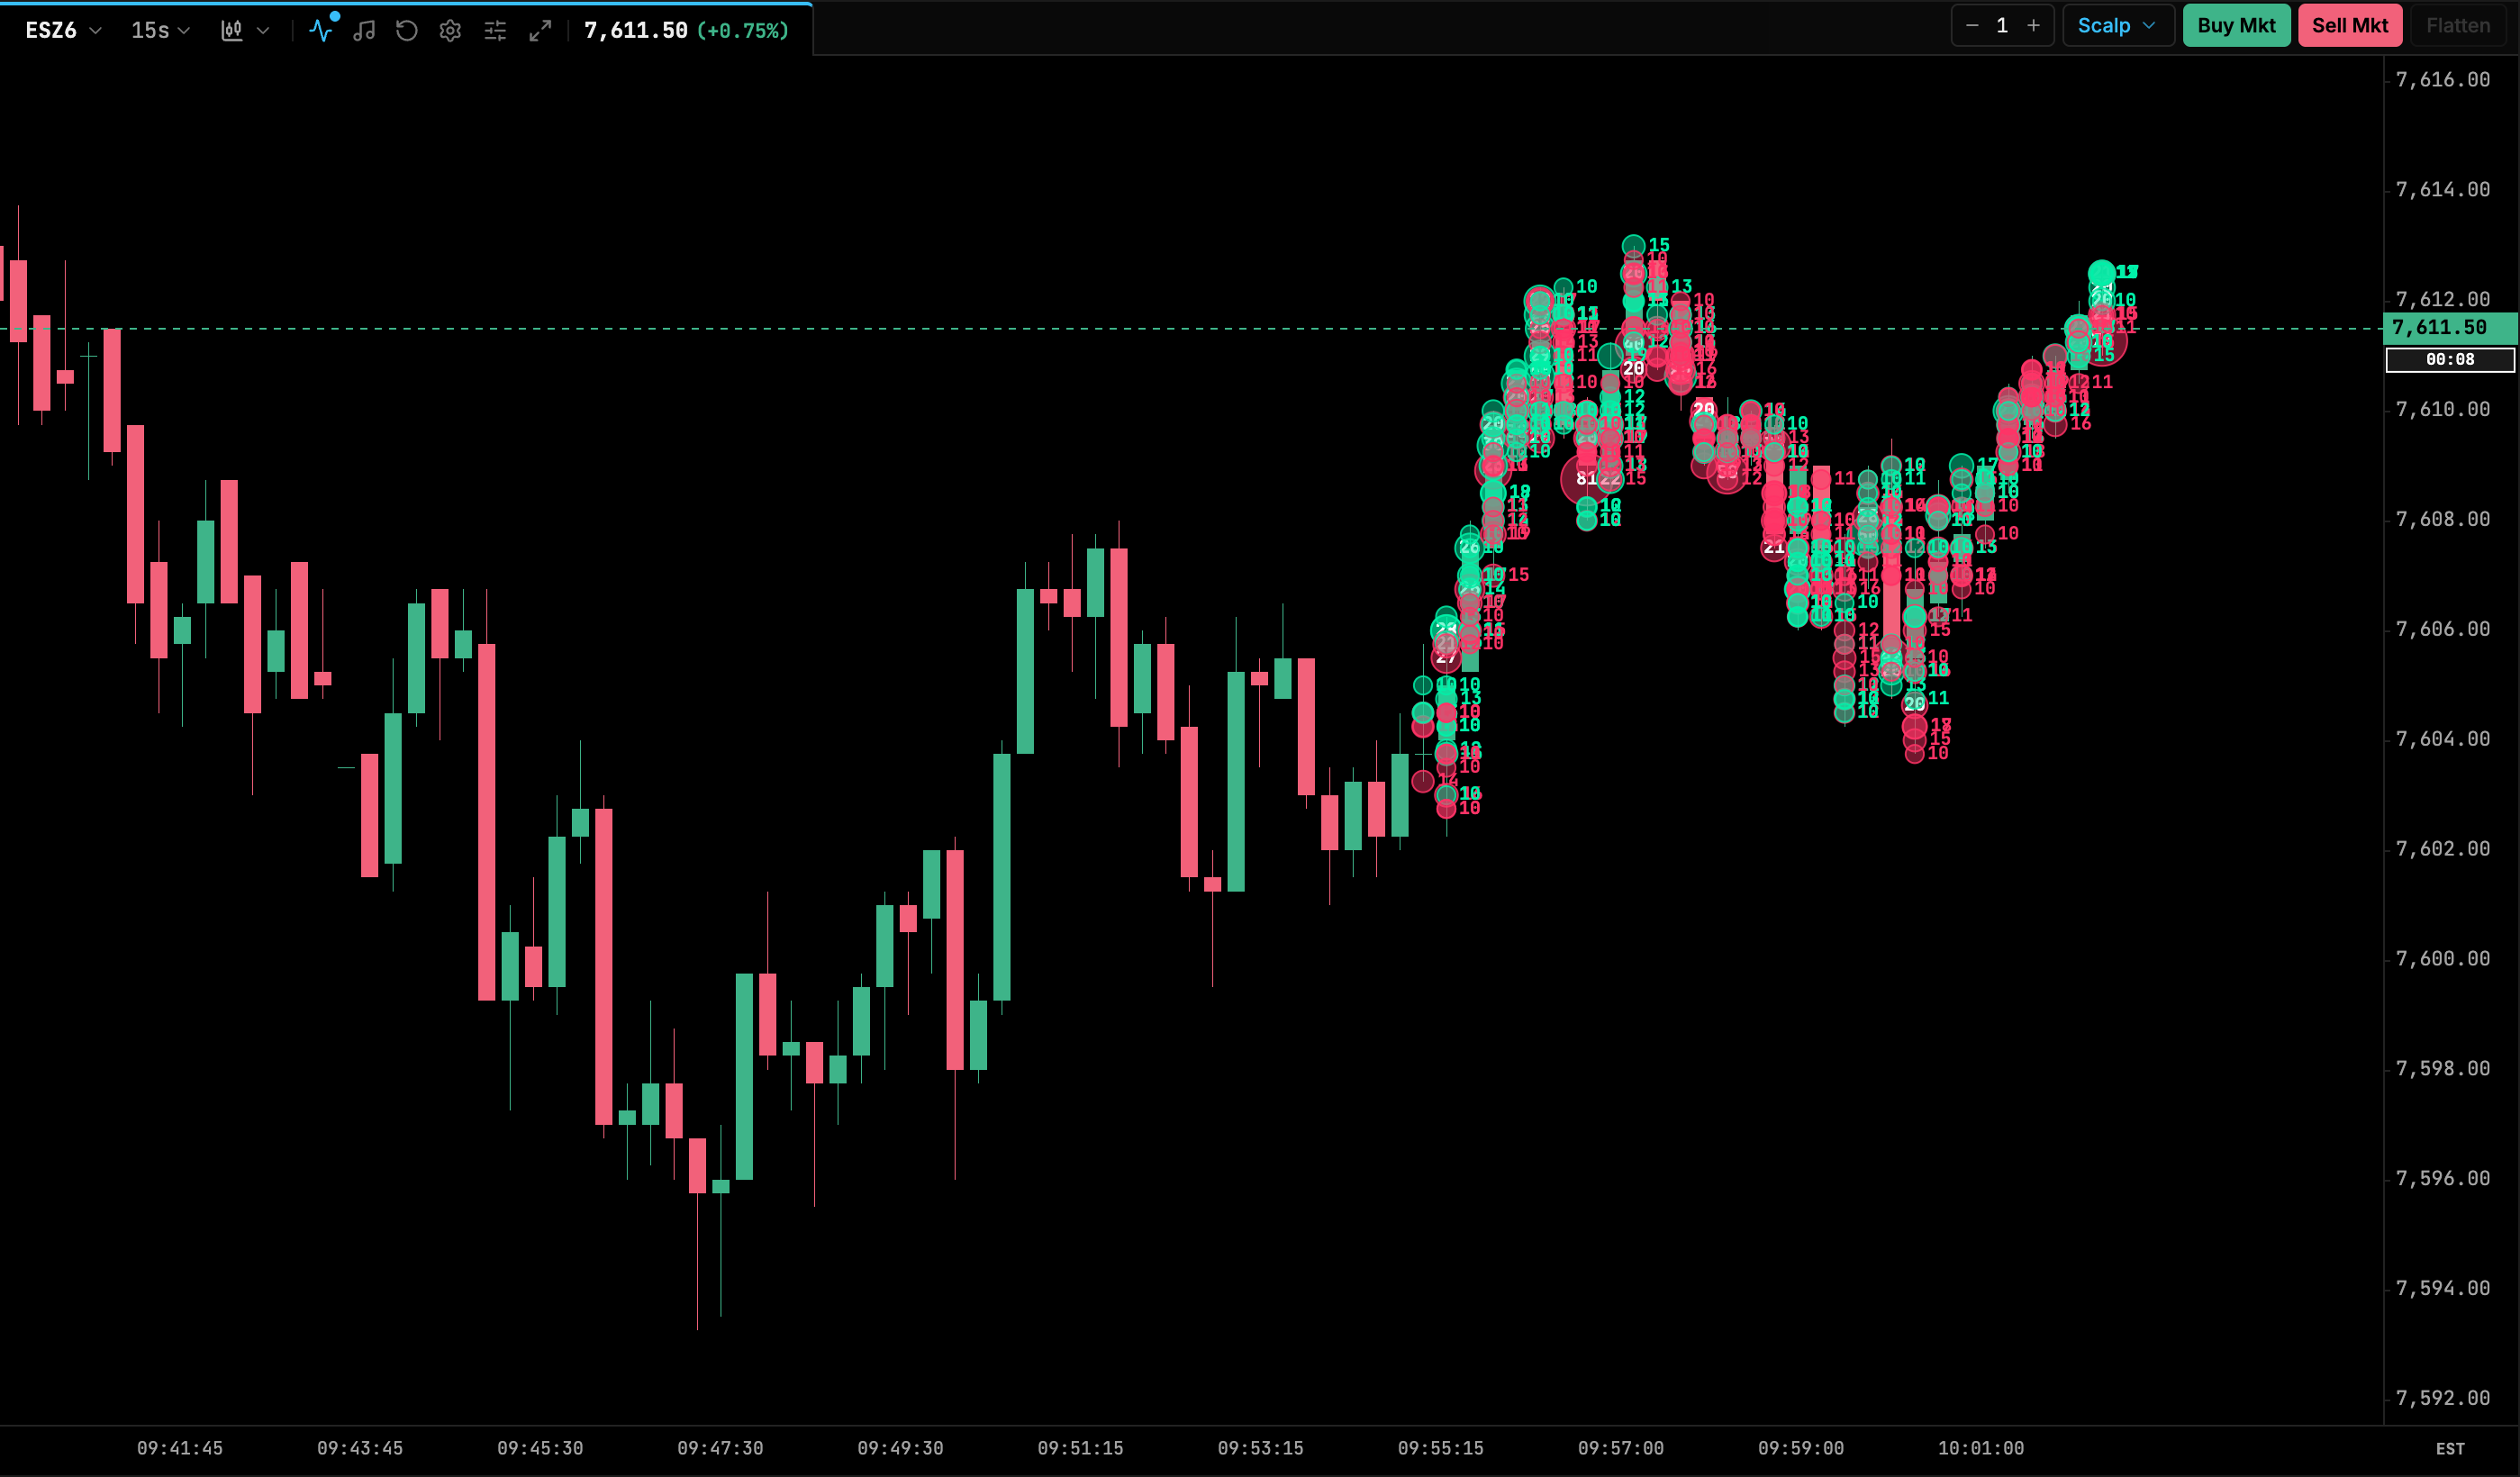
Rebuilds large aggressive orders from the tape. Prints with the same aggressor side and the same exchange timestamp are combined into one order, and orders at or above the minimum size are drawn as bubbles sized by contract count. Buy aggressors use the bull color and sell aggressors the bear color. The bubble list belongs to the current session and clears at each CME session change.
| Setting | Default | Range / options | Notes |
|---|---|---|---|
| Minimum Order Size (contracts) | 20 | 1–10000 | |
| Max Bubbles | 500 | 10–500 (step 10) | The oldest bubbles are dropped first. |
| Show Size Label | on | on/off | |
| Bubble Scale | 1 | 0.25–4 | |
| Bubble Opacity | 0.45 | 0.1–1 | |
| Label Font Size (px) | 10 | 7–18 | |
| Buy / Sell Aggressor Color | theme bull / bear | color |
Market Speed
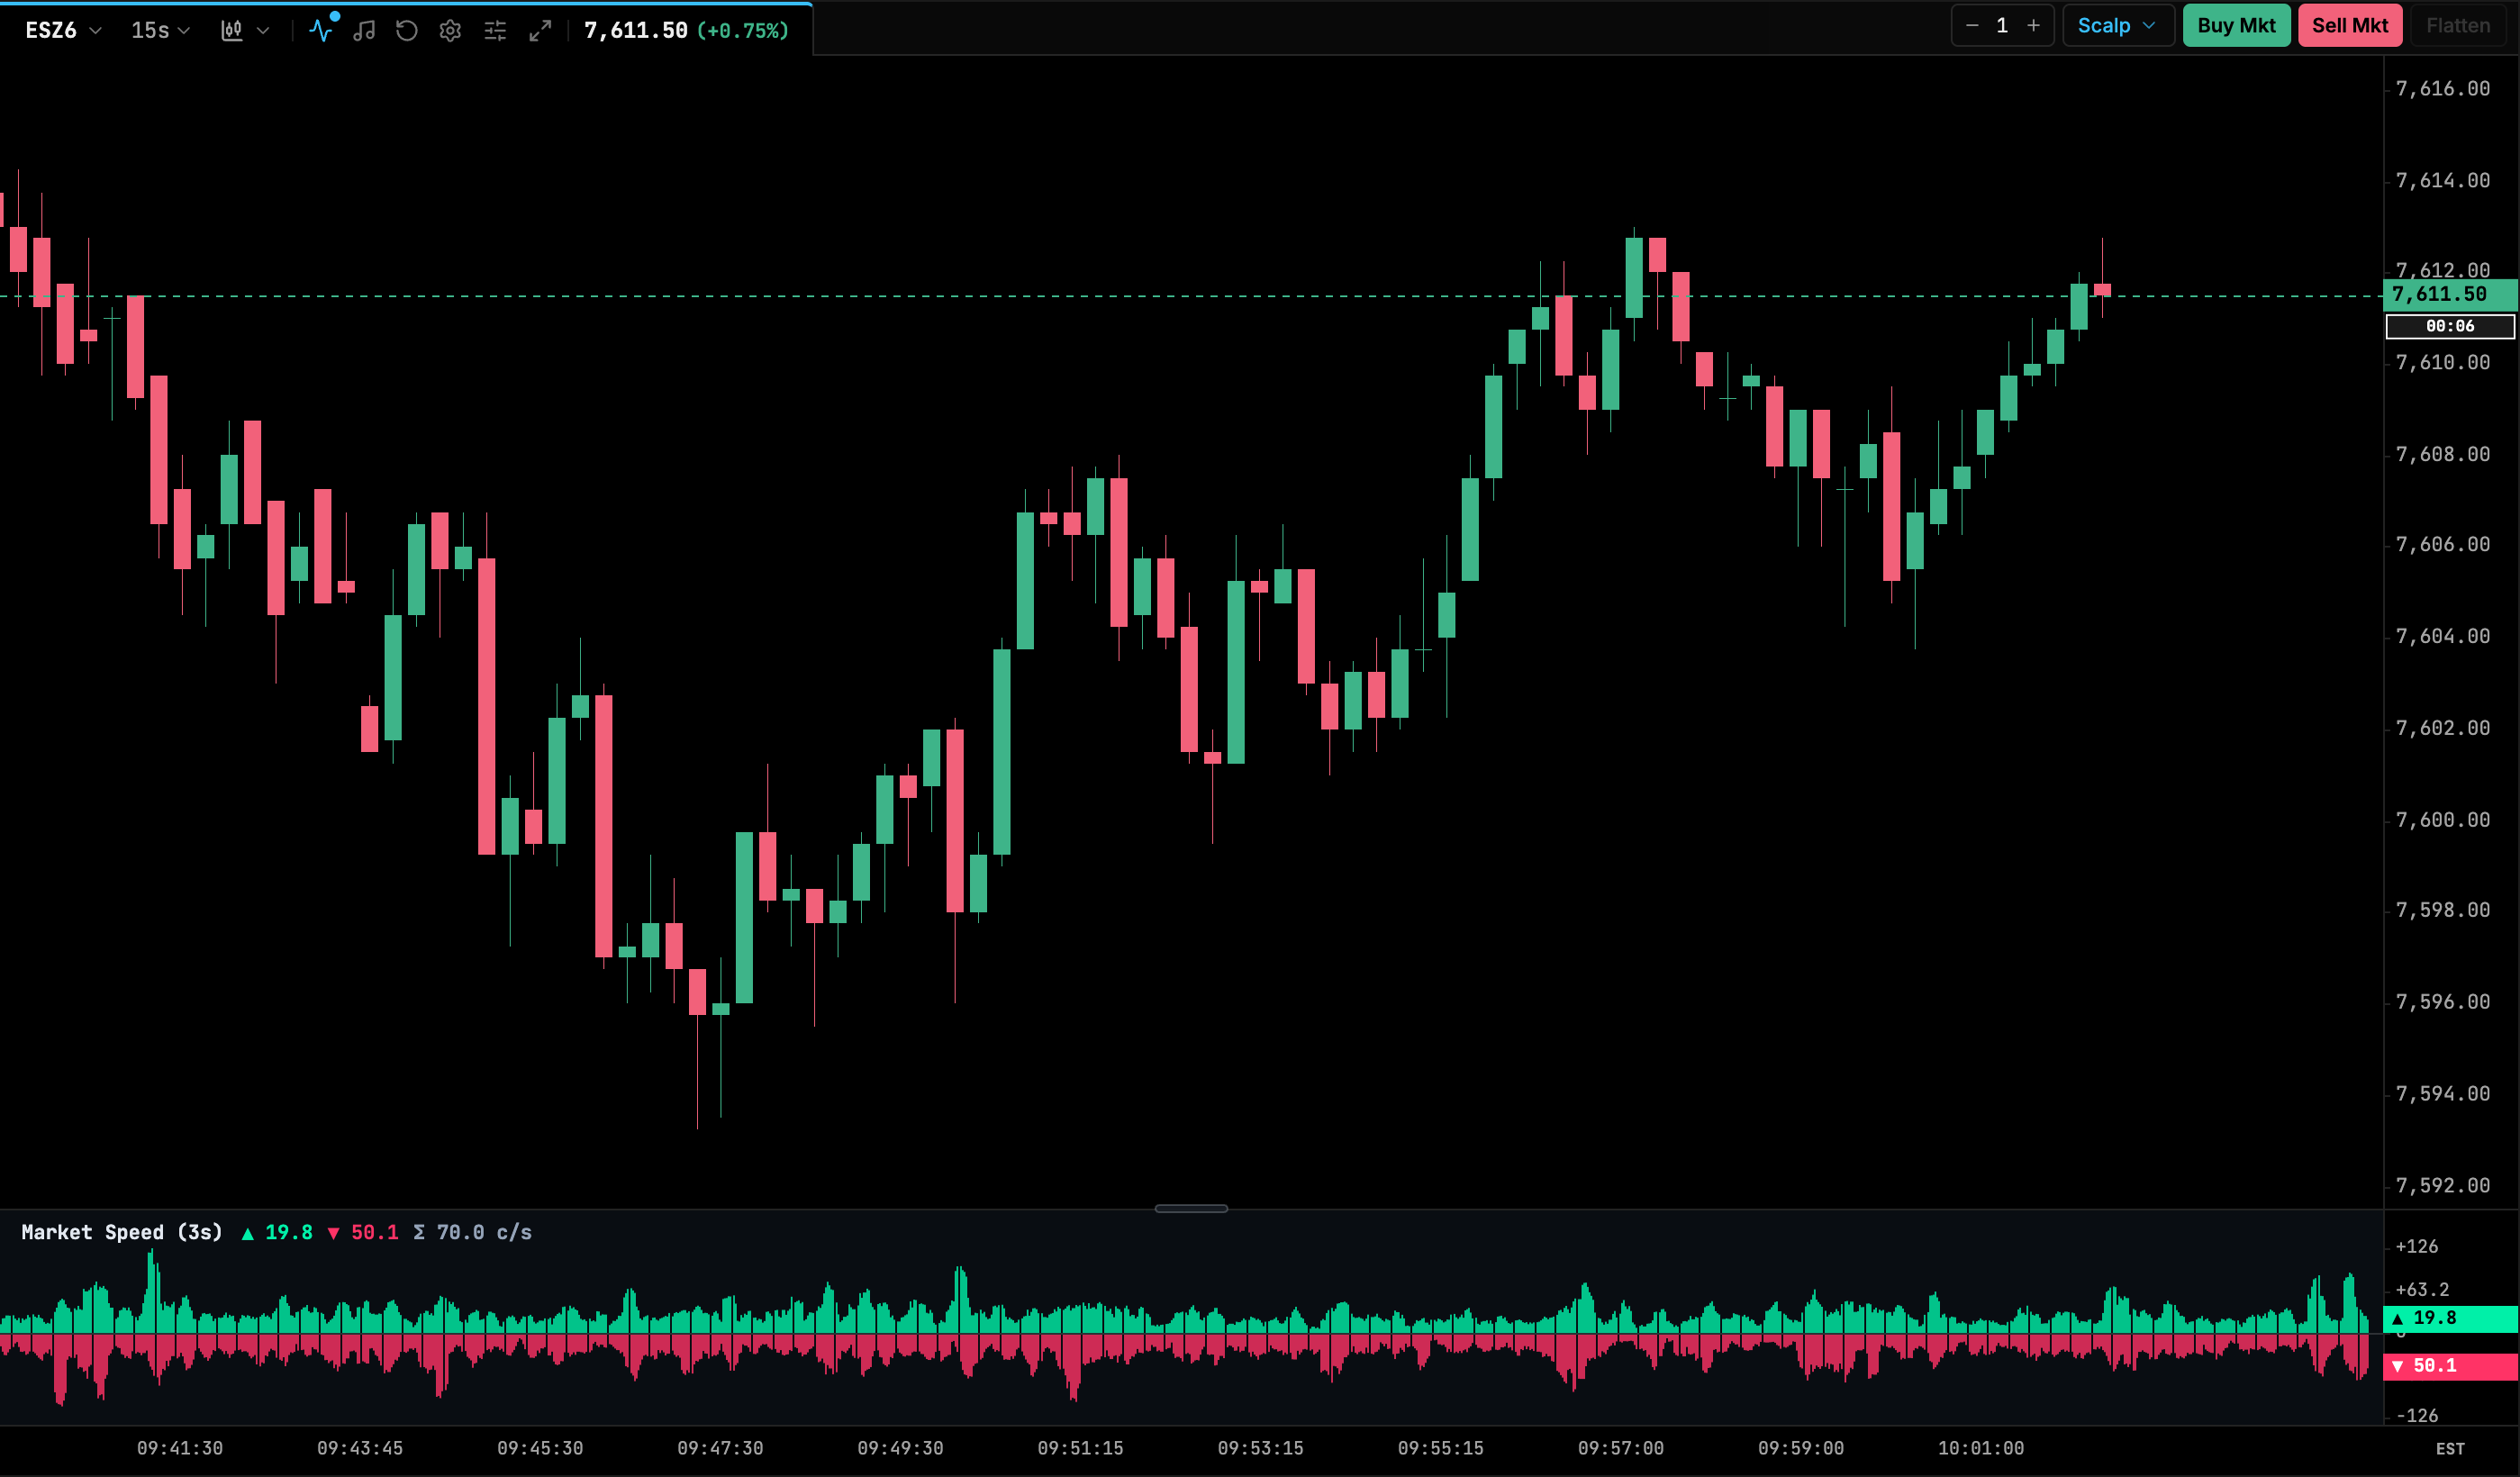
Contracts per second traded by buy aggressors (bars above the baseline) and sell aggressors (bars below), measured over a short rolling window and sampled at a fixed interval. It shows bursts of aggression that a time-based chart hides. Like Big Trades, it is live only and starts empty.
| Setting | Default | Range / options | Notes |
|---|---|---|---|
| Rolling Window (seconds) | 3 | 1–5 | Window used for the contracts-per-second rate. |
| History (seconds) | 120 | 15–600 (step 15) | How much history the pane keeps. |
| Sample Interval | 500 ms | 250 ms, 500 ms, 1 s | |
| Show Baseline | on | on/off | |
| Buy / Sell Color | theme bull / bear | color |
OrderFlow Scalper
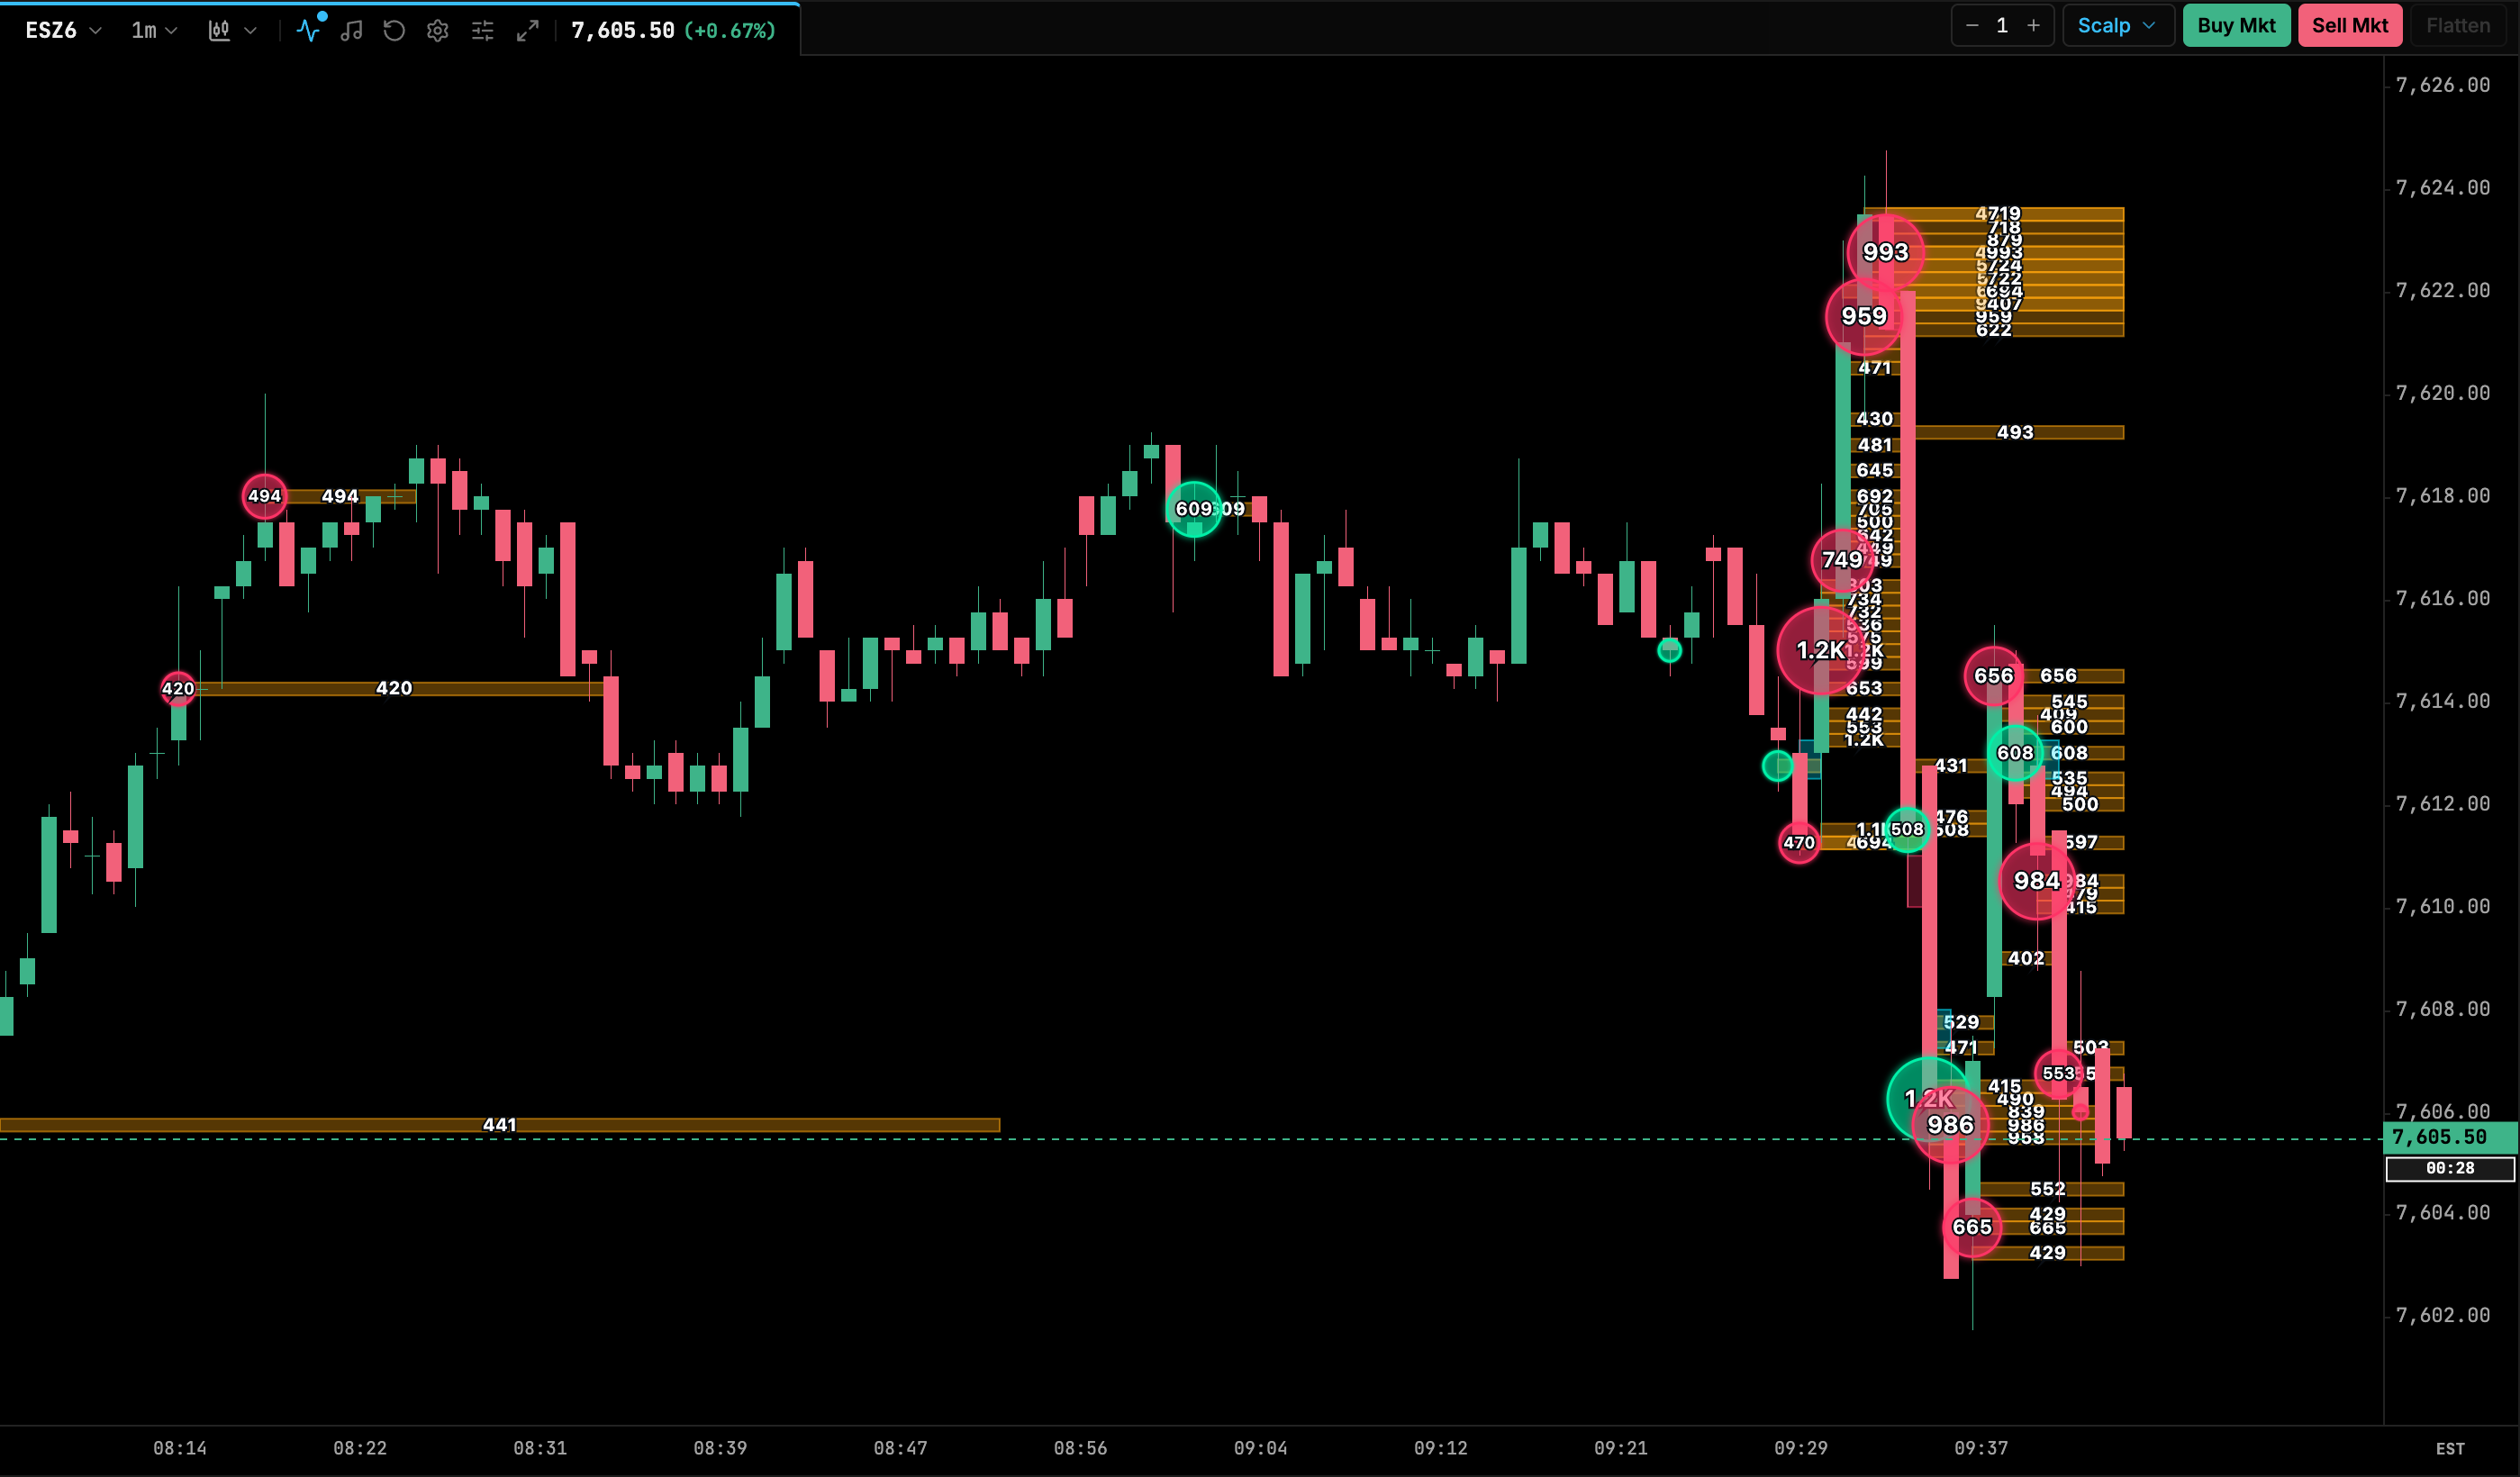
Reads footprint data (bid and ask volume at each price inside each bar) and draws three layers:
- Volume bubbles on candles at high-volume prices. By default only each bar’s peak (POC) cluster is shown. Trapped at Wicks shows only bubbles at the bar’s high and low extremes.
- High Volume Node (HVN) shelves, extended right until price trades back through them.
- Imbalance shelves or stacked zones where diagonal ask/bid volume exceeds the multiplier.
Nearby levels can be grouped into a single zone. The indicator responds to the cursor (hover highlights).
| Setting | Default | Range / options | Notes |
|---|---|---|---|
| Show Volume Bubbles | on | on/off | |
| Bubble Cluster Filter | Peak POC per Candle | Peak POC per Candle, Trapped at Wicks, All Clusters Exceeding Threshold | |
| Wick Range Threshold (%) | 25 | 10–50 (step 5) | Defines the wick region for Trapped at Wicks. |
| Bubble Min Volume Threshold | 50 | 1–10000 (step 5) | |
| Bubble Max Volume (Radius Ceiling) | 500 | 10–50000 (step 25) | Volume at which bubbles reach max radius. |
| Auto Scale Bubble Threshold (90th %ile) | off | on/off | Sets the threshold from the 90th percentile of volume. |
| Min / Max Bubble Radius (px) | 4 / 24 | 2–12 / 12–60 | |
| Show Volume Numbers Inside Bubbles | on | on/off | |
| Bubble Display Mode | Dominant Aggressor (Solid) | Dominant Aggressor, Split Circle (Bid / Ask Ratio), Delta Only | |
| Buyer / Seller Dominant Color | theme bull / bear | color | |
| Balanced Volume Color | theme amber | color | |
| Bubble Opacity | 0.35 | 0.1–0.95 | |
| Ambient Bubble Glow | on | on/off | |
| Show High Volume Nodes (HVN) | on | on/off | |
| HVN Min Volume Threshold | 100 | 10–10000 (step 10) | |
| HVN Extension Mode | Until Mitigated by Price | Until Mitigated by Price, Fixed Bar Duration, Full Visible Chart Extension | Fixed Bar Duration uses a fixed 50 bars. That length isn’t editable. |
| HVN Shelf Color / Opacity | #F59E0B / 0.35 | ||
| Show Orderflow Imbalances | on | on/off | |
| Imbalance Mode | Individual Shelves | Individual Shelves, Stacked Zones, Hybrid (Both) | |
| Imbalance Multiplier | 3 | 1.5–10 (step 0.5) | Diagonal ratio required. |
| Imbalance Min Volume | 20 | 0–500 | |
| Min Stack Levels | 3 | 2–10 | Consecutive imbalanced prices needed for a stacked zone. |
| Stacked Imbalances Only (Shelves Mode) | off | on/off | |
| Imbalance Extension Mode | Until Mitigated by Price | Until Mitigated by Price, Fixed Bar Duration, Full Visible Chart Extension | Fixed Bar Duration = 50 bars. |
| Buy / Sell Imbalance Color | theme cyan / bear | color | |
| Imbalance Shelf Opacity | 0.3 | ||
| Group Nearby Levels into Zones | off | on/off | |
| Grouping Tick Radius | 4 | 1–50 | |
| Levels to Group | Both HVN & Imbalances | Both HVN & Imbalances, HVN Only, Orderflow Imbalances Only |
Iceberg
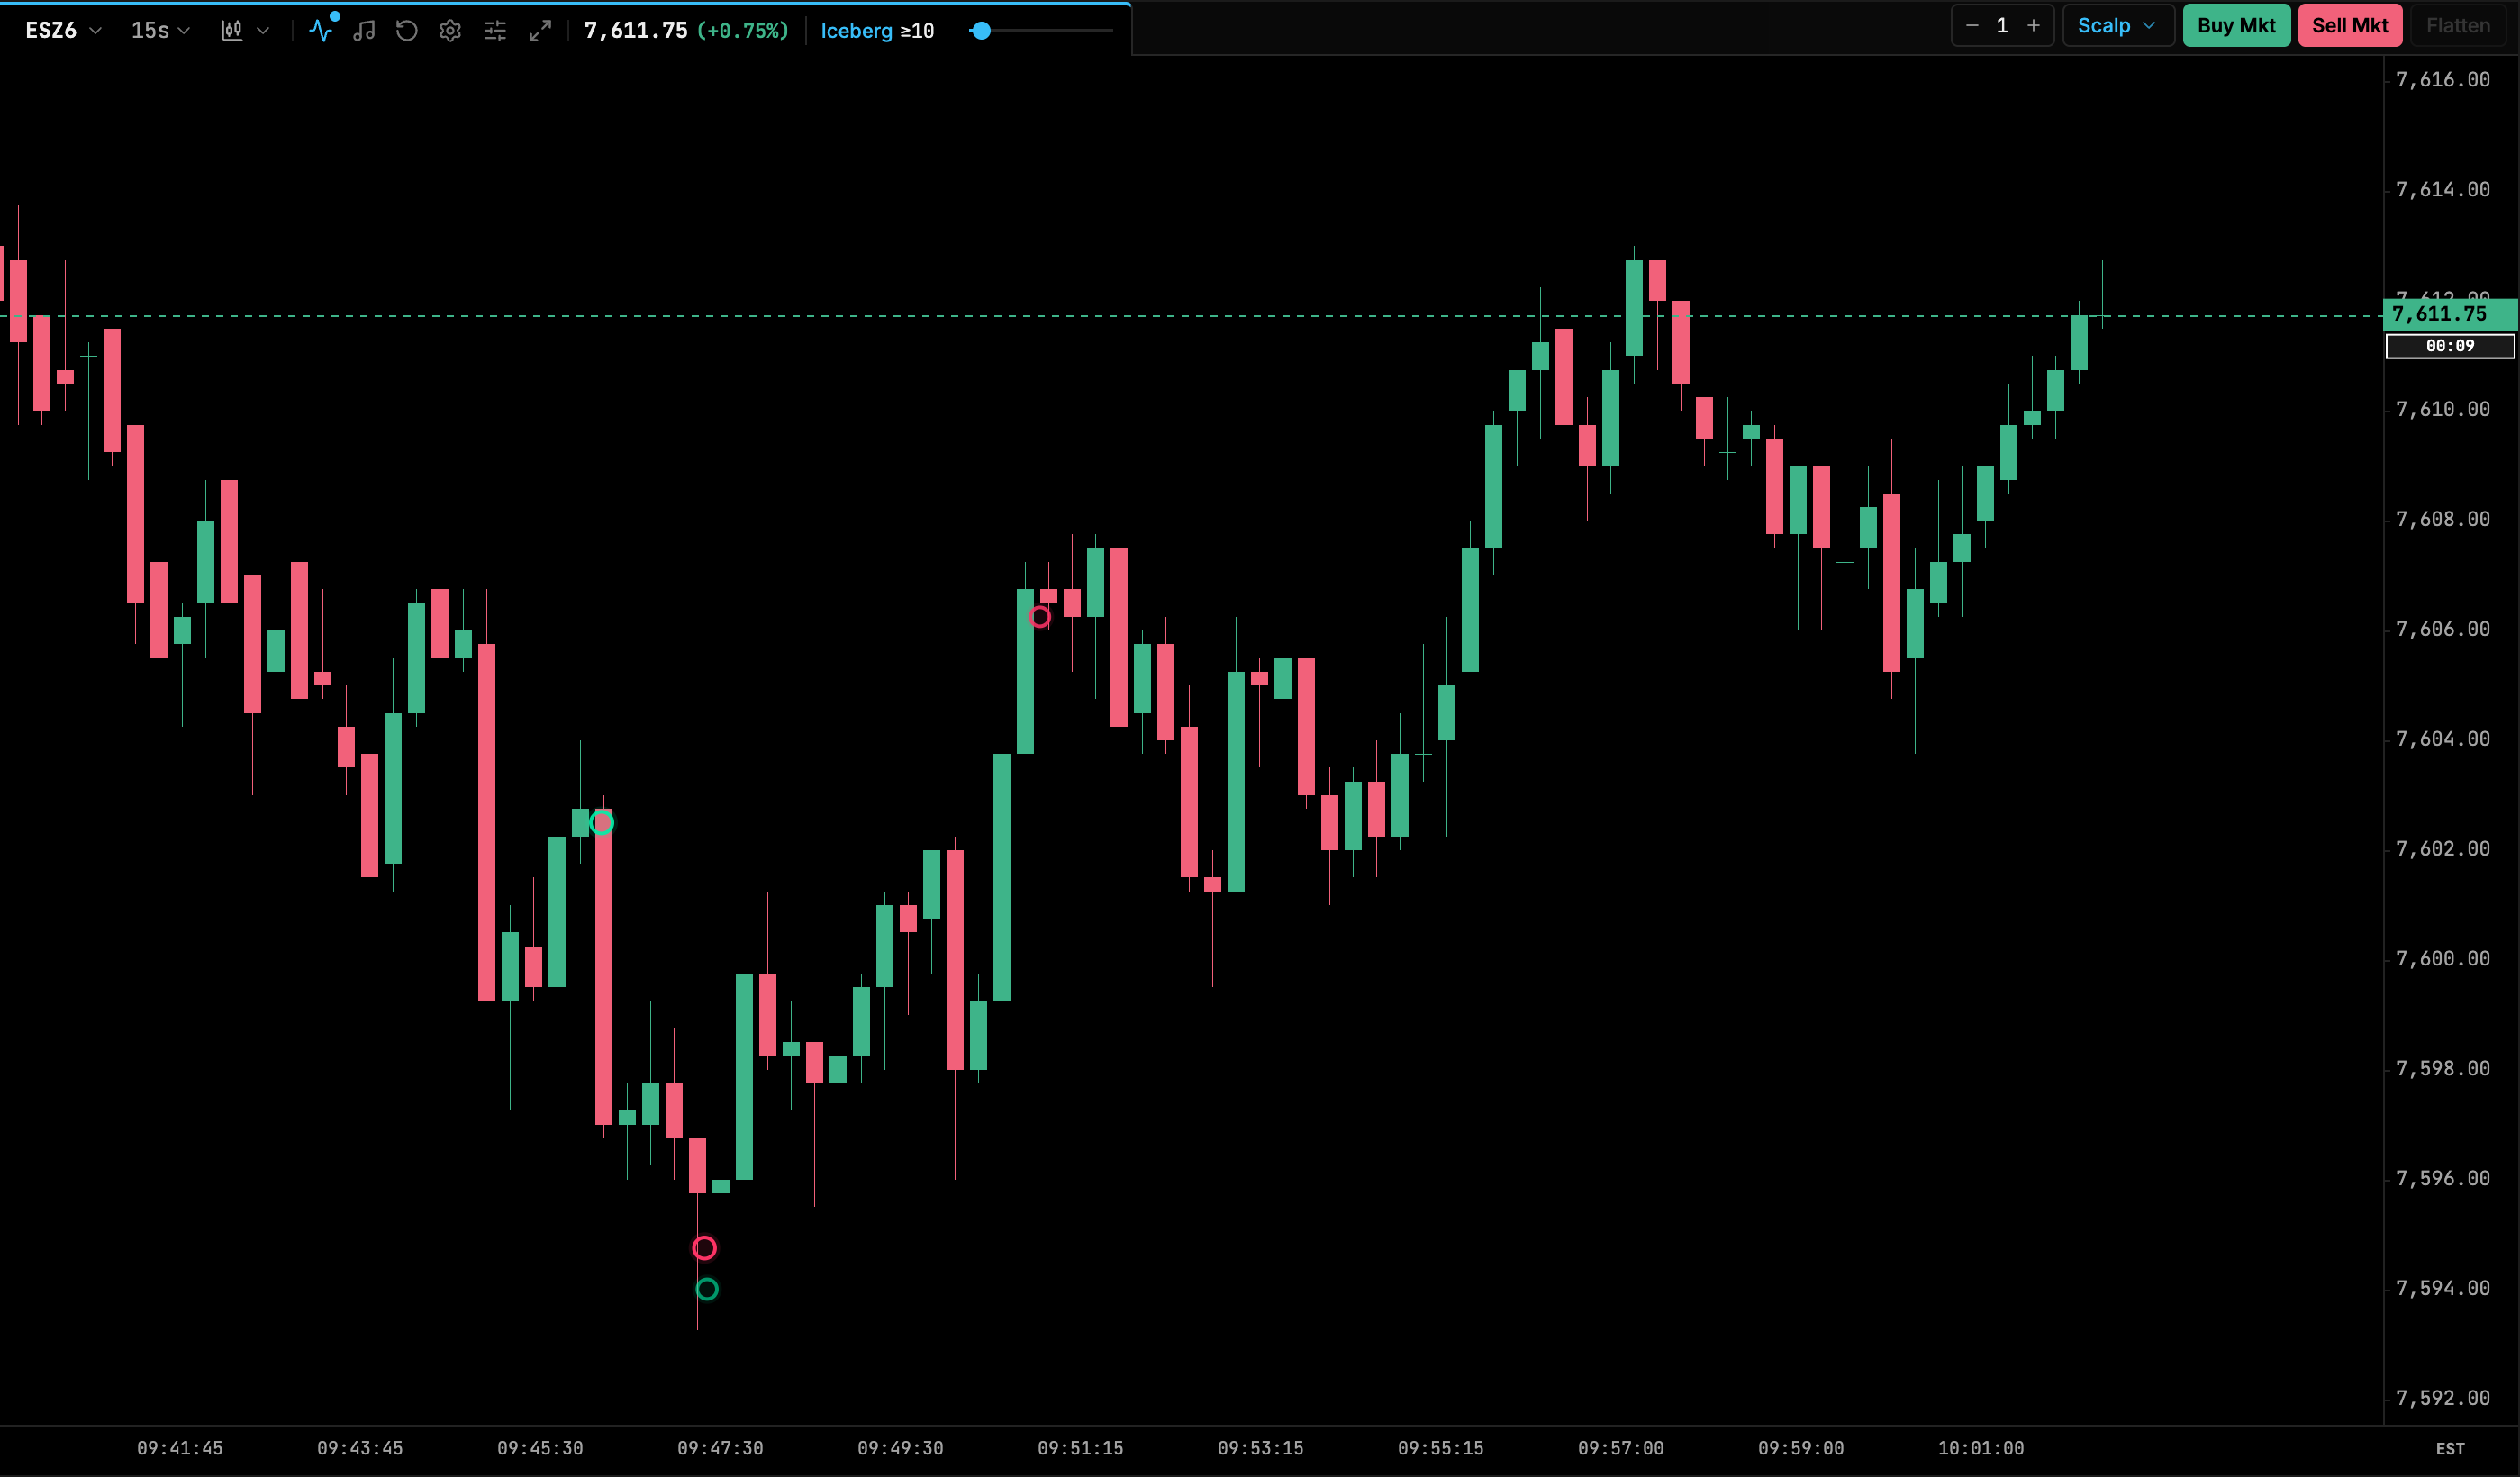
Detects hidden (iceberg) orders, meaning resting orders that keep refilling at a price after being traded against. Each defended price is drawn as a shelf that extends right until price breaks through. Passive buyers use the bull color and passive sellers the bear color. Hover a shelf or marker to see a HUD with executed, displayed and hidden size, reload count and time.
The preferred source is the gateway’s order-book detector, which tracks order IDs and provides confidence and reload counts (needs a Rithmic L2 feed). Without it, TickMint falls back to a heuristic in the app driven by Reload Ratio. Settings marked (L2) apply only to the gateway detector.
When an Iceberg instance is on the chart, an Iceberg control appears in the panel header. Click the label to turn the indicator on or off. Drag the slider to change Min Hidden Contracts. Its maximum is calibrated from the hidden volume detected (up to 1000).
| Setting | Default | Range / options | Notes |
|---|---|---|---|
| Display Mode | Markers + Shelves | Markers + Shelves, Shelves Only, Markers Only | |
| Show Hover HUD | on | on/off | |
| Min Hidden Contracts | 30 | 0–1000 (step 5) | Also set by the header slider. |
| Min Confidence (L2) | 0.5 | 0–1 | |
| Min Reloads (L2) | 1 | 0–20 | |
| Reload Ratio (fallback) | 2 | 1.2–10 (step 0.2) | Used only by the fallback detector. |
| Break Through (ticks) | 3 | 1–20 | Distance beyond the level that counts as a break. |
| Break Trigger | Bar Close Through | Bar Close Through, Wick (any trade through) | |
| Break Confirmation (bars) | 1 | 1–10 | |
| Retest Departure (ticks) | 4 | 1–40 | |
| Show Broken Levels | off | on/off | |
| End Shelf on Exhaustion (L2) | on | on/off | |
| Shelf Opacity | 0.3 | ||
| Marker Size | 6 | 3–15 | |
| Scale Markers by Hidden Volume | on | on/off | |
| Passive Buyer / Seller Color | theme bull / bear | color |