Chart Panel & Navigation
Every chart in TickMint is a chart panel: a canvas with its own instrument, bar type, candle style, indicators, drawings and trading controls. Panels in the same layout are independent, so you can run a 2000-tick footprint next to a 5-minute candlestick chart of the same contract.
The panel header

- Instrument: click to switch contract or search all instruments.
- Timeframe / bar type: time, tick, range, Renko-style and custom bars.
- Candle type: candlestick, Heikin-Ashi, OHLC, footprint, volume profile and more.
- Indicators: open the indicator picker for this panel.
- Audible tape: toggle trade sounds for this panel (a dot shows when it is on).
- Reset view: jump back to the live edge and refresh historical bars.
- Chart panel settings (gear).
- Trade Panel: show or hide the docked order ticket (Shift+T).
- Maximize the panel / restore the layout.
Change instrument
Click the symbol (1) to open the quick list. It shows the current front month of the most common roots (NQ, ES, RTY, YM, MNQ, MES, CL, GC) plus Search All….
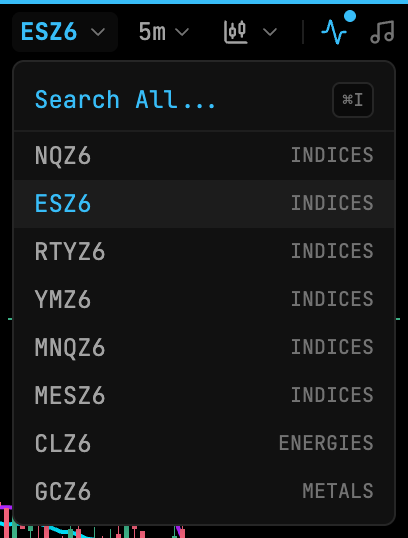
Search All… (Ctrl/⌘+I) opens the Select instrument & contract dialog. Type a symbol, root or name, filter by category, move with ↑/↓ and press Enter to load the contract.
When the broker reports a new front month for the root you are viewing, a rollover banner appears on the panel. See Contract Rollover.
Change timeframe
Click the timeframe (2) to open the periodicity menu. Presets are grouped by bar type; Custom… opens the bar editor where you can enter any value.
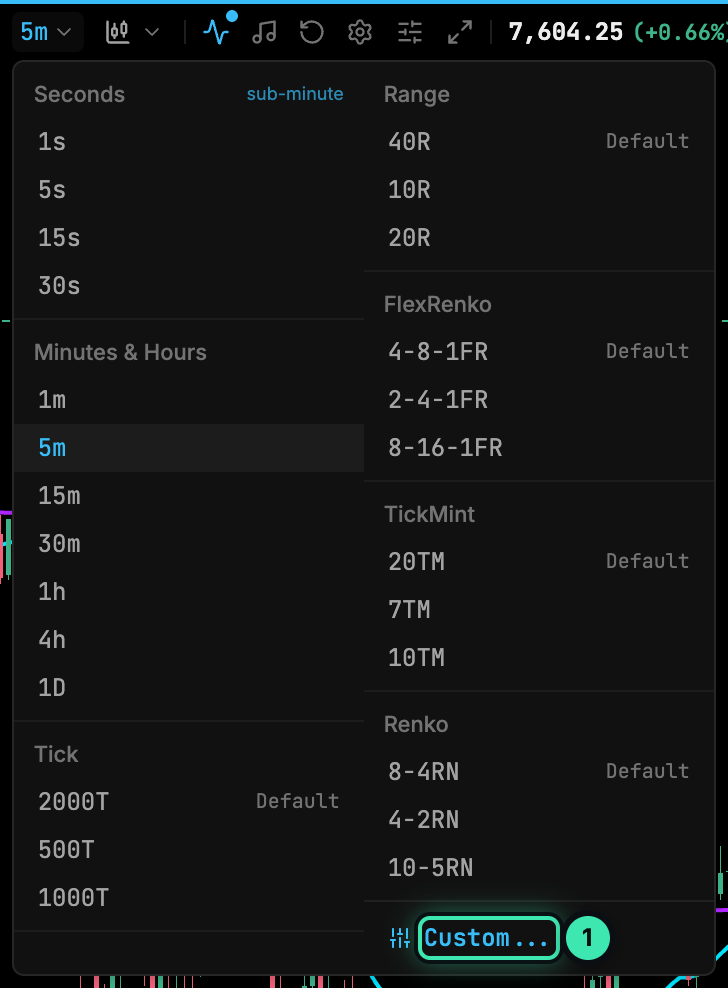
- Custom...: open the bar periodicity editor.
All bar types and their parameters are described in Bar Types.
Change candle type
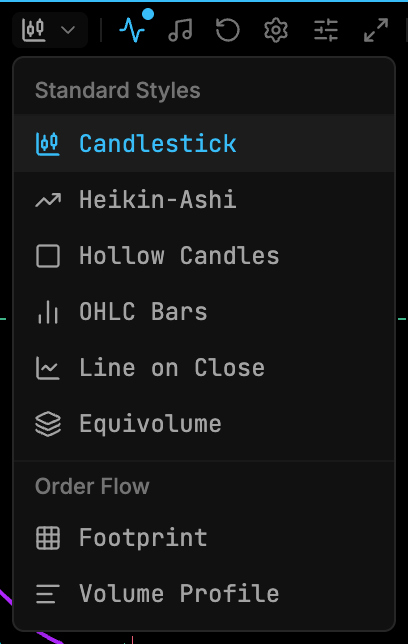
The candle-type menu (3) switches how bars are drawn without changing the bar periodicity:
| Group | Styles |
|---|---|
| Standard styles | Candlestick, Heikin-Ashi, Hollow Candles, OHLC Bars, Line on Close, Equivolume |
| Order flow | Footprint, Volume Profile |
Footprint is covered in Order Flow Footprint.
Pan, zoom and reset
The chart is drawn on a canvas and responds to the mouse and trackpad as follows.
| Action | Where | Result |
|---|---|---|
| Mouse wheel | Plot area | Zoom time (bar spacing) |
| Shift+wheel, or horizontal trackpad scroll | Plot area | Pan through time |
| Mouse wheel | Price axis | Zoom price |
| Mouse wheel | Time axis | Zoom time |
| Mouse wheel | Axis corner | Zoom price and time |
| Alt+wheel | Footprint chart | Step ticks per row (switches from Auto to a fixed size) |
| Drag | Plot area | Pan through time; moving vertically also pans the price scale |
| Drag | Price axis | Stretch / compress price |
| Drag | Time axis | Stretch / compress time |
| Drag | Axis corner | Both at once |
| Double-click | Price axis | Reset the price scale (auto-scale) |
| Double-click | Time axis | Reset the time scale |
| Double-click | Plot area | Reset the whole view |
To get back to the latest bar at any time, click Reset view (6) in the header. It also reloads historical bars.
Keys on the chart
| Key | Action |
|---|---|
| Delete / Backspace | Delete the selected drawing |
| Esc | Cancel an order drag (the order stays where it was), an unfinished drawing, or the current selection |
| Shift+T | Show / hide the Trade Panel |
| Drawing hotkeys | See Drawing Tools |
Chart keys are ignored while the cursor is in a text field. The full list is in Keyboard Shortcuts.
Right-click menu
Right-click the plot to open the order menu at that price. It offers the order types that make sense at that level (for example Buy Limit and Sell Stop below the market) and a Show executions / Hide executions toggle for trade markers.
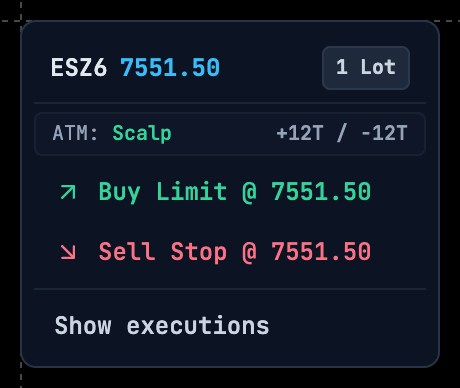
Details are in Chart Trading.
Chart panel settings
Click the gear (7) to open Chart panel settings. Changes apply to this panel only. The footer has Reset to defaults, Apply to all panels, Cancel and Save changes.
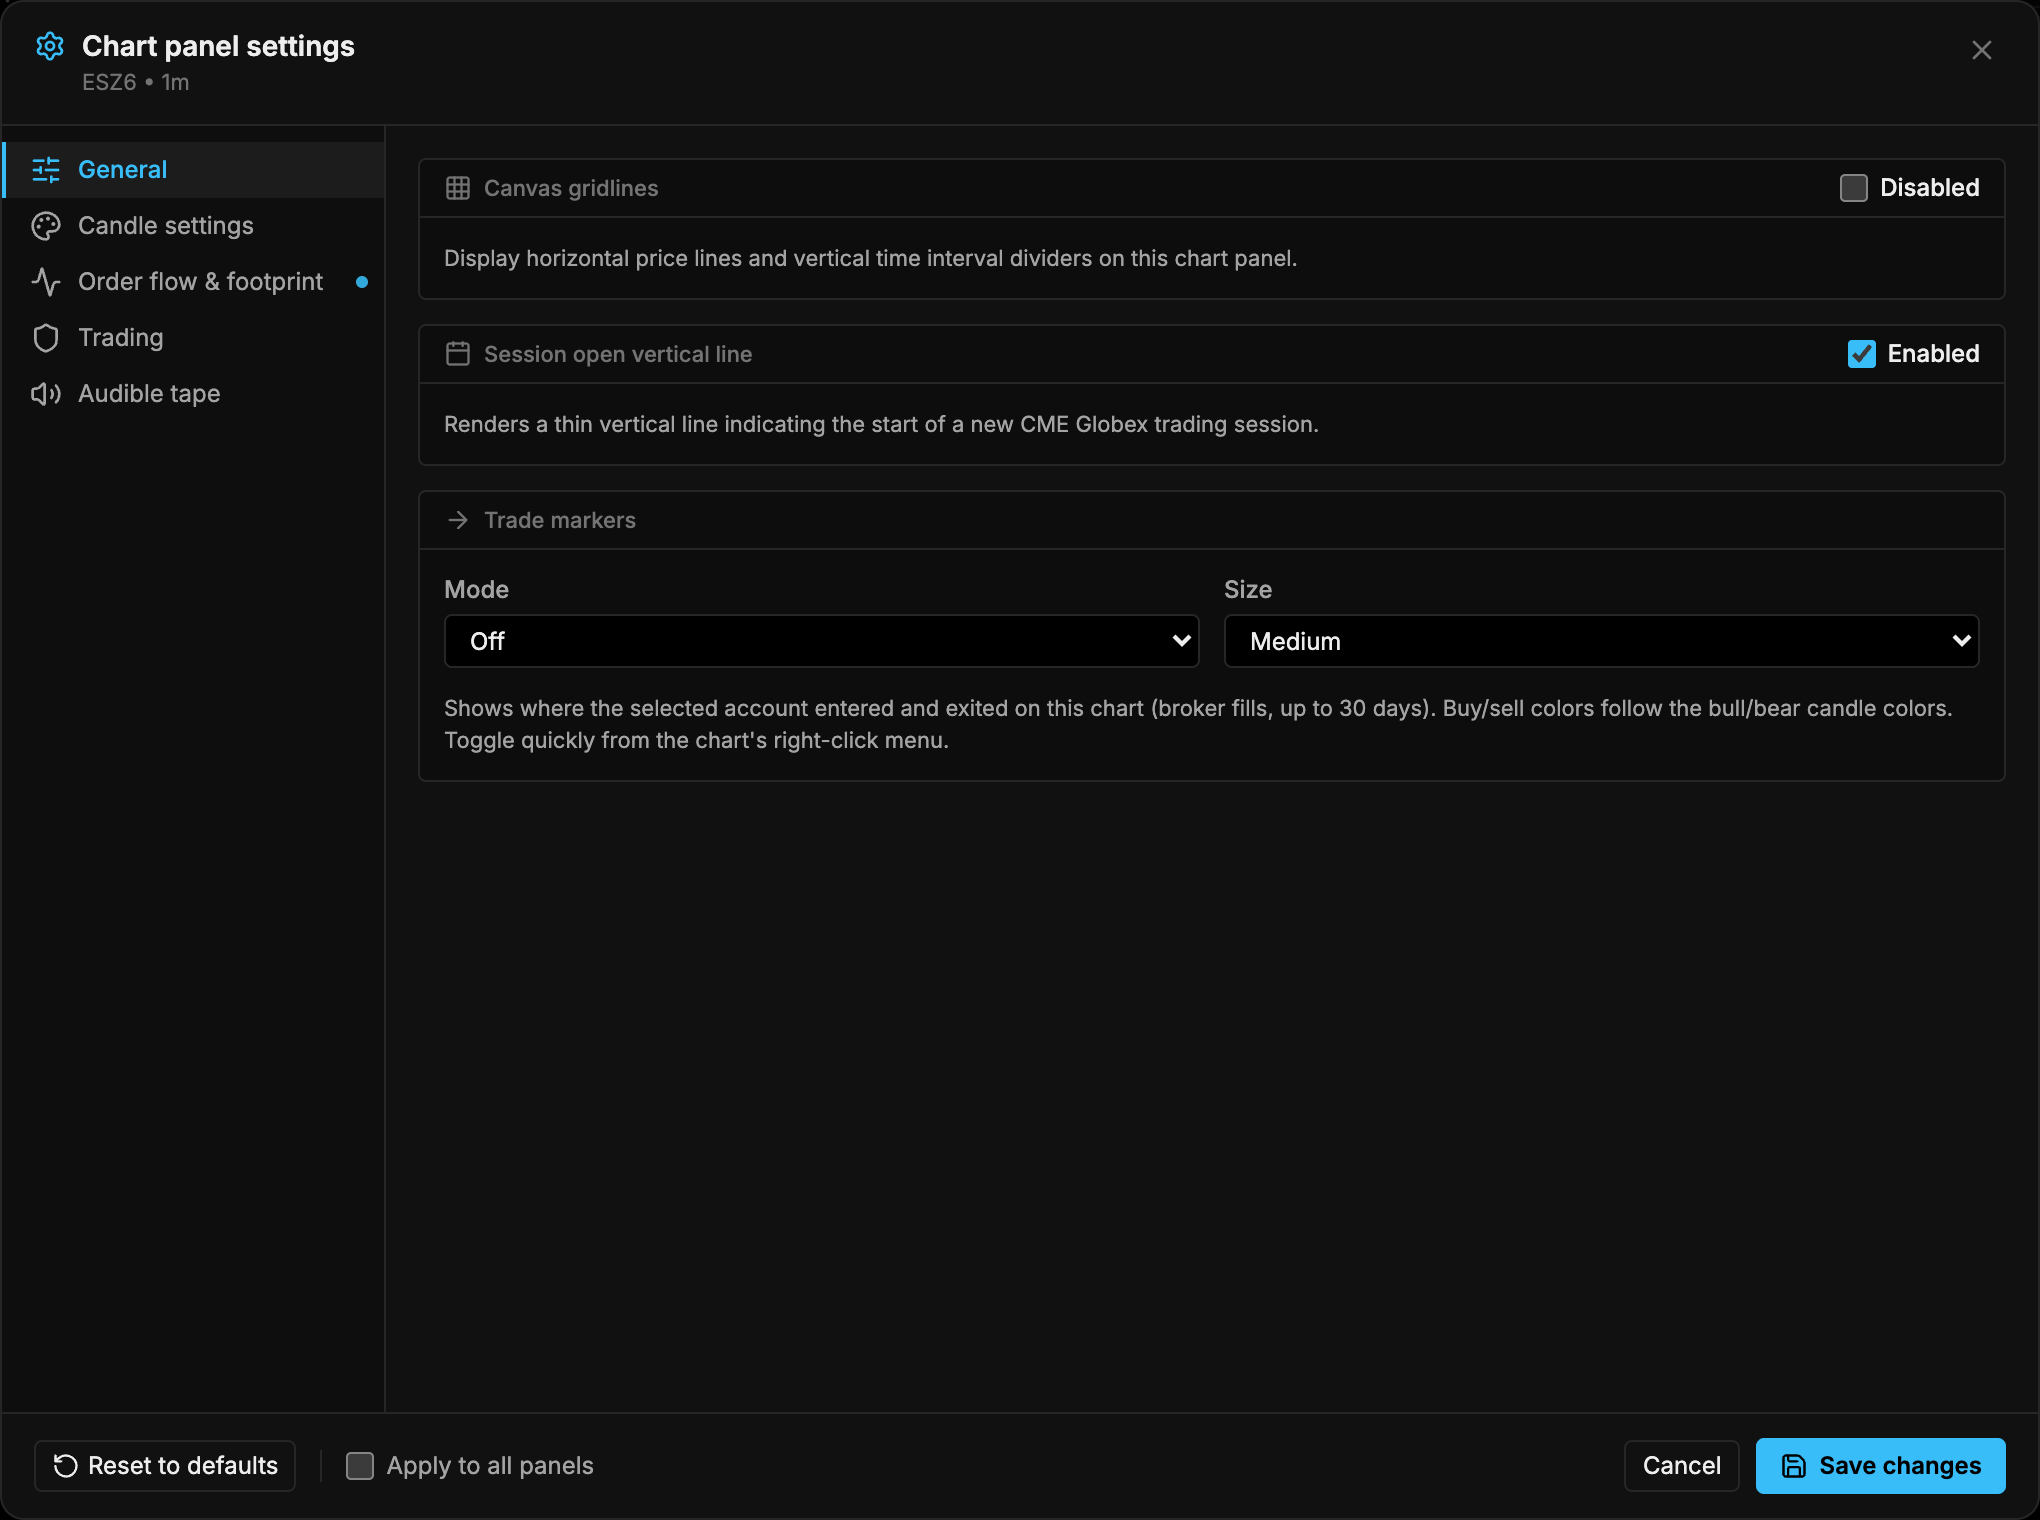
| Setting | Options | Notes |
|---|---|---|
| Canvas gridlines | On / off | When on: Gridline style (Dashed / Solid) and Grid color (or Theme default) |
| Session open vertical line | On / off | Marks each CME Globex session start |
| Trade markers: Mode | Off, Markers, Markers + lines, Markers + lines + labels | Plots your broker fills (up to 30 days). Hidden while Analysis only is on |
| Trade markers: Size | Small, Medium, Large |
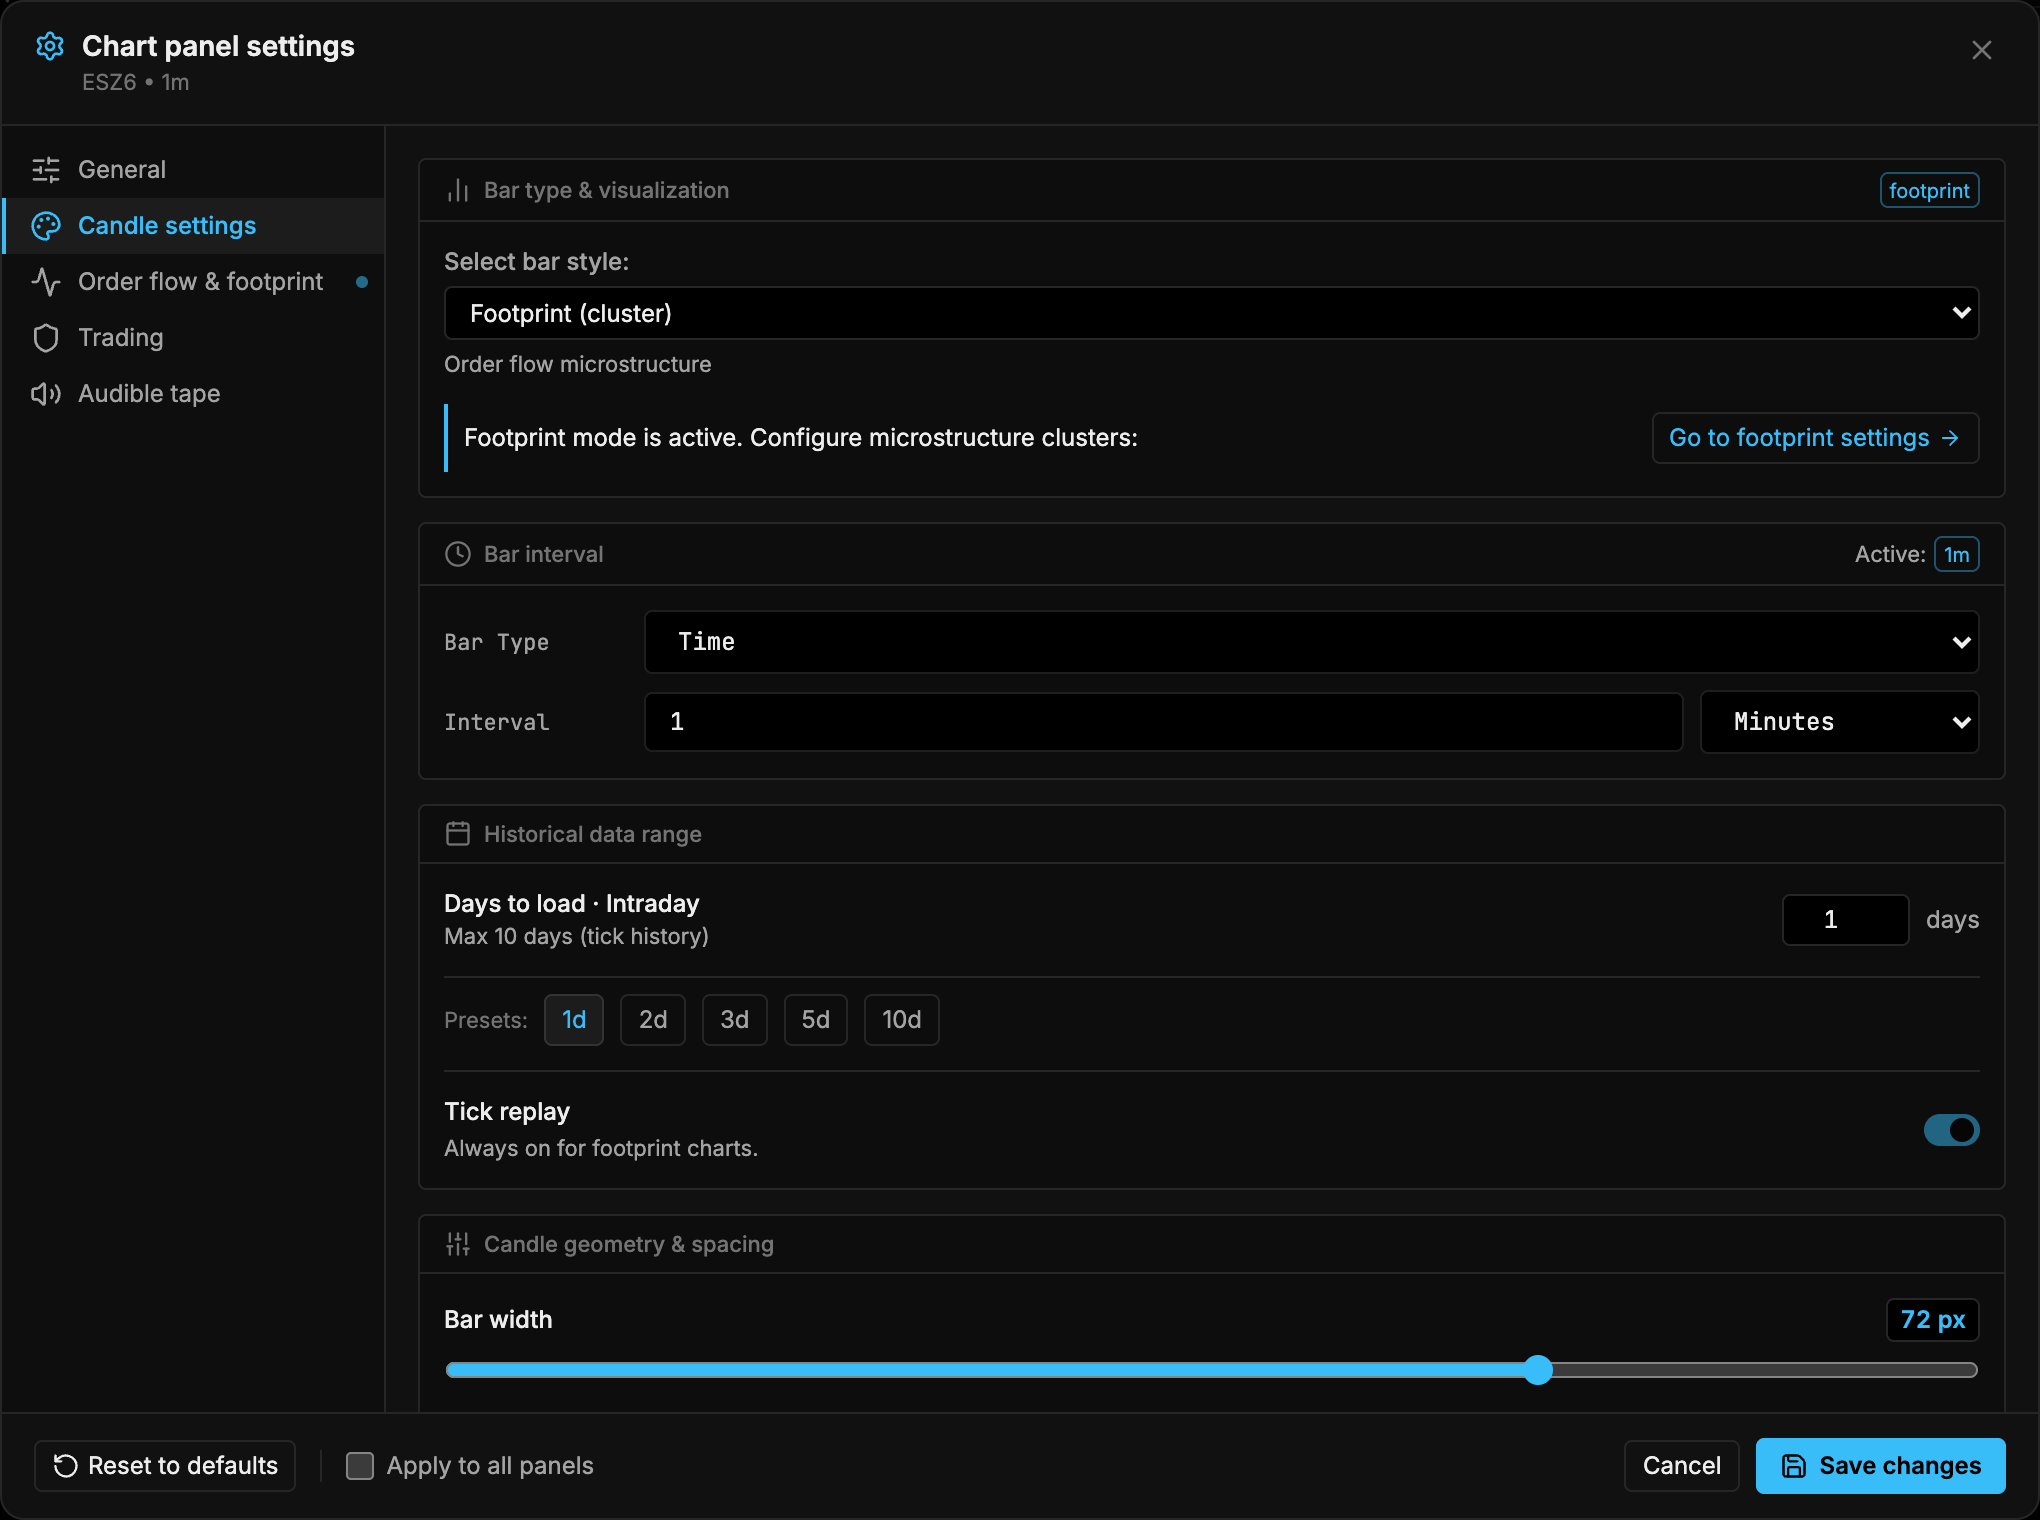
| Setting | Default | Notes |
|---|---|---|
| Bar style | Candlestick | Same list as the candle-type menu. With Footprint selected, Go to footprint settings jumps to the footprint tab |
| Bar Type / Interval | Current timeframe | Same options as the timeframe menu |
| Days to load: Intraday | 3 (max 30) | Presets 1, 2, 3, 5, 10, 15, 30 |
| Days to load: Hourly | 90 (max 365) | |
| Days to load: Daily | 365 (max 1825) | |
| Tick replay | Off | Backfills tick-by-tick trades (max 10 days). Always on for footprint; intraday only |
| Bar width | 3 px (1–100) | 35–65 px is recommended for volume profile and footprint |
| Bar spacing | 1 px (0–40) | |
| Candle coloring & opacity | Theme | Bullish / bearish body color and opacity (0–1), border and wick colors |
| Current price line | Theme | Line & badge color, width 1–4 |
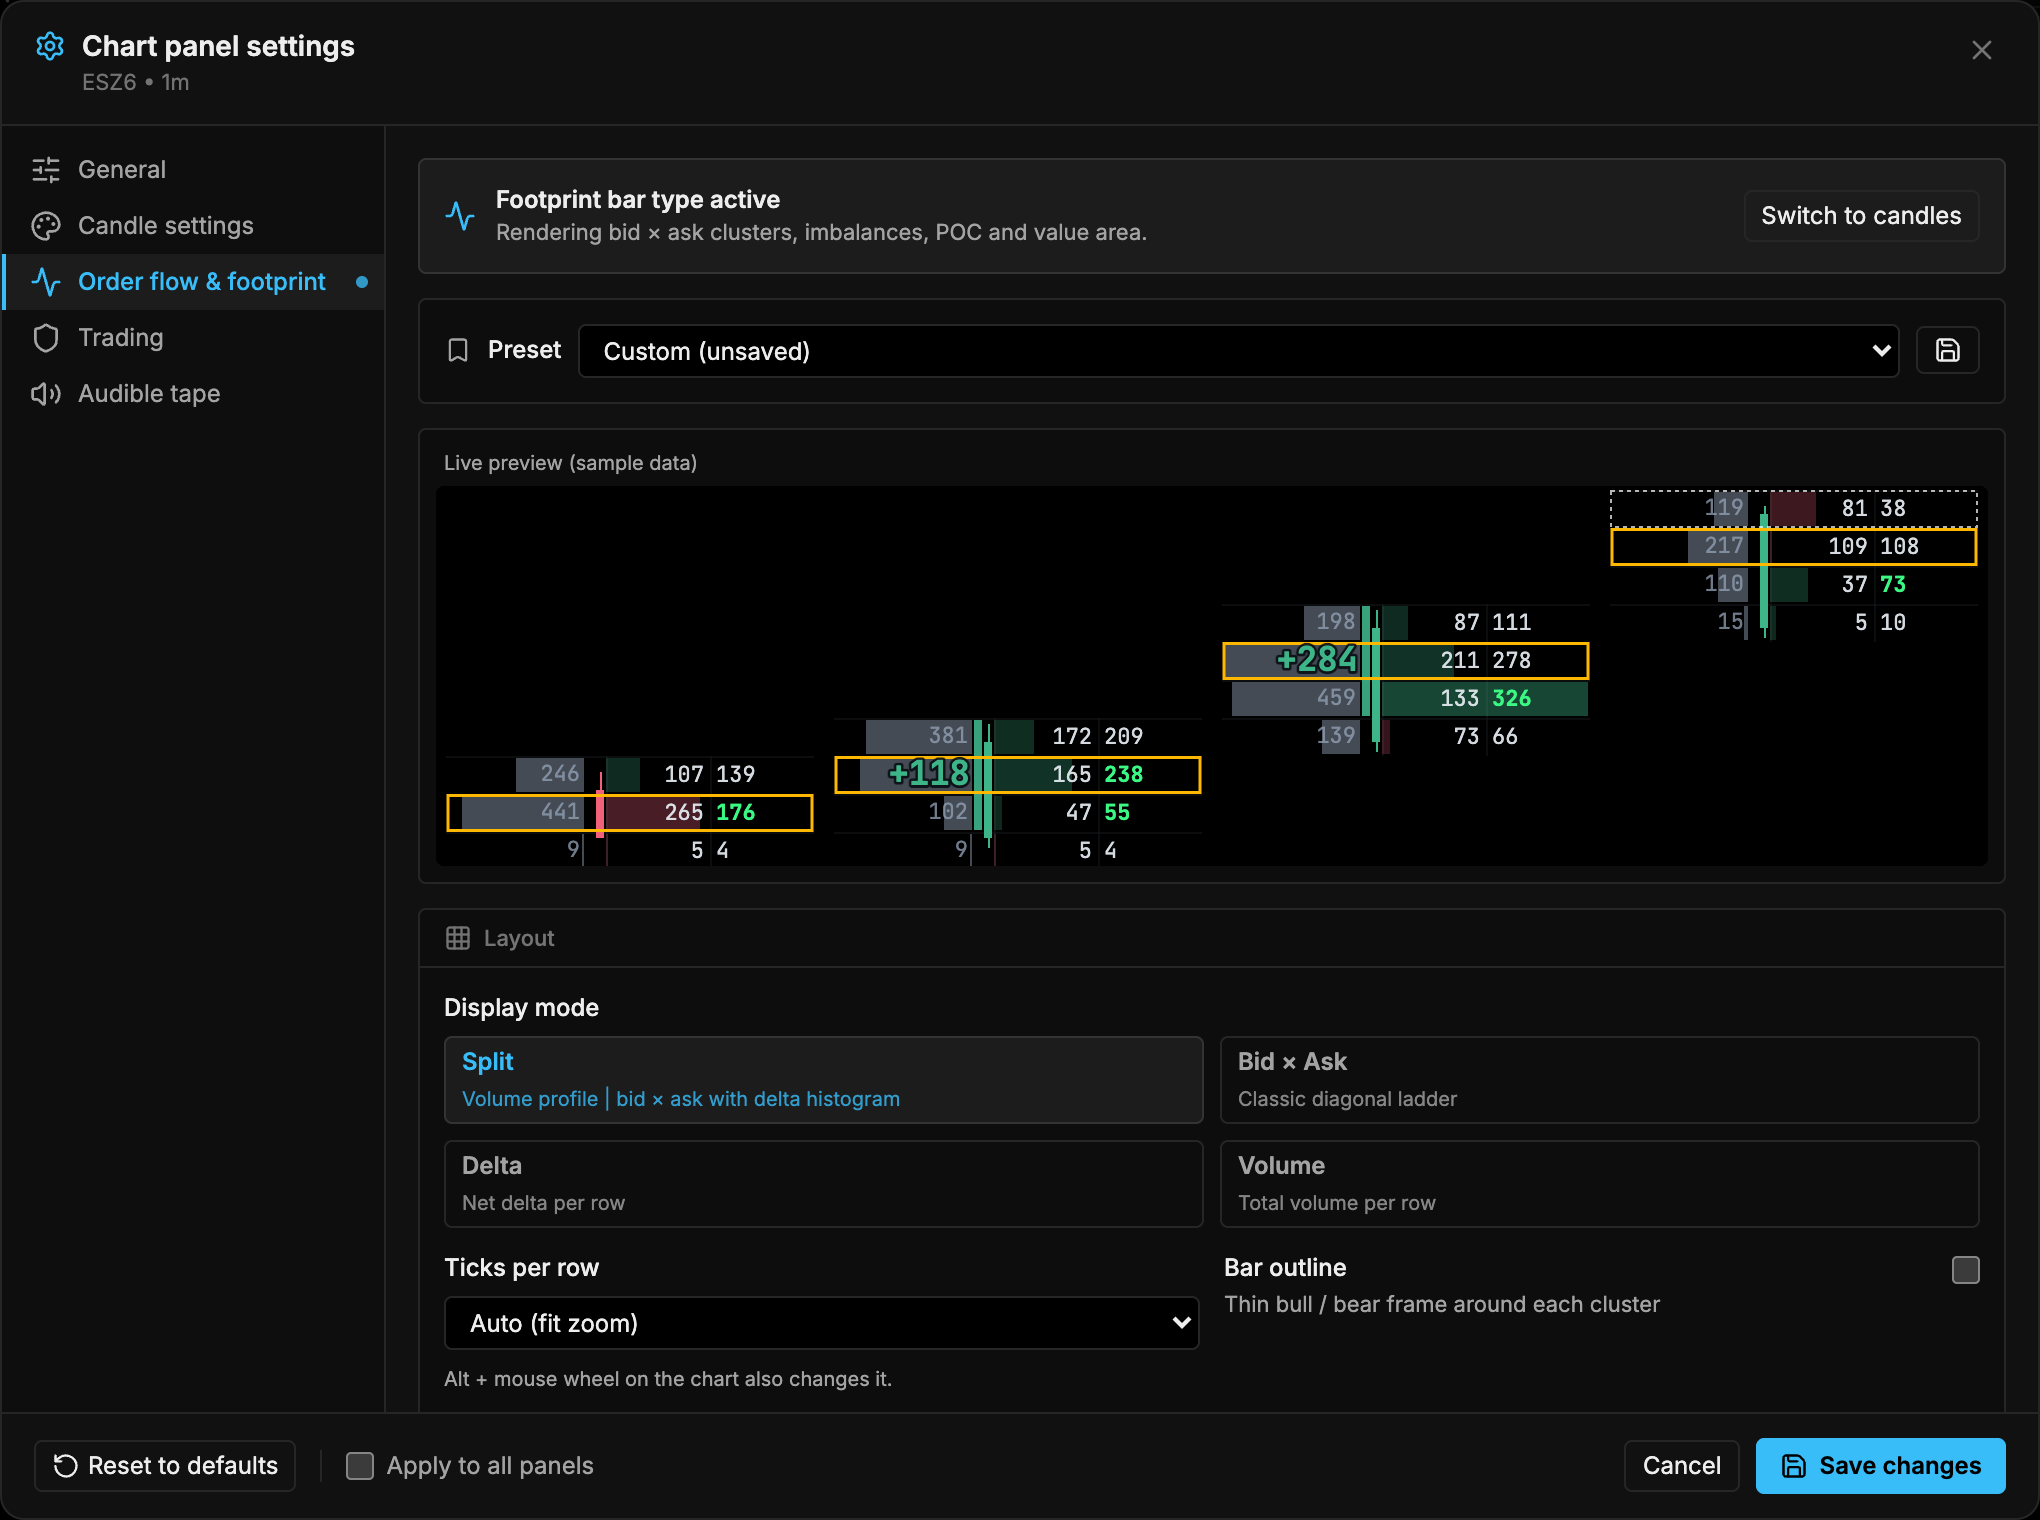
See Order Flow Footprint for every option on this tab.
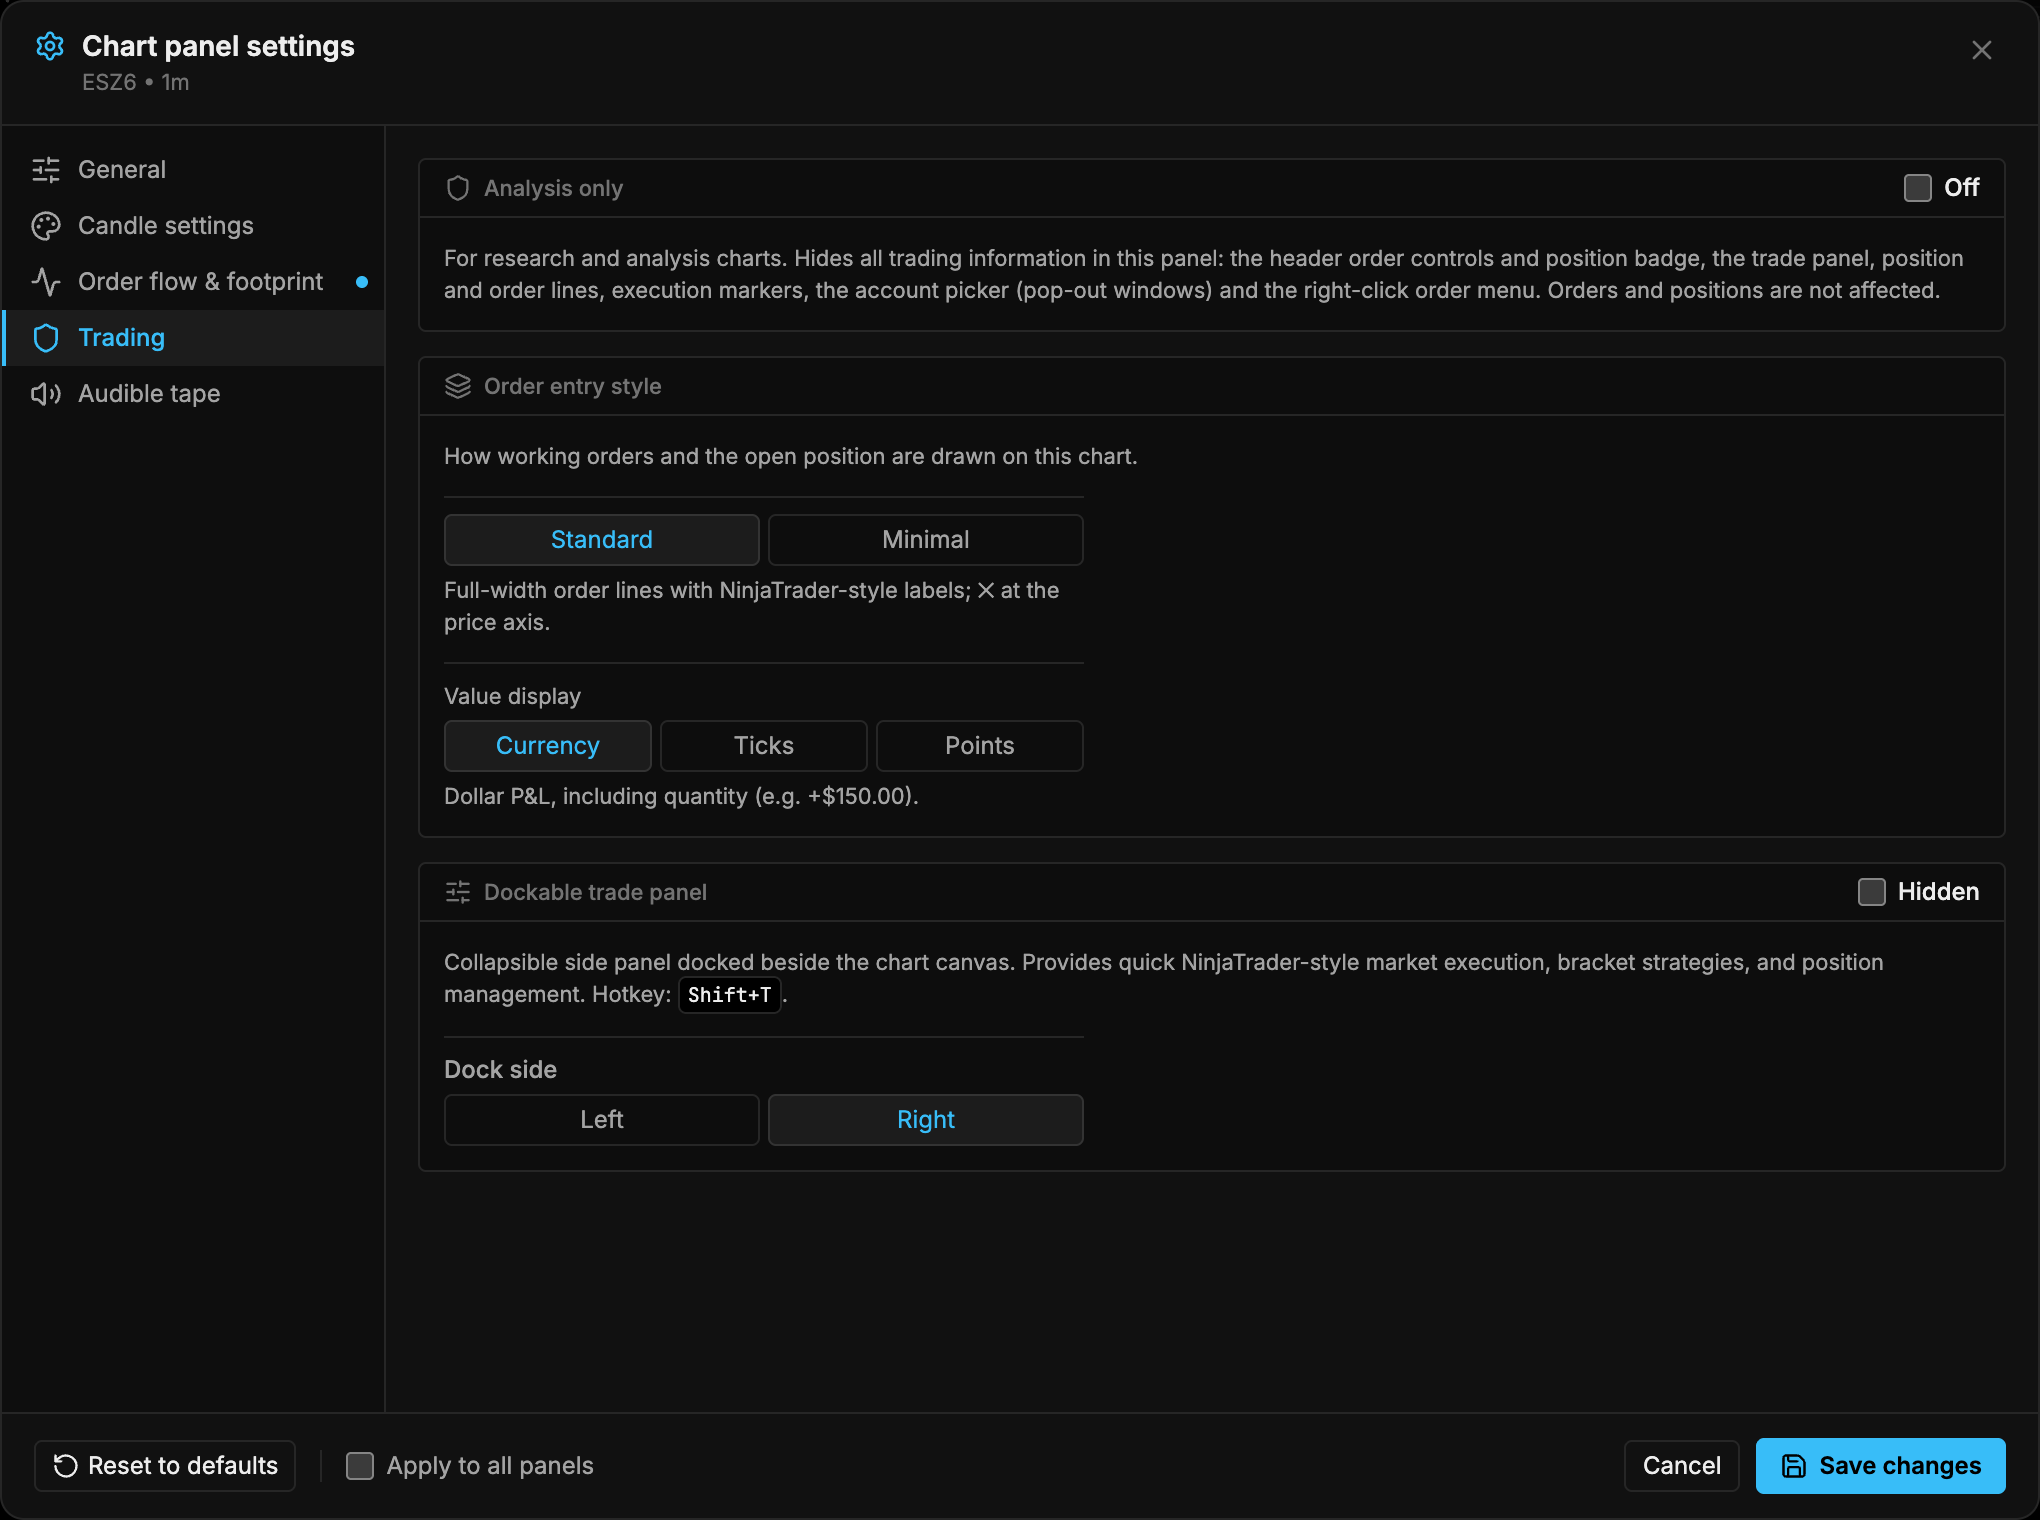
| Setting | Notes |
|---|---|
| Analysis only | Off by default. For research and analysis charts. Turning it on hides all trading information in this panel: the header order controls and position badge, the trade panel, position and order lines, execution markers, the pop-out window account picker and the right-click order menu. Orders and positions aren’t affected, and the trading settings below are kept for when you turn it off |
| Order entry style | Standard (default) or Minimal. Controls how working orders and the position are drawn on this panel. See below |
| Value display | Currency (default), Ticks or Points. The unit for order and position values in both styles: +$150.00, +12 or +3.00. Currency includes quantity; Ticks and Points are per contract |
| Dockable trade panel | Show or hide the Trade Panel (Shift+T) and choose the Dock side (Left / Right) |
Order entry style: Standard vs Minimal
| Standard | Minimal | |
|---|---|---|
| Layout | NinjaTrader-style: a coloured label about 40% of the way across the chart, with a solid line from its arrow to a × box and a coloured arrow tag on the price axis. Nothing is drawn left of the label | A compact tag on the right, next to the price axis. No line across the chart. A short thin line joins each tag to a coloured price tag on the axis |
| Order label | Quantity, side, type and the value if that order fills, such as 1 Sell LMT +$150.00. Take-profits are green and stops red |
Segments: ×, quantity, role (TP, SL, BUY LMT…) and the value if that order fills, such as × 1 TP +$150.00 |
| Position | Neutral line at the average price with an open-value box and a size box (green long, red short; -1 for short) |
Tag with ×, signed size (-1 for short) and open value |
| Modify an order | Drag the label, or the line right of it | Drag the tag |
| × on an order | The × box by the price axis cancels that order | Cancels that order |
| × on the position | No × on the position | Flattens the symbol right away, with no confirmation (same as Flatten) |
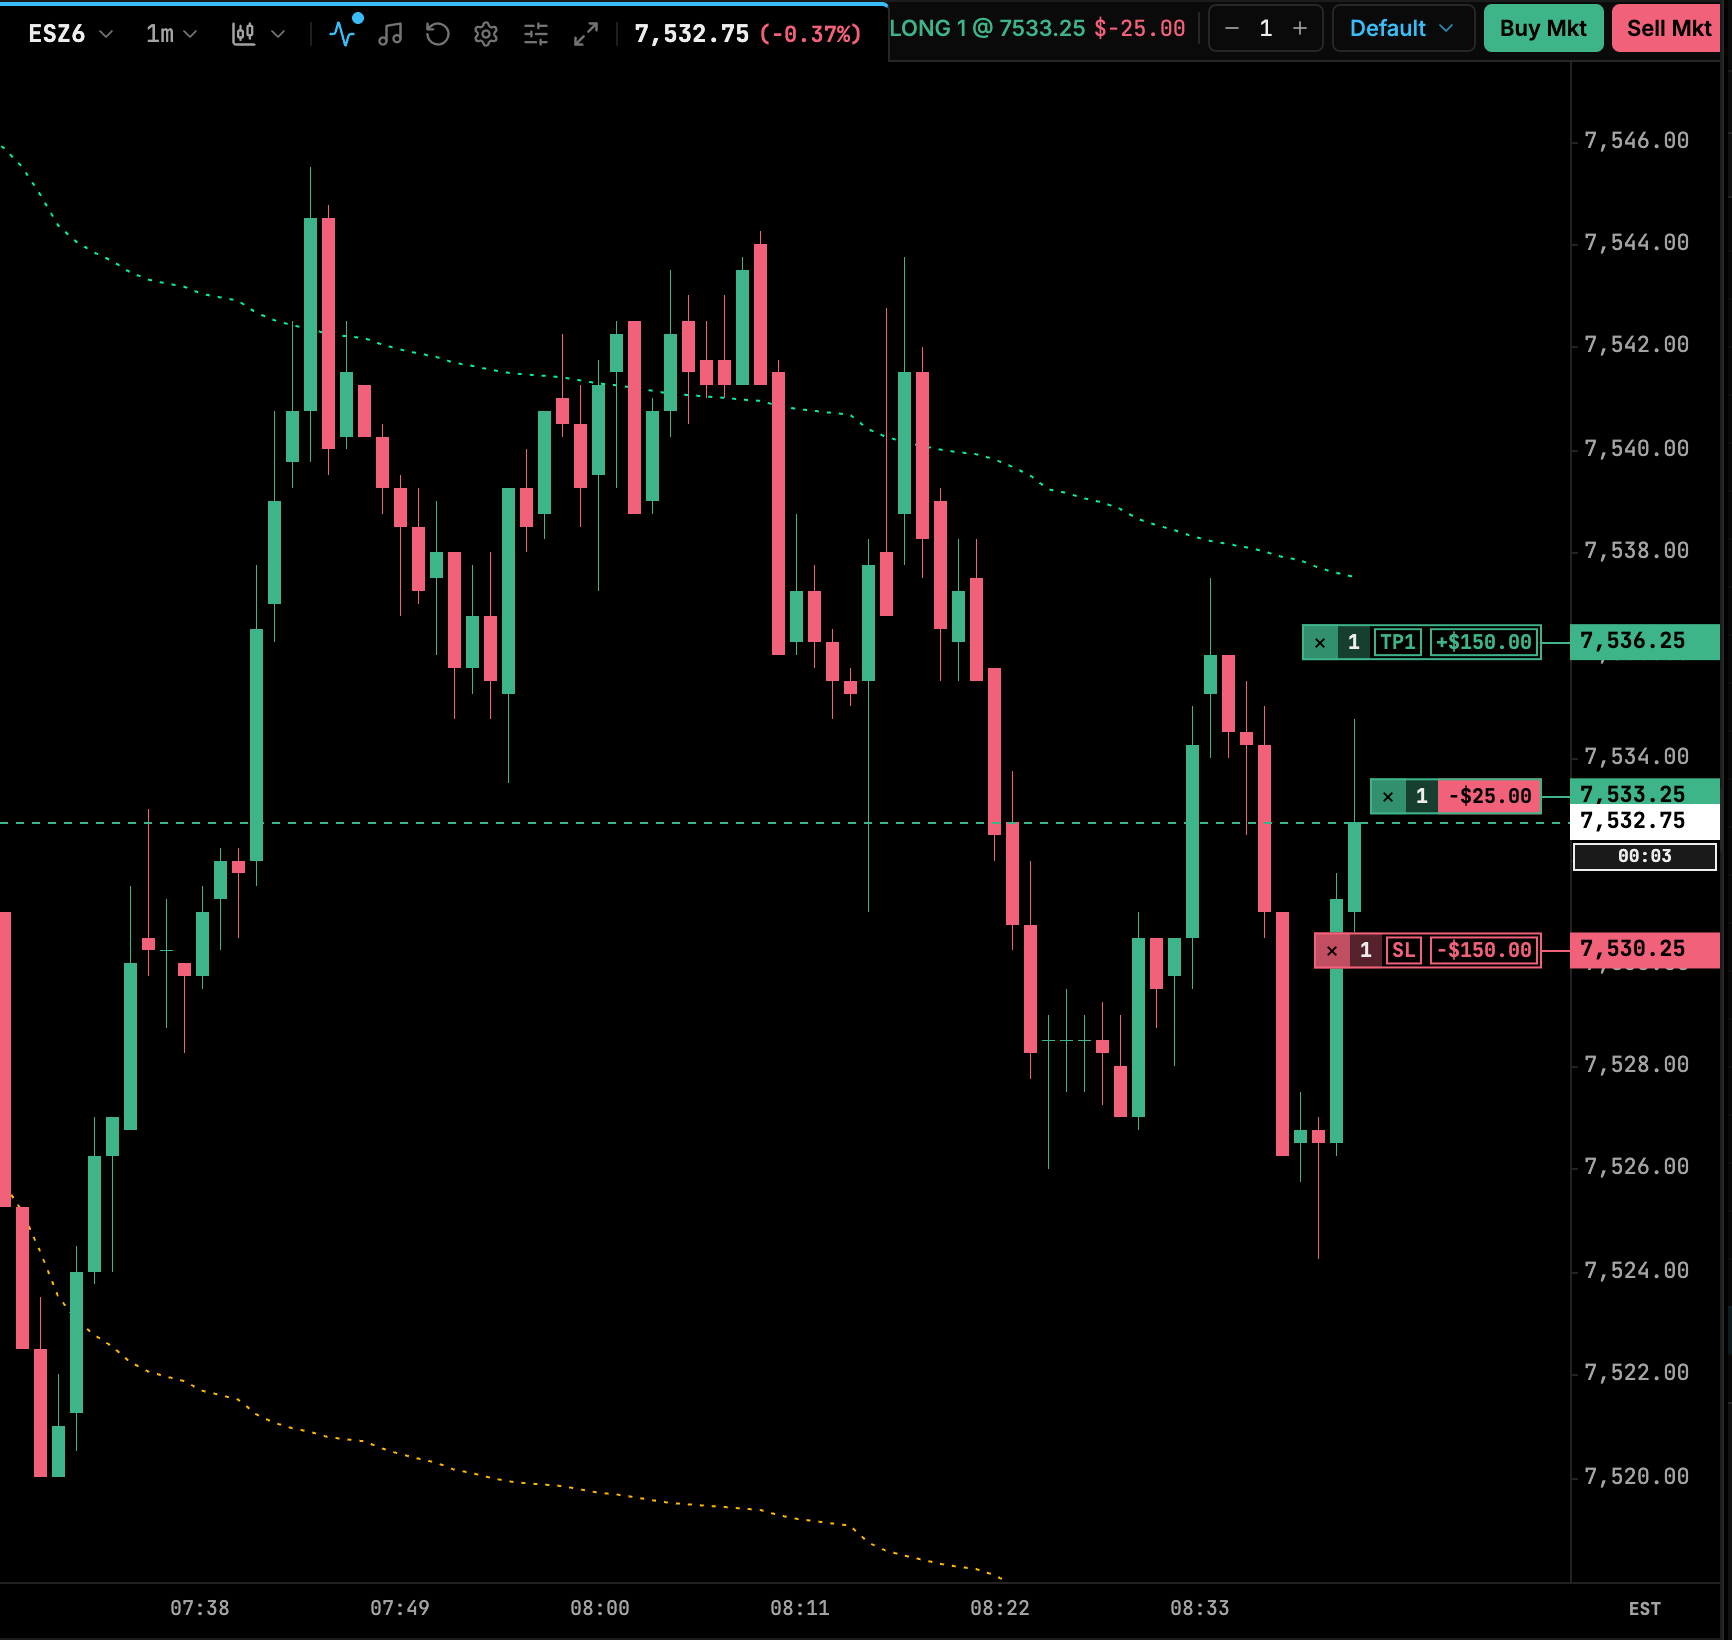
Both styles use the colours of your workstation theme. Switching style changes only how orders are drawn and clicked, not how they’re placed or managed. The change previews live on the chart and is saved per panel; use Apply to all panels to set it everywhere.
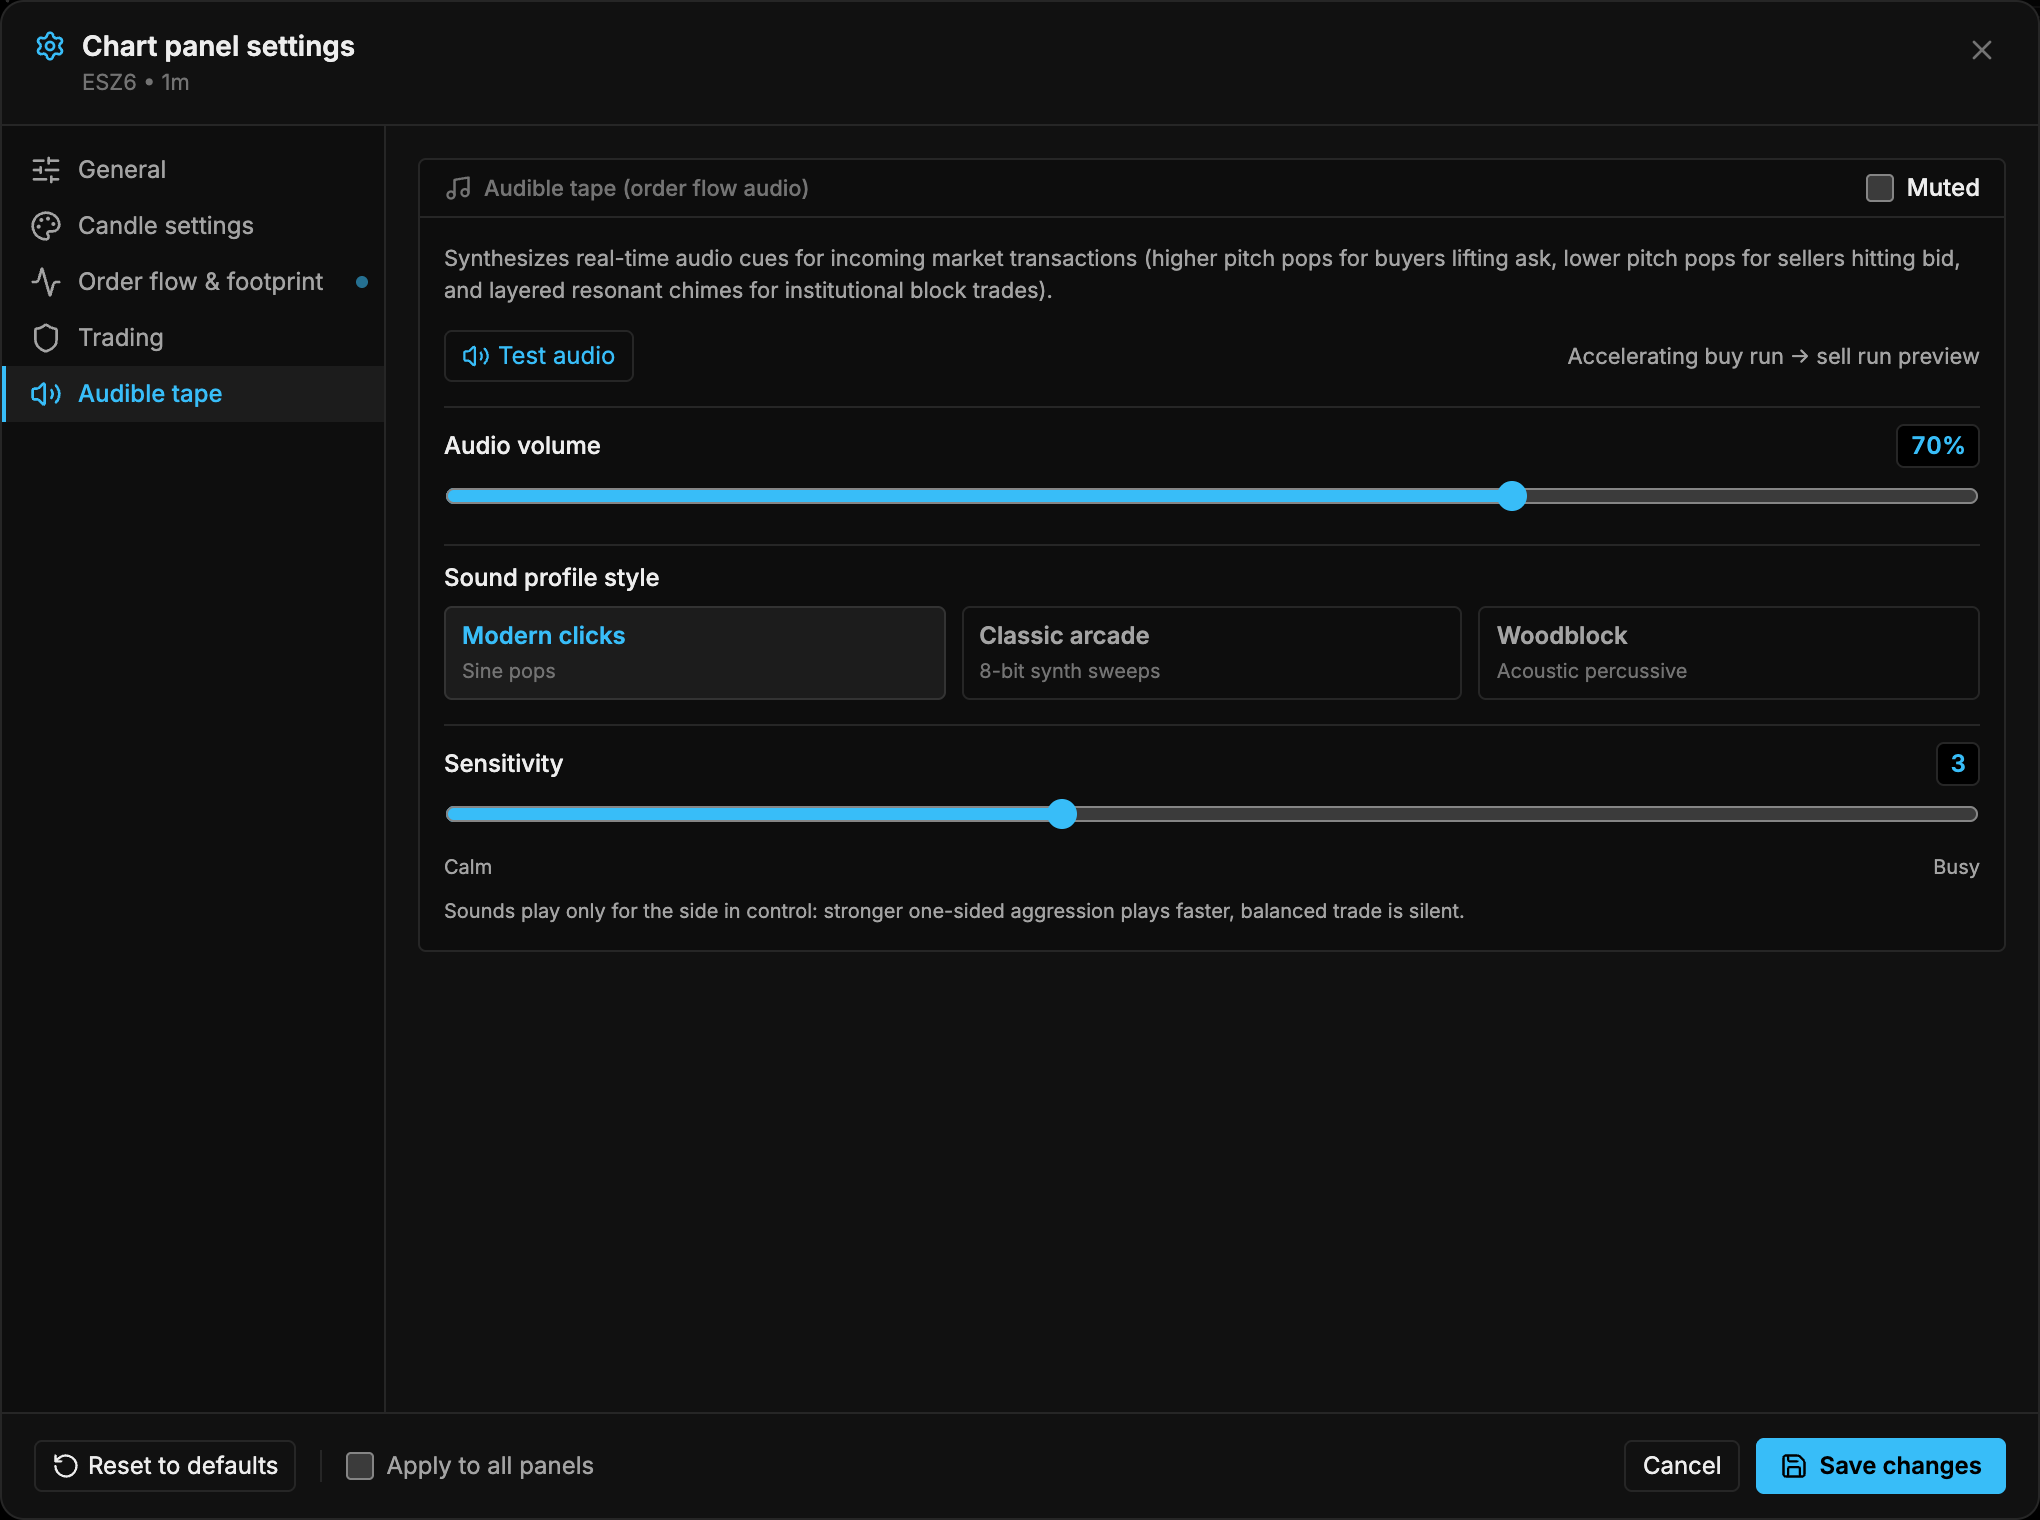
See Audible Tape.
Trade video clipping
Record a short video clip of an active trade directly from any chart panel’s canvas—capturing candles, footprint, heatmap, indicators, drawings, and live position/P&L overlays without window chrome or OS screen-recording permissions.
- Manual recording: Click the Record (camera) icon in the panel header to start recording anytime, and click the red REC timer pill to stop.
- Auto-record active trades: Open Chart panel settings → General → Trade video clipping (off by default per panel). When enabled, recording starts automatically when a position opens and continues for 3 seconds after you flatten so the exit fill and reaction are captured. You can also set the frame rate (30 FPS or 60 FPS) and max clip length (2, 5, or 10 minutes).
- Export & review: When a clip finishes, a Clip Ready tray appears in the bottom-left corner of the chart (keeping up to 3 recent unsaved clips per panel) with Preview, Save (
.mp4or.webmto disk), Journal (attaches the clip to the matching trade or day in Trades & Review), and Discard.