Trades & Review
Use the Trades view to find trades, the trade detail page to review them one by one, and the Calendar and Daily Journal to reflect on each session.
The Trades view
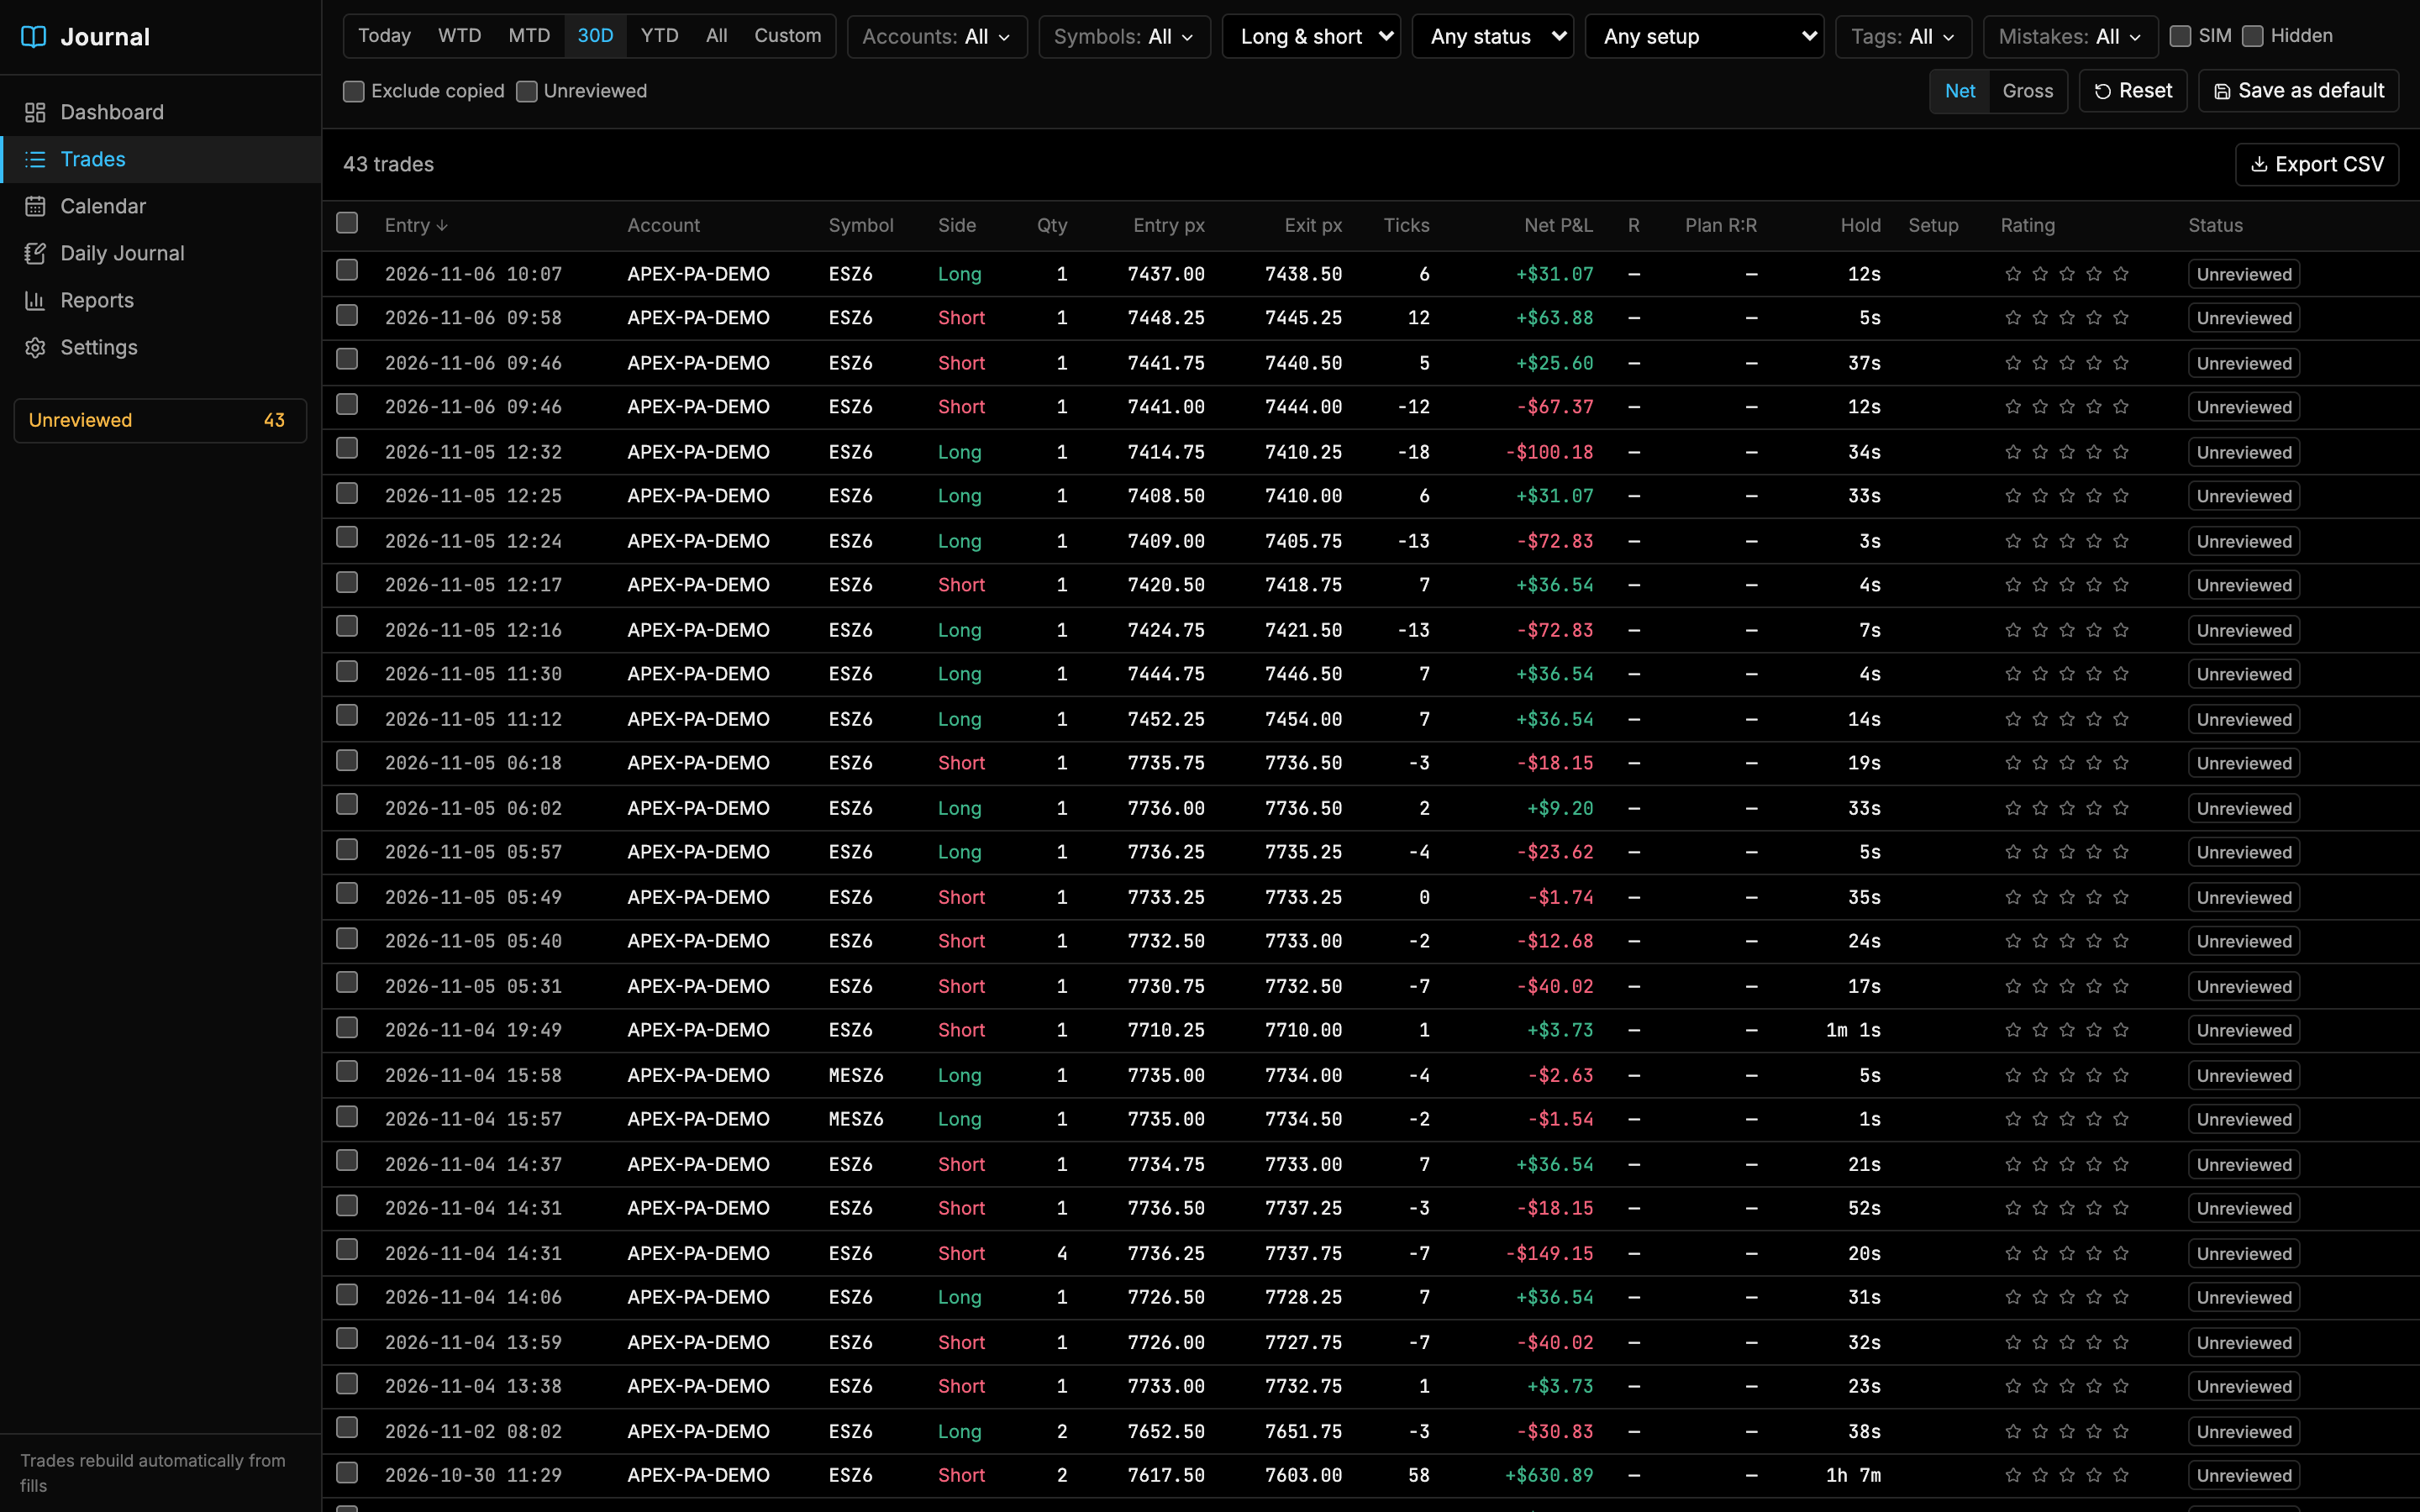
Trades are listed newest first, 100 per page. Click any column header to sort.
| Column | Meaning |
|---|---|
| Entry | Time of the first fill |
| Account, Symbol, Side, Qty | Account, contract, Long/Short and maximum position size |
| Entry px / Exit px | Average entry and exit prices |
| Ticks | Result in ticks |
| Net P&L | Net or gross, following the Net / Gross switch |
| R | Result as a multiple of the planned stop |
| Plan R:R | Planned reward-to-risk |
| Hold | Time in the trade |
| Setup, Rating | Your review fields |
| Status | Unreviewed, Reviewed, Open or Incomplete |
Bulk actions
Tick the checkboxes to select trades, then choose Mark reviewed, Hide, Set setup… or Add tag…. Hidden trades are excluded from all stats unless Hidden is ticked in the filter bar.
Export CSV downloads the filtered trades. See Reports & export.
If no trades match, the empty state offers Sync from Rithmic to pull your order history.
Review a trade
Click a trade to open its detail page.
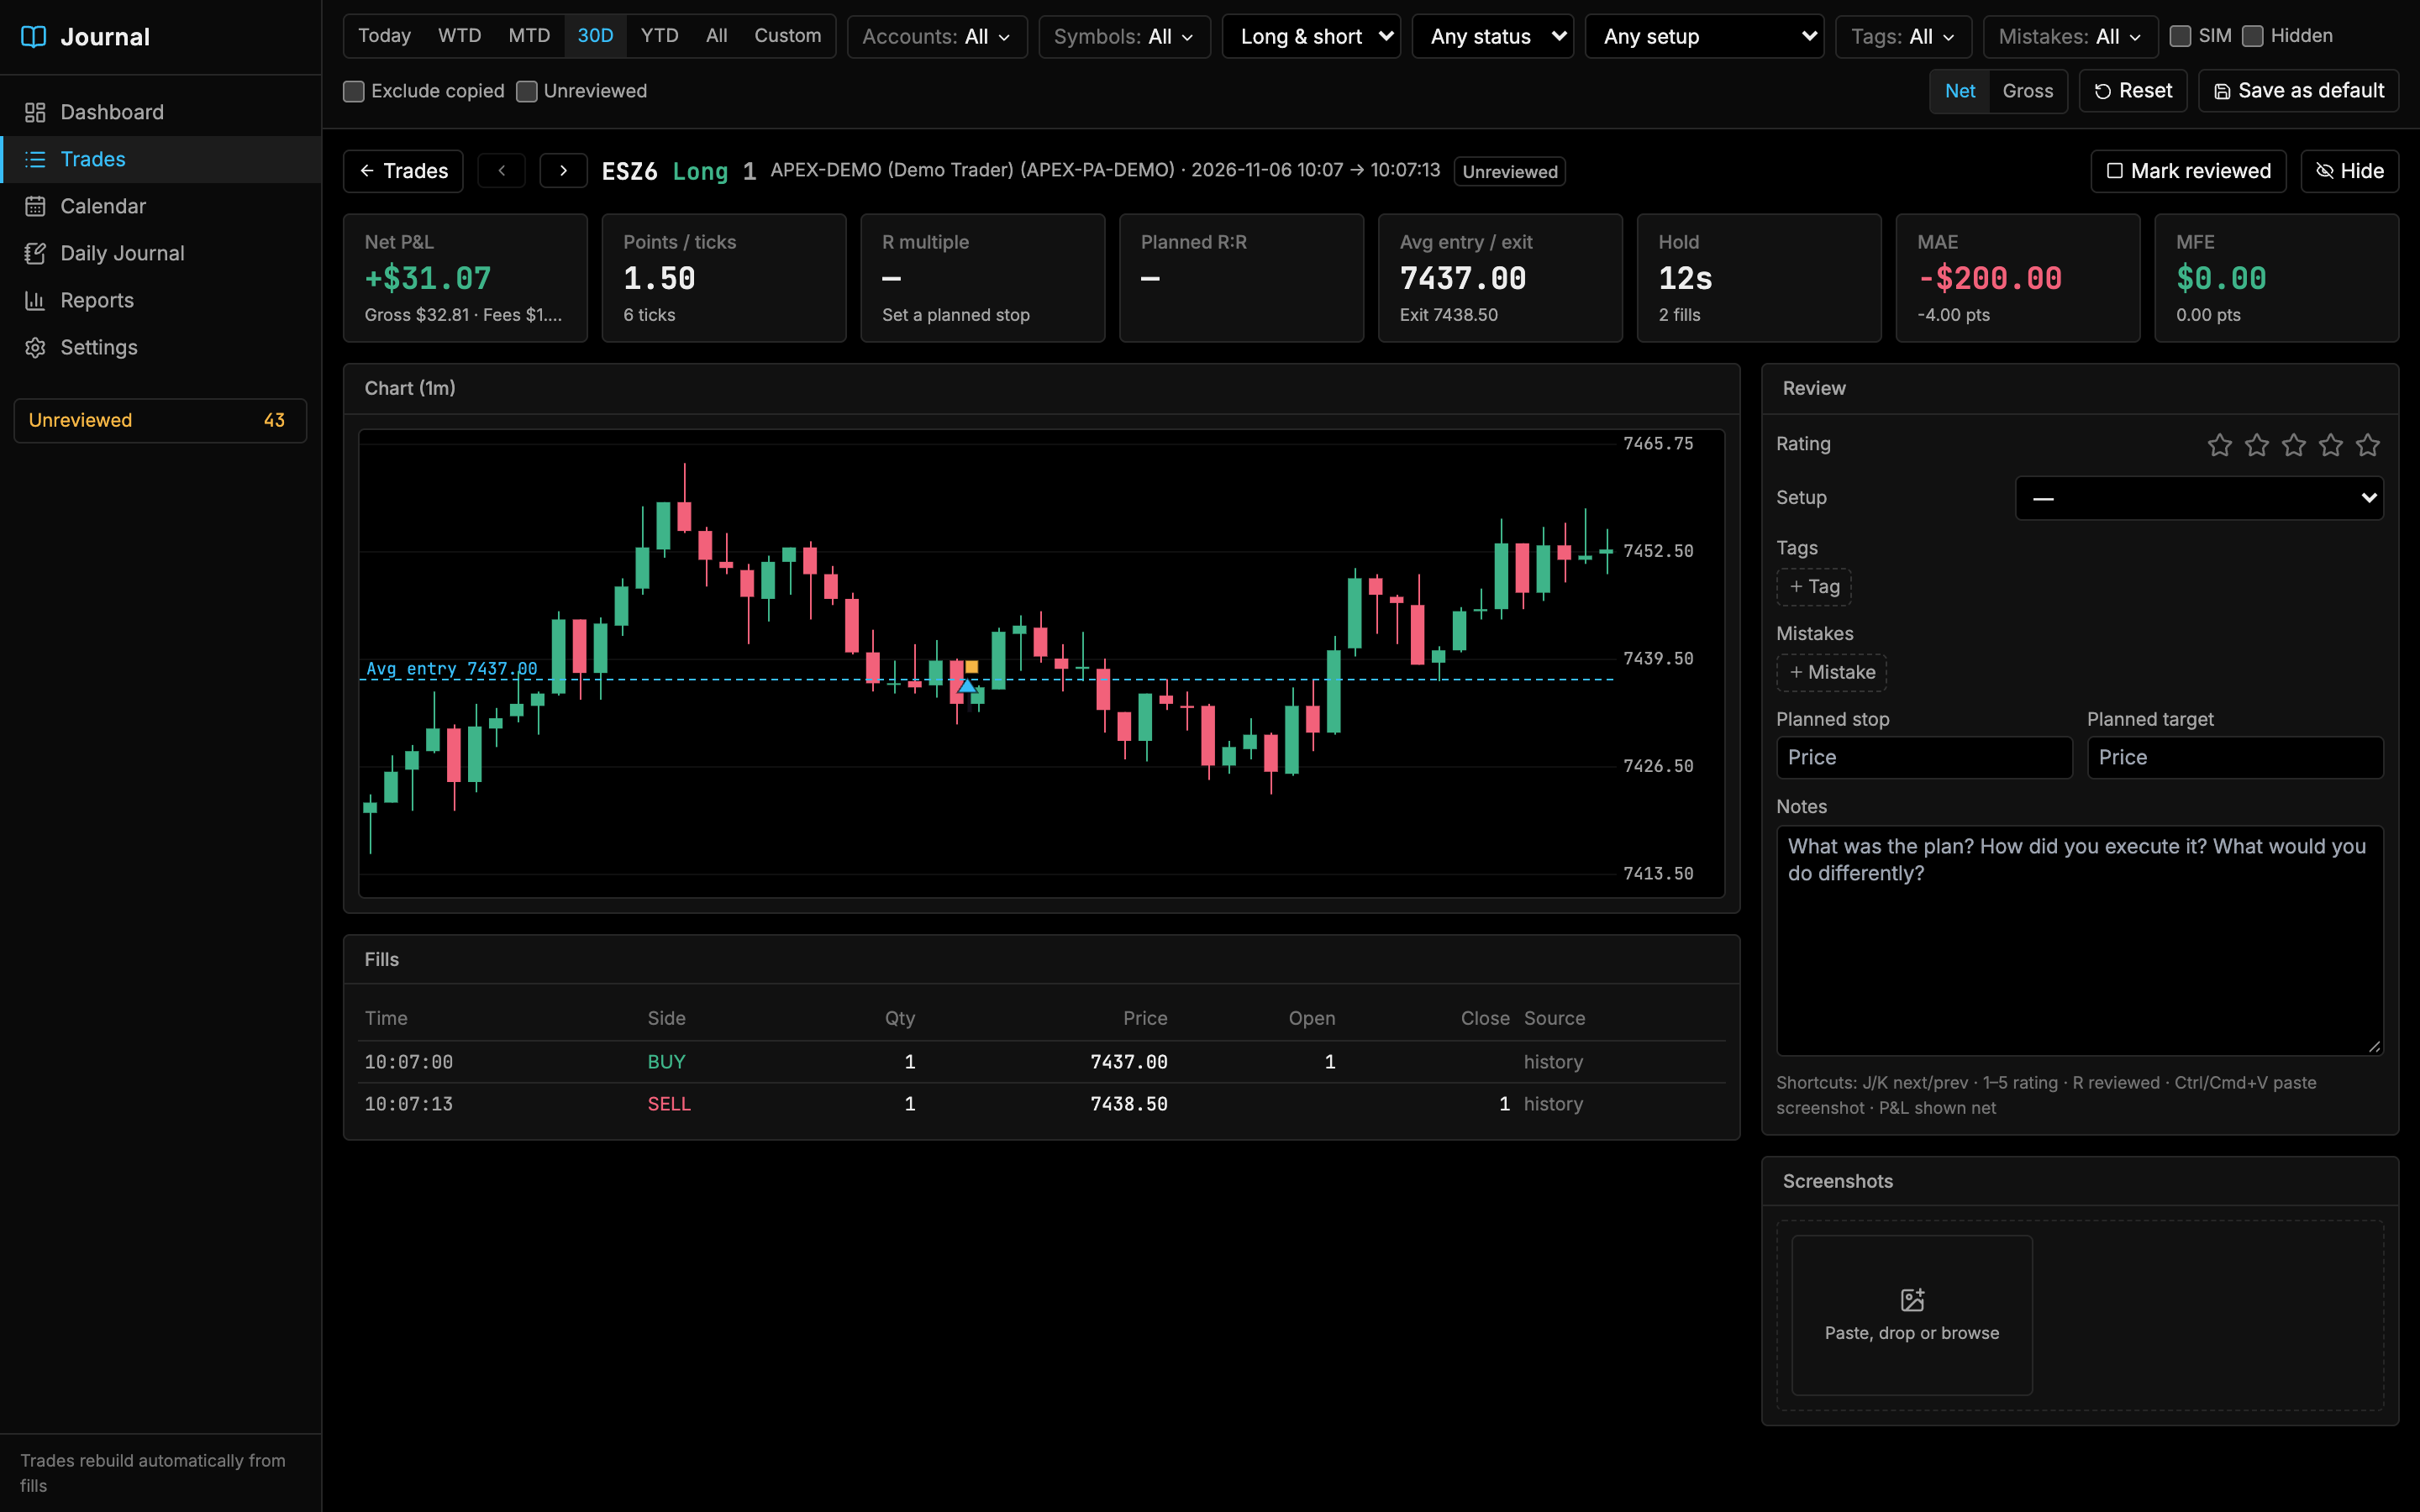
The header shows the contract, side, size, account and times, with Mark reviewed and Hide buttons. Use the arrows (or J / K) to move between trades.
KPI cards: Net P&L (with gross and fees), Points / ticks, R multiple, Planned R:R, Avg entry / exit, Hold (and number of fills), MAE and MFE.
Chart (1m): a 1-minute chart of the trade with the average entry line, and your planned stop and target if you’ve set them. If MAE and MFE haven’t been calculated yet, click Compute MAE/MFE. TickMint also calculates them in the background every 5 minutes. 1-minute history is available for the last 90 days only.
Fills: every fill with Time, Side, Qty, Price, whether it opened or closed size, and its Source.
The Review panel
| Field | Notes |
|---|---|
| Rating | 1 to 5 stars |
| Setup | One setup from your list |
| Tags | Any number of tags. Click + Tag |
| Mistakes | Any number of mistakes. Click + Mistake |
| Planned stop / Planned target | Prices. Setting a stop enables R multiple and Planned R:R |
| Notes | Free text: what was the plan, how did you execute, what would you change? |
Changes save automatically shortly after you stop typing.
Screenshots & clips
Paste an image with Ctrl/⌘+V, drag a file onto the Attachments panel, or click it to browse. Images (PNG, JPEG, WEBP up to 5 MB) and trade video clips (MP4, WebM up to 25 MB) are supported and stored locally with the journal. You can also send clips directly from a chart panel using the Journal button in the Trade video clipping tray.
Keyboard shortcuts
| Key | Action |
|---|---|
| J | Next trade |
| K | Previous trade |
| 1–5 | Set rating |
| R | Toggle reviewed |
| Ctrl/⌘+V | Paste a screenshot |
Follower and incomplete trades
- Follower trades from the Trade Copier show “Inherited from lead…” and use the lead trade’s review. Click Override to review the follower separately.
- Incomplete trades are missing their opening fills. Enter the Entry price and Qty, then click Save entry so P&L can be calculated.
A review routine
- Click the Unreviewed badge in the sidebar.
- Open the first trade.
- Rate it with 1–5, pick a setup, and add tags or mistakes.
- Add a planned stop so R is tracked.
- Press R to mark it reviewed, then J for the next trade.
Calendar
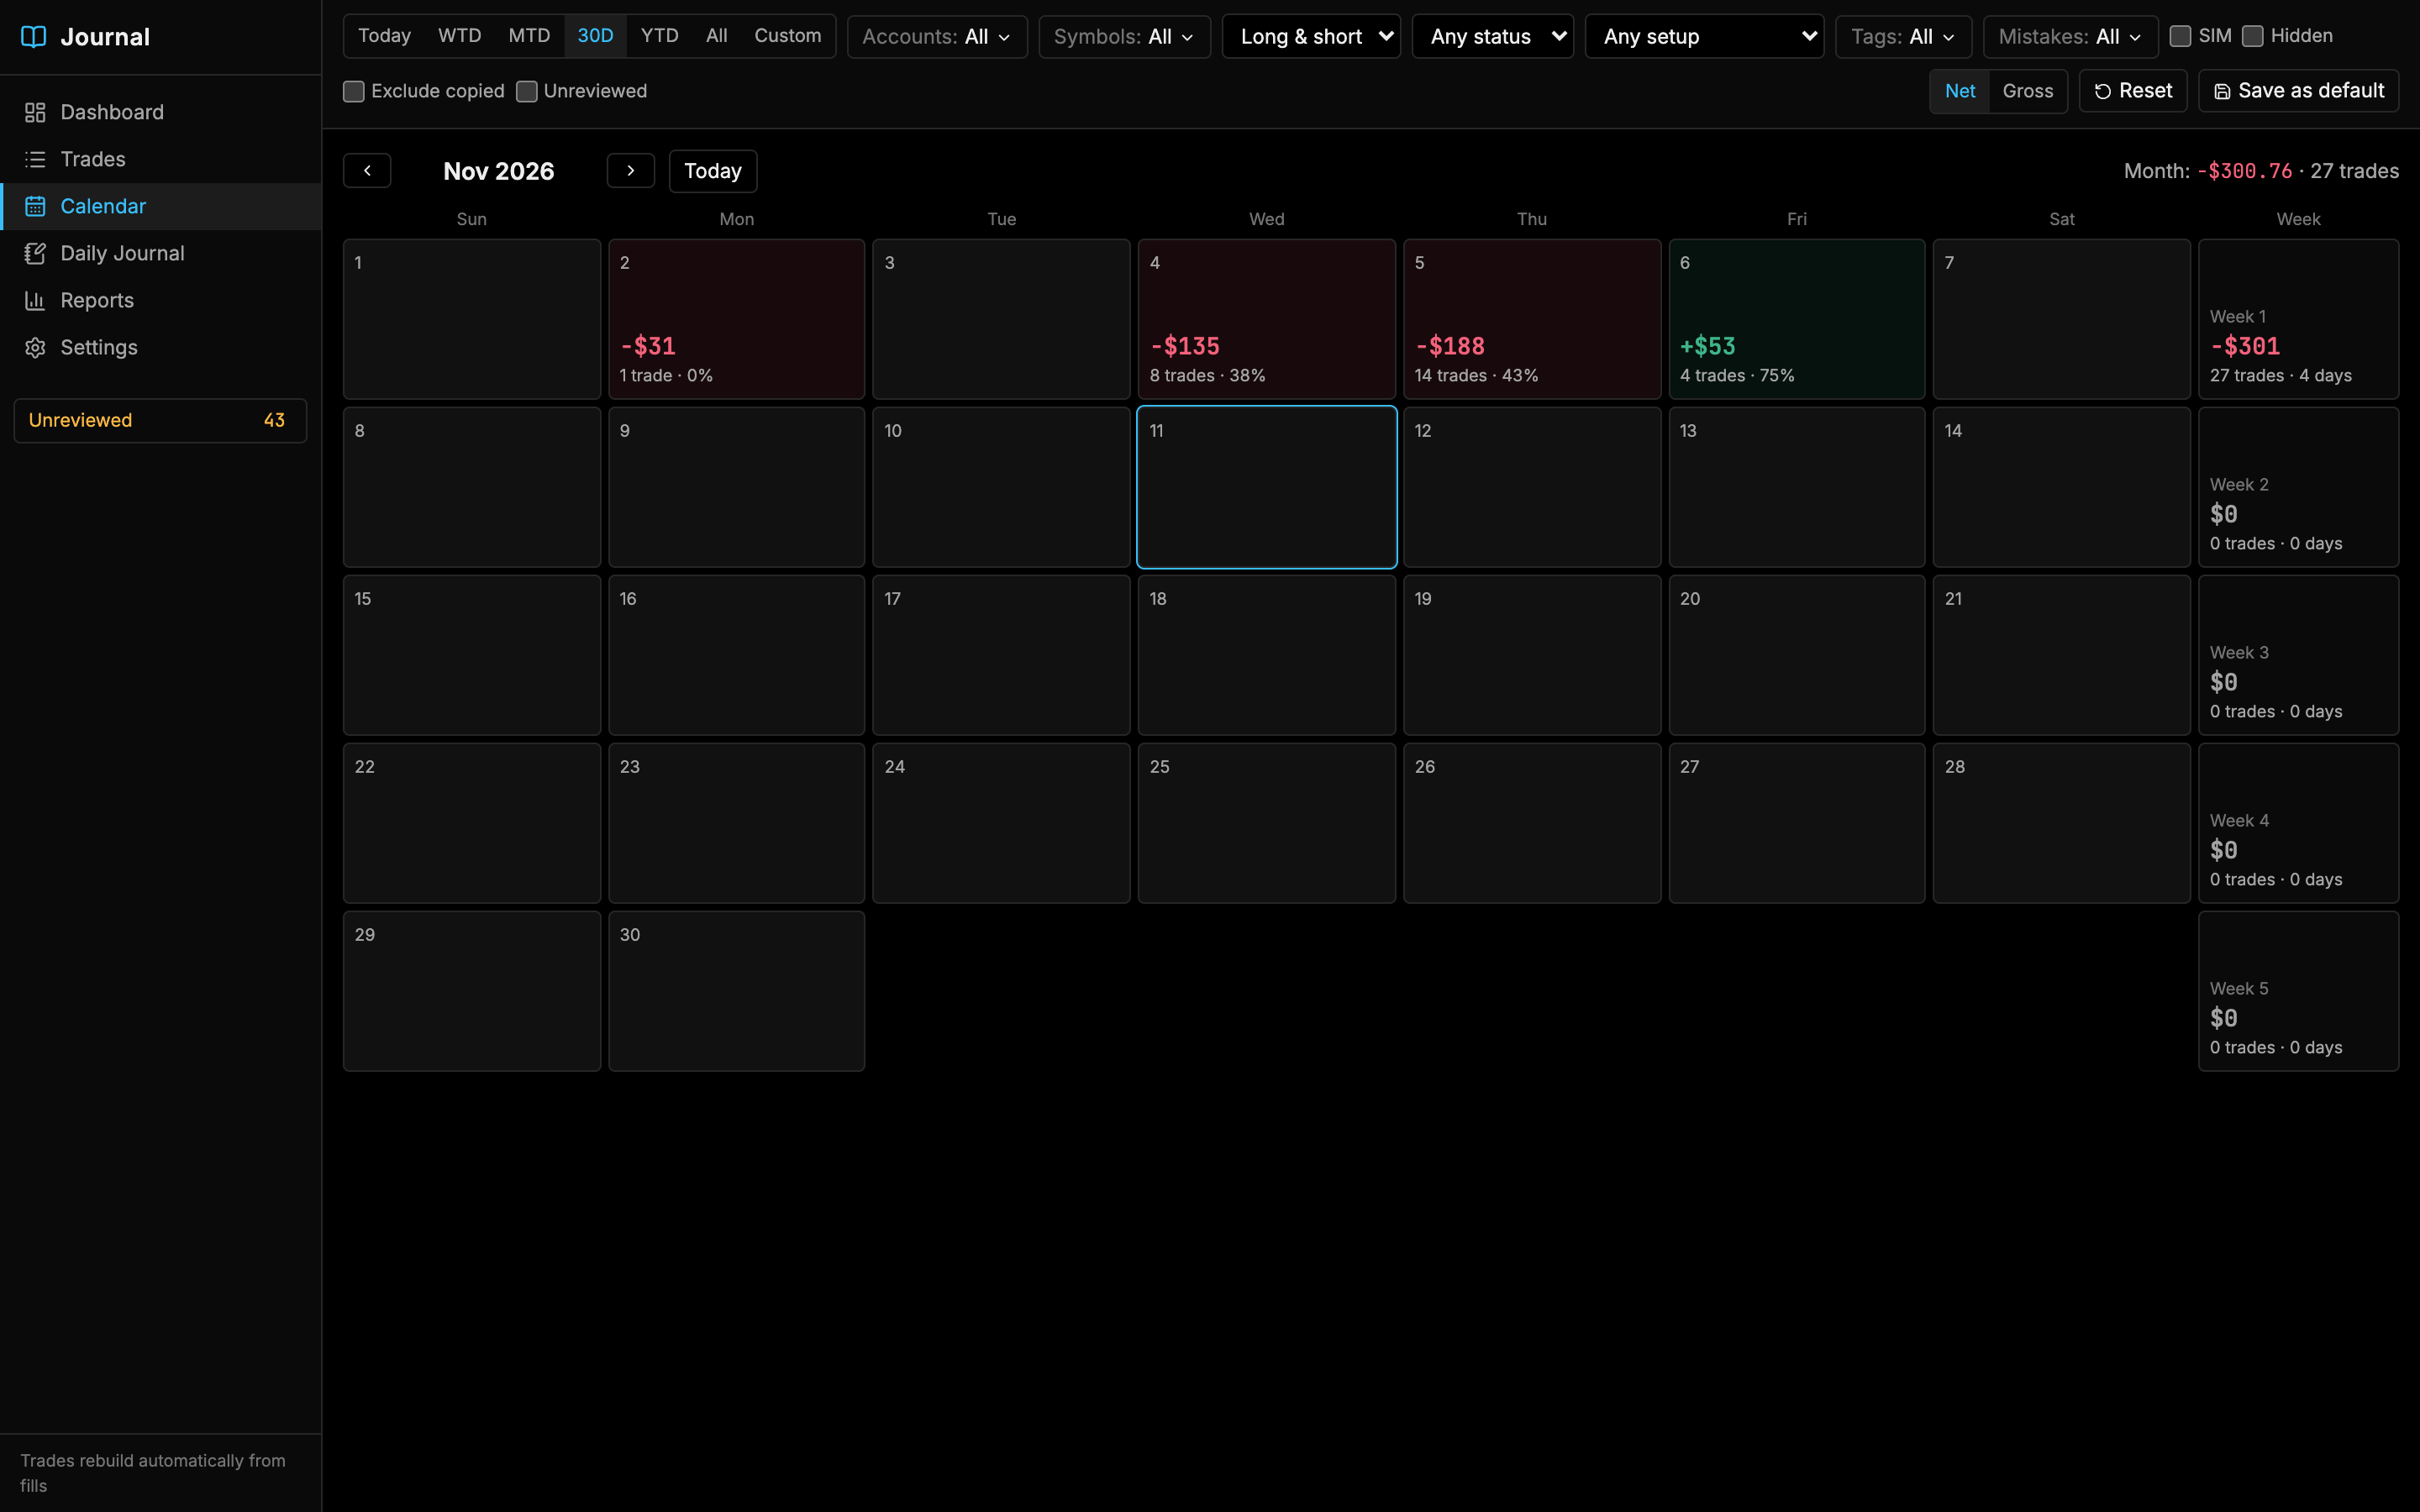
Each day shows net P&L, trade count and win rate, tinted green or red. The Week column totals each week, and the header shows the month’s P&L and trade count. Use the arrows or Today to change month. Click a day to open it in the Daily Journal.
Daily Journal
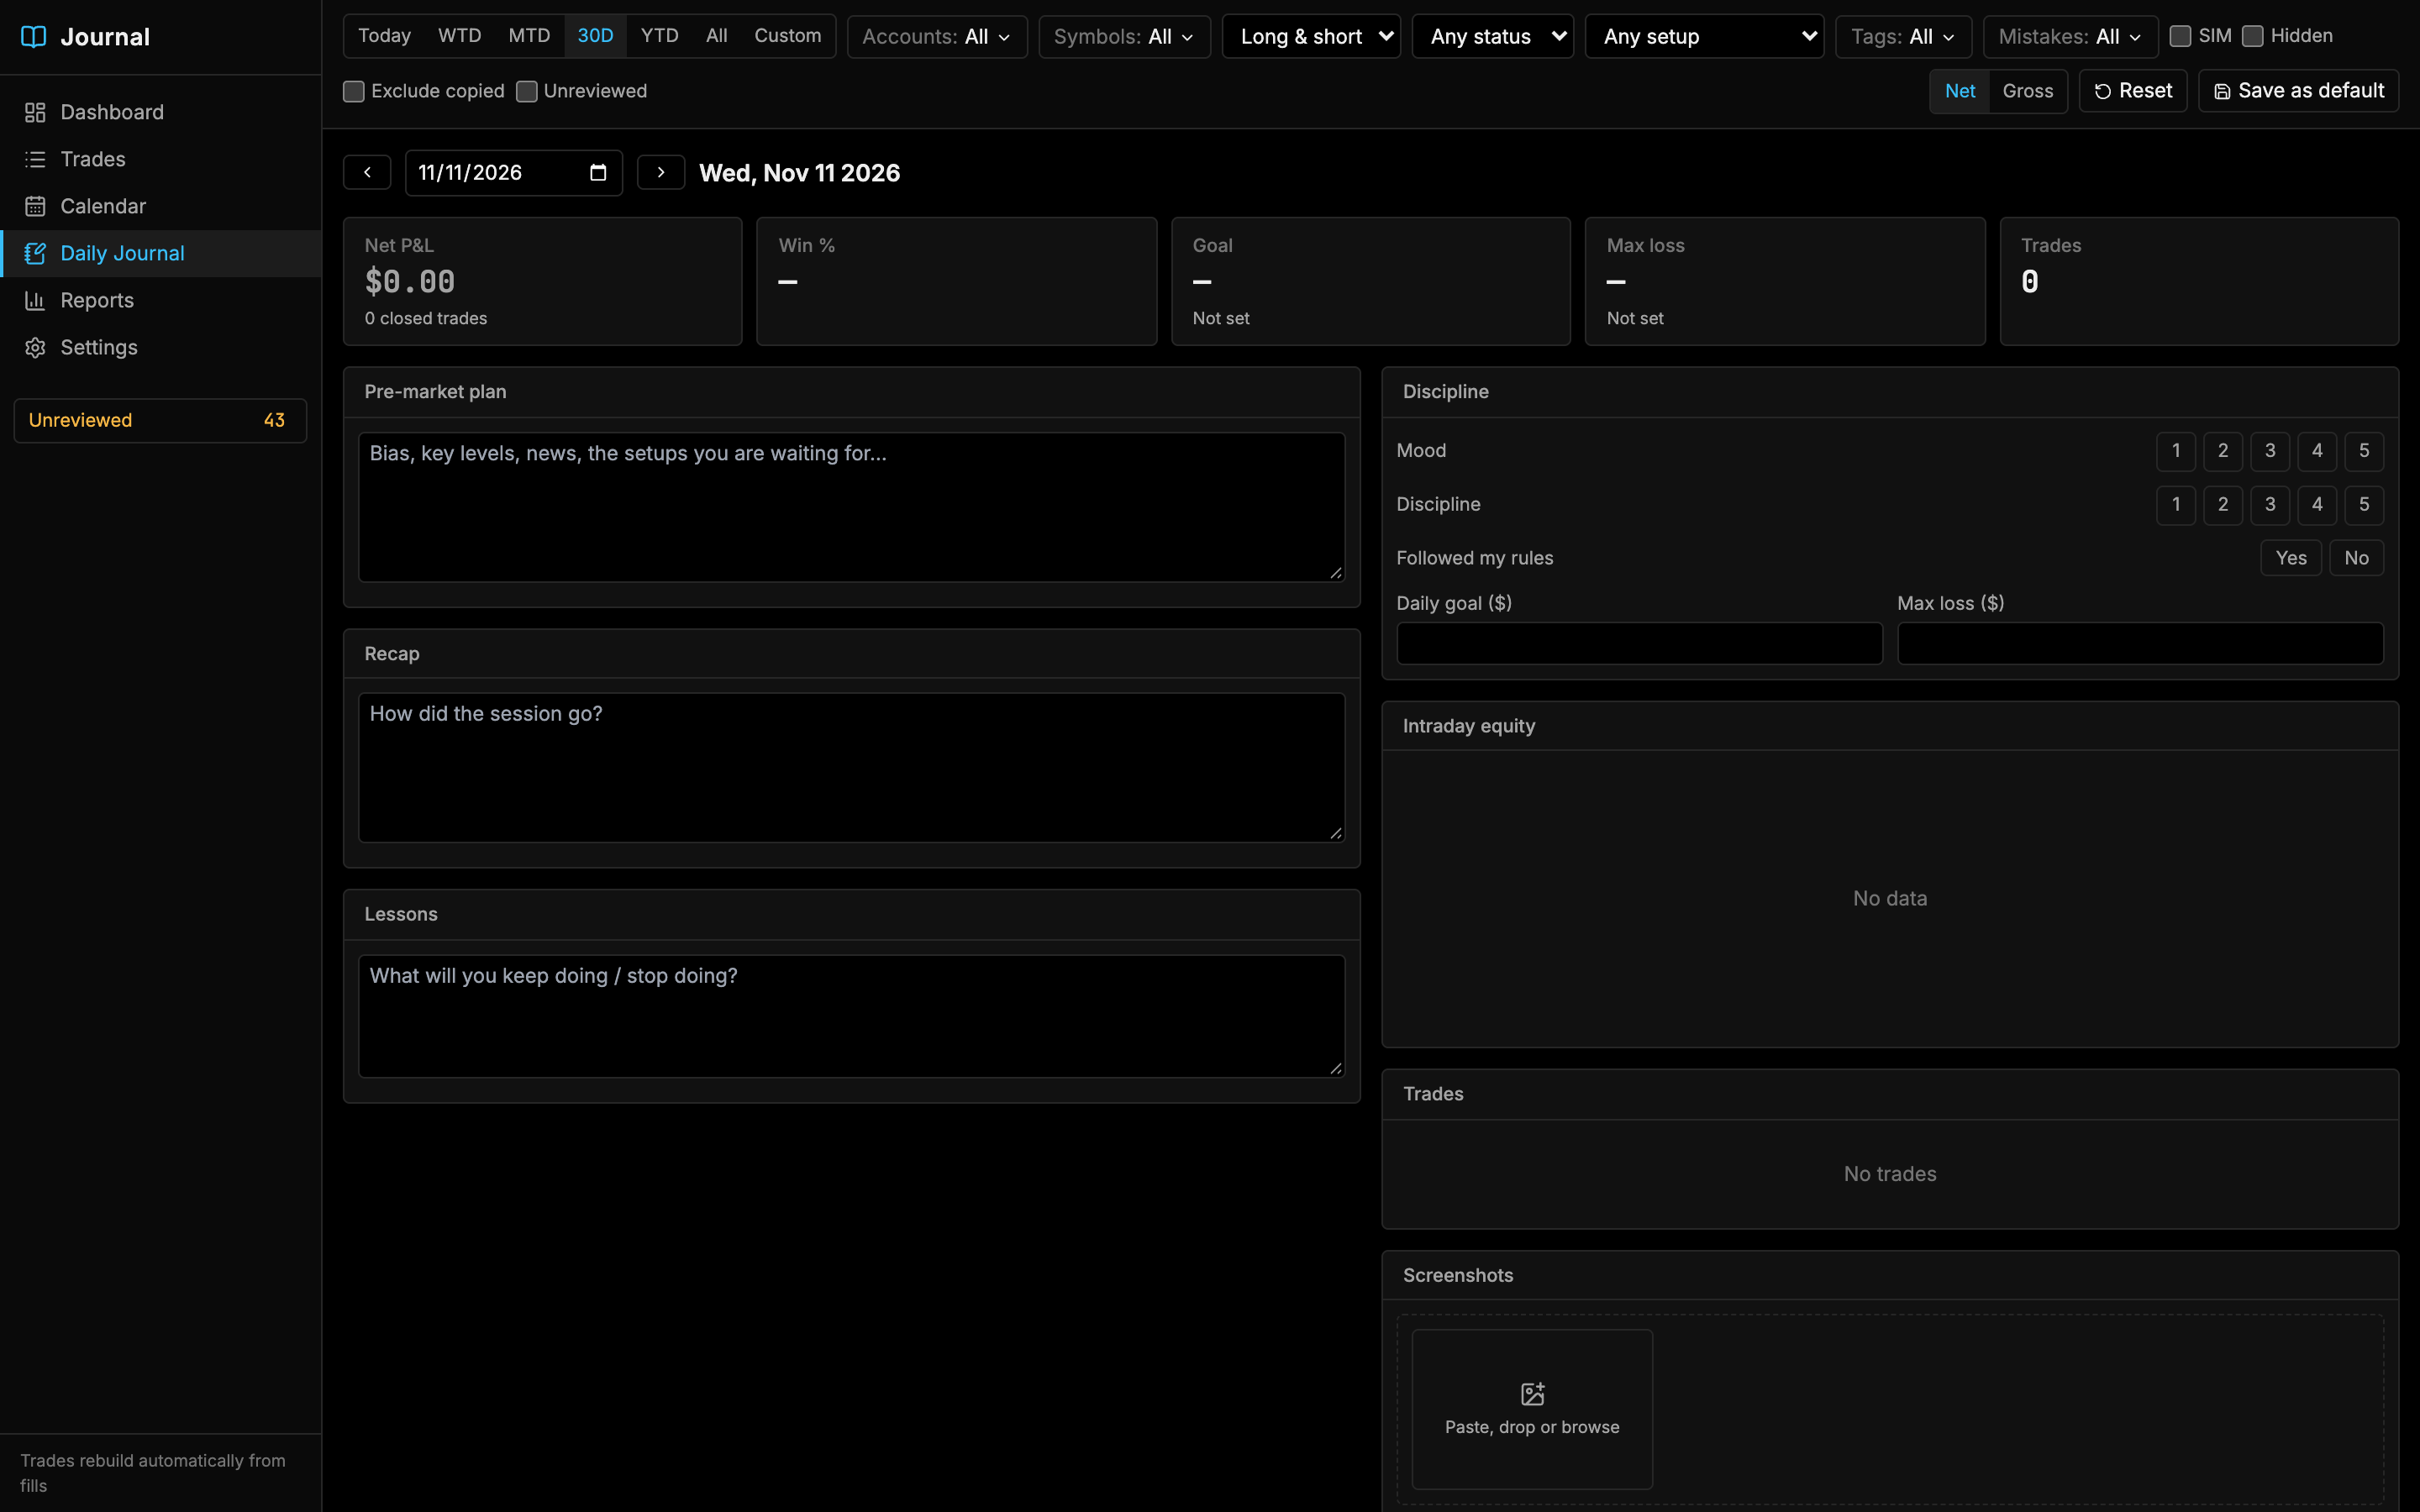
Pick a day with the date picker or arrows. The KPI cards show Net P&L, Win %, Goal, Max loss and Trades for that day.
| Panel | What to record |
|---|---|
| Pre-market plan | Bias, key levels, news, the setups you’re waiting for |
| Recap | How the session went |
| Lessons | What you’ll keep doing or stop doing |
| Discipline | Mood (1–5), Discipline (1–5), Followed my rules (Yes/No), Daily goal ($) and Max loss ($) |
| Intraday equity | The day’s P&L curve |
| Trades | The day’s trades |
| Screenshots | Paste, drop or browse, as on a trade |
The daily goal and max loss feed the Today panel on the dashboard.