Workspace tour
Workstation map
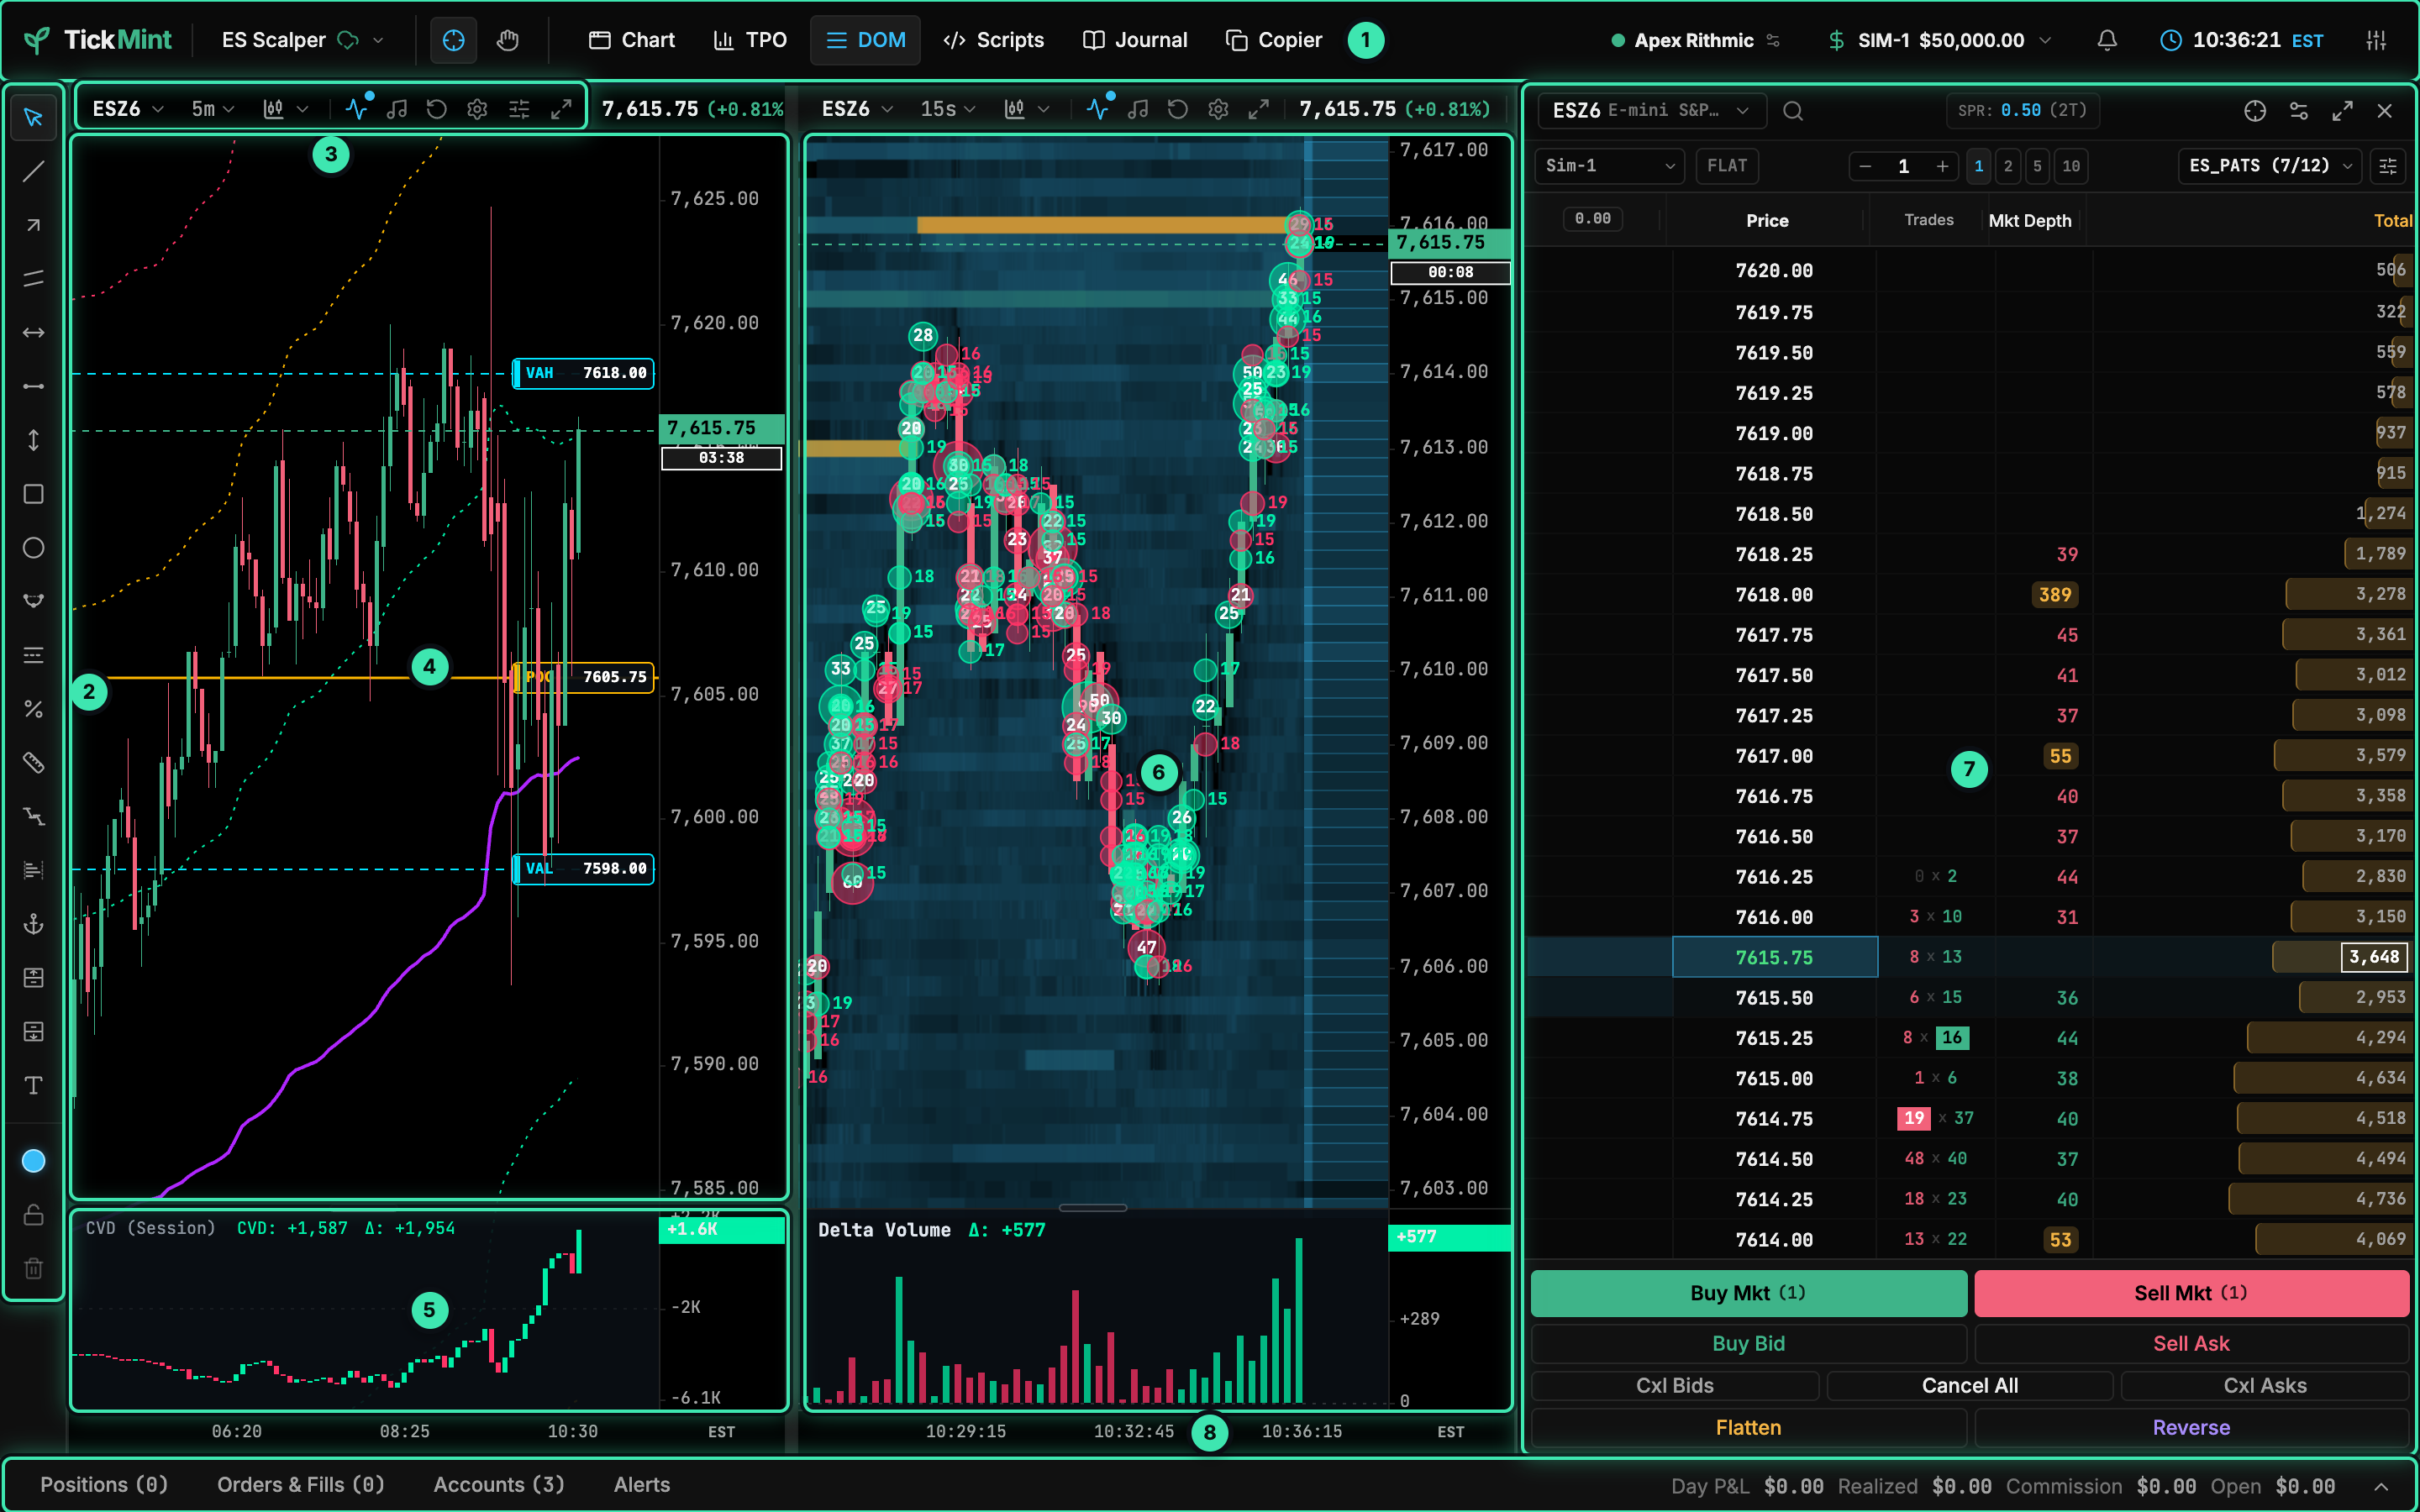
- Header toolbar: layouts, tools, windows, connection, account, alerts, clock and settings.
- Drawing toolbar: chart drawing tools.
- Chart panel header: instrument, timeframe, bar type, indicators and panel controls.
- Main chart plot: here a 5-minute ES chart with VWAP and a session volume profile.
- Sub-pane: indicators that draw below the price plot, here cumulative volume delta (CVD).
- Second chart: a 15-second Liquidity Heatmap with big trades and delta volume.
- DOM ladder: depth of market and one-click order entry.
- Trading dock: positions, orders and fills, accounts, alerts and a P&L strip.
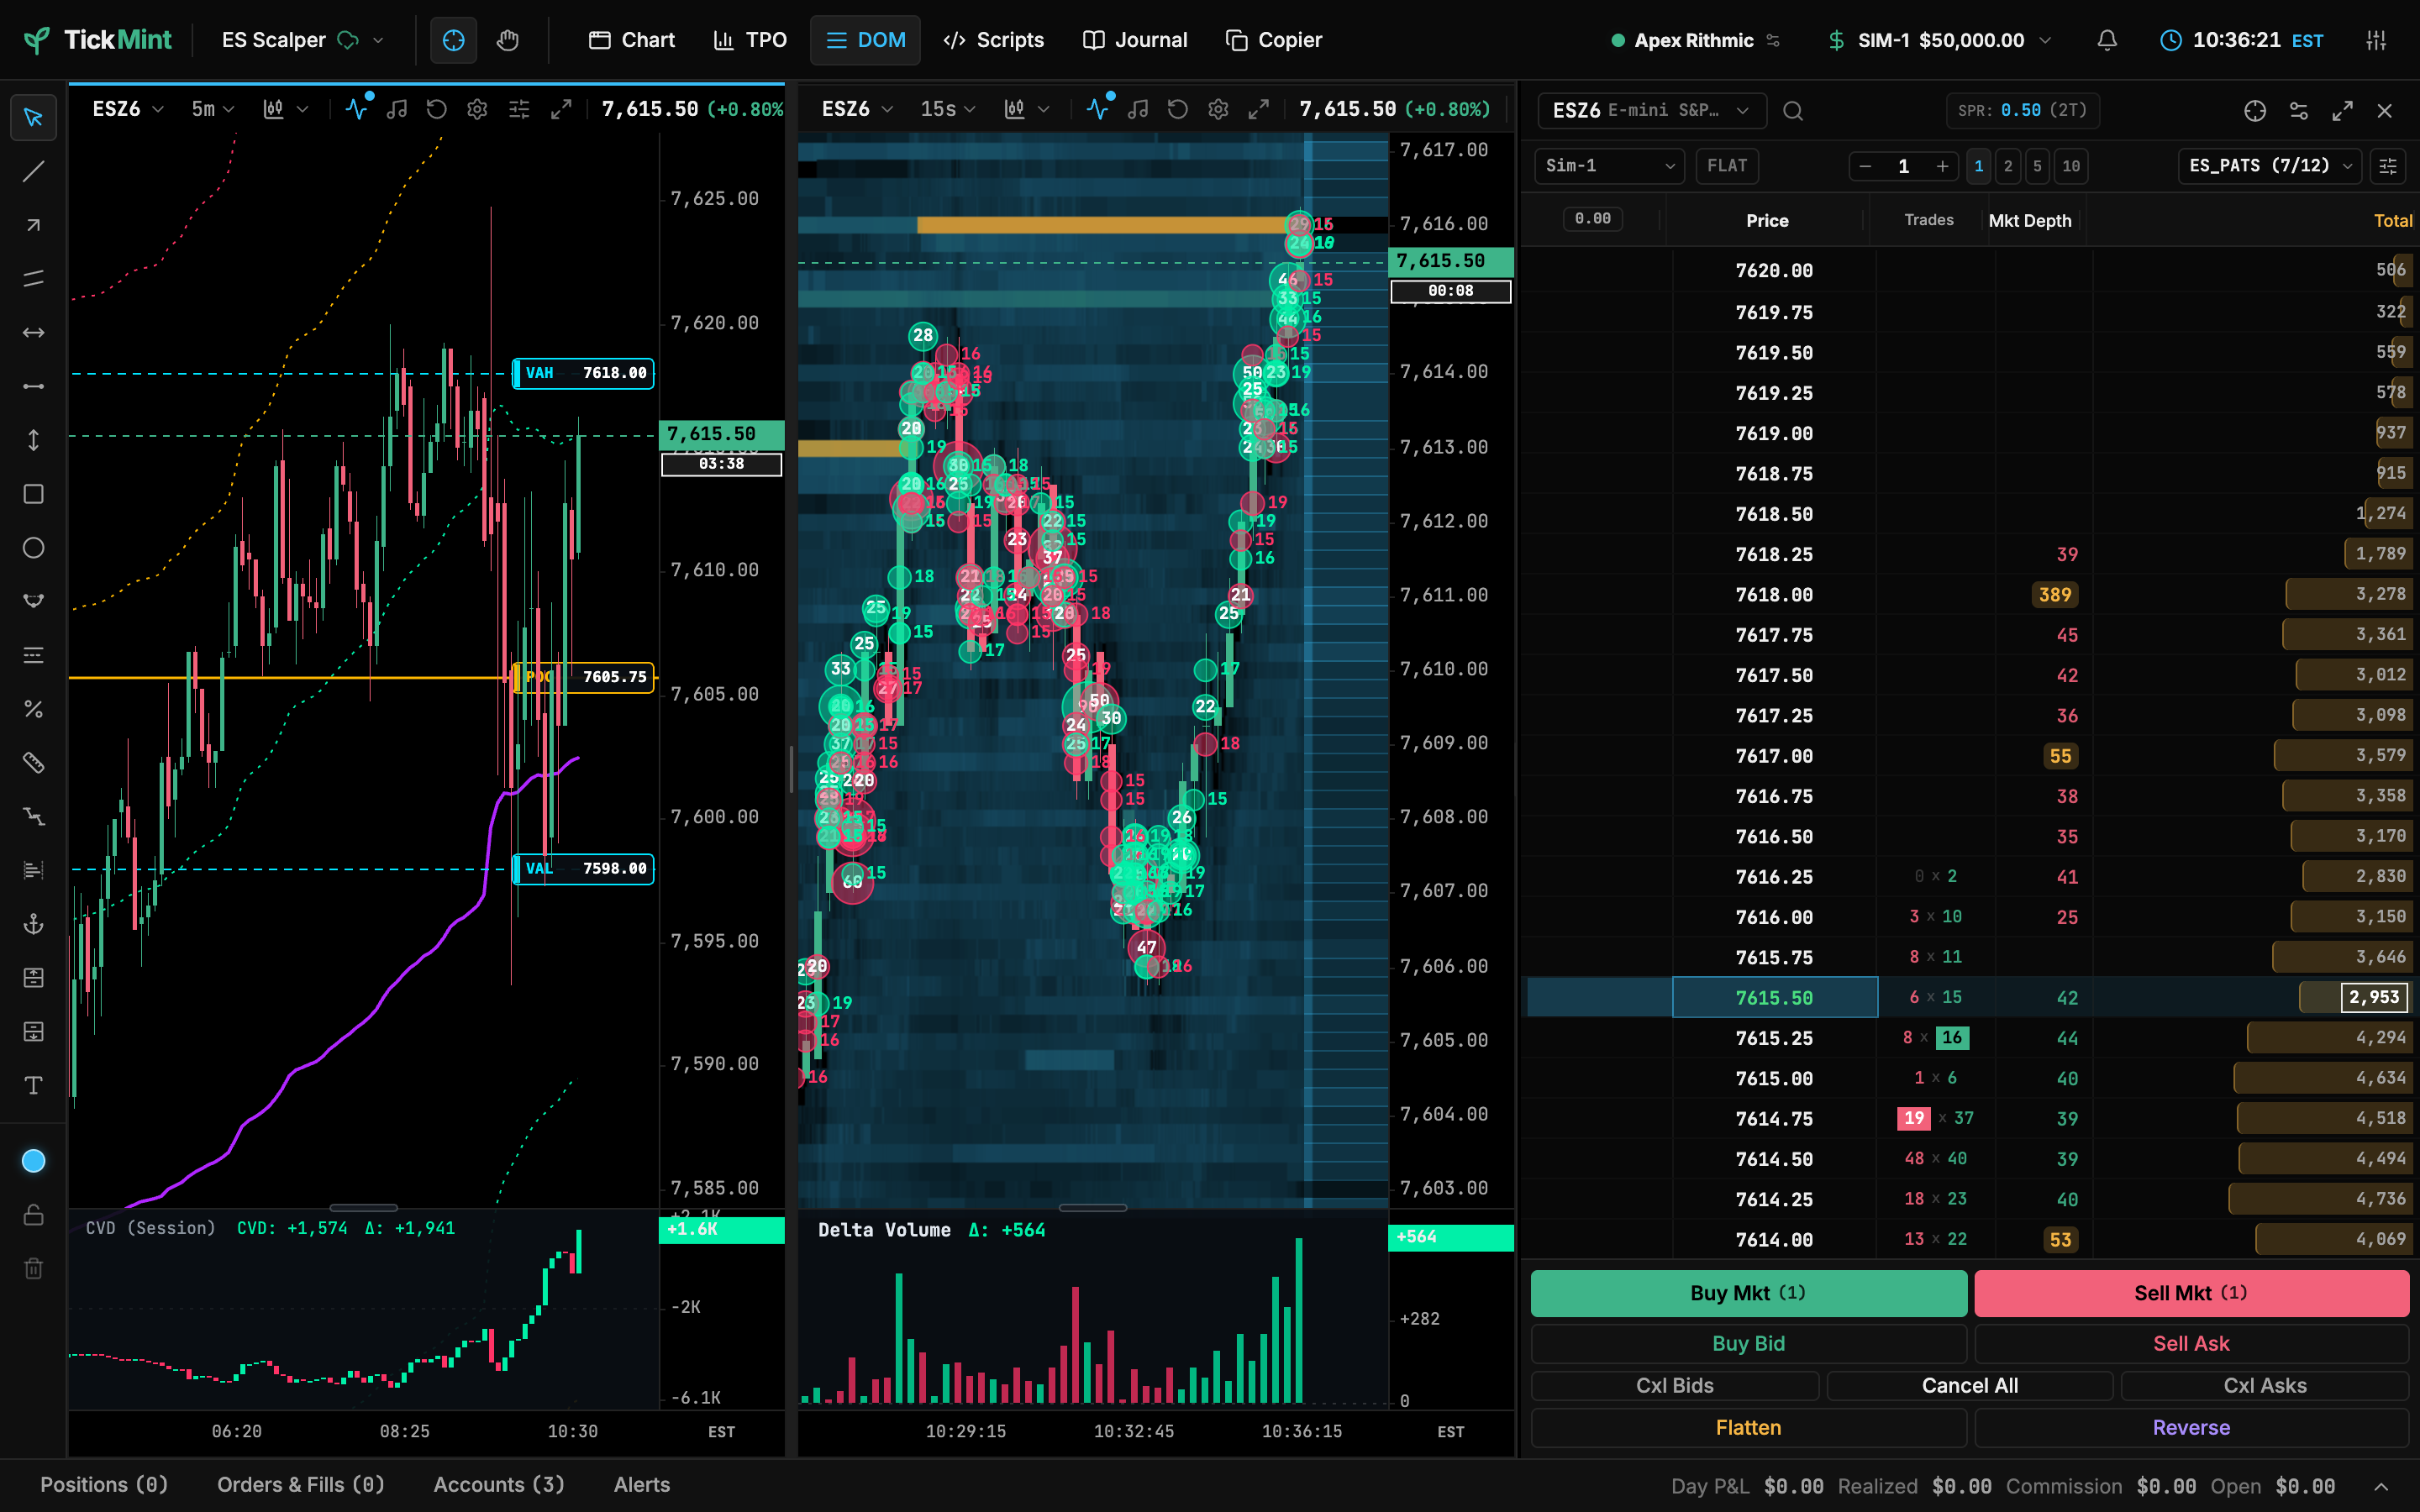
Drag the splitters between panels to resize them. The arrangement is saved in your layout template.
Header toolbar

- Layout templates: switch, save (Ctrl/⌘+S) and manage workspaces.
- Crosshair (C) and Hand grabber tools.
- Chart opens a new pop-out chart window, TPO opens a TPO Market Profile window (the chevron lists open ones) and DOM shows or hides the ladder.
- Scripts (MintScript editor), Journal and Copier (Shift+C).
- Connection status: shows the active feed. Click to open the Connection Manager.
- Account switcher: the selected trading account and its balance.
- Alert bell: click to open the Alerts tab in the dock. Right-click or Alt+click to mute alerts on this device.
- Clock: click to change the chart timezone in Settings.
- Workstation settings.
Chart panel header
Every chart panel has its own header. Its controls apply to that panel only.

- Change instrument (or Ctrl/⌘+I).
- Change timeframe.
- Candle type: candlestick, Heikin-Ashi, hollow, OHLC, line, equivolume, footprint or volume profile.
- Indicators: add, remove and configure indicators.
- Audible Tape: turn trade sounds on or off for this chart (see Audible tape).
- Reset chart view: jump back to the live edge and refresh historical bars.
- Chart panel settings.
- Trade Panel (Shift+T).
- Maximize panel.