Chart Trading
Every chart panel can trade the contract it displays. There are four ways to send orders from a chart:
- the order bar in the panel header,
- the docked Trade Panel (Shift+T),
- the right-click menu on the price you clicked,
- dragging order lines to modify working orders.
All of them use the account selected in the header and the panel’s active ATM strategy for automatic take-profit and stop-loss brackets.
Header order bar
While the Trade Panel is hidden (and trading is available for the panel), the right side of the panel header shows a compact order bar: the current position and open P&L, a quantity stepper, the ATM selector, Buy Mkt, Sell Mkt and Flatten. You can see it at the top of the screenshot below.
Working orders and position on the chart
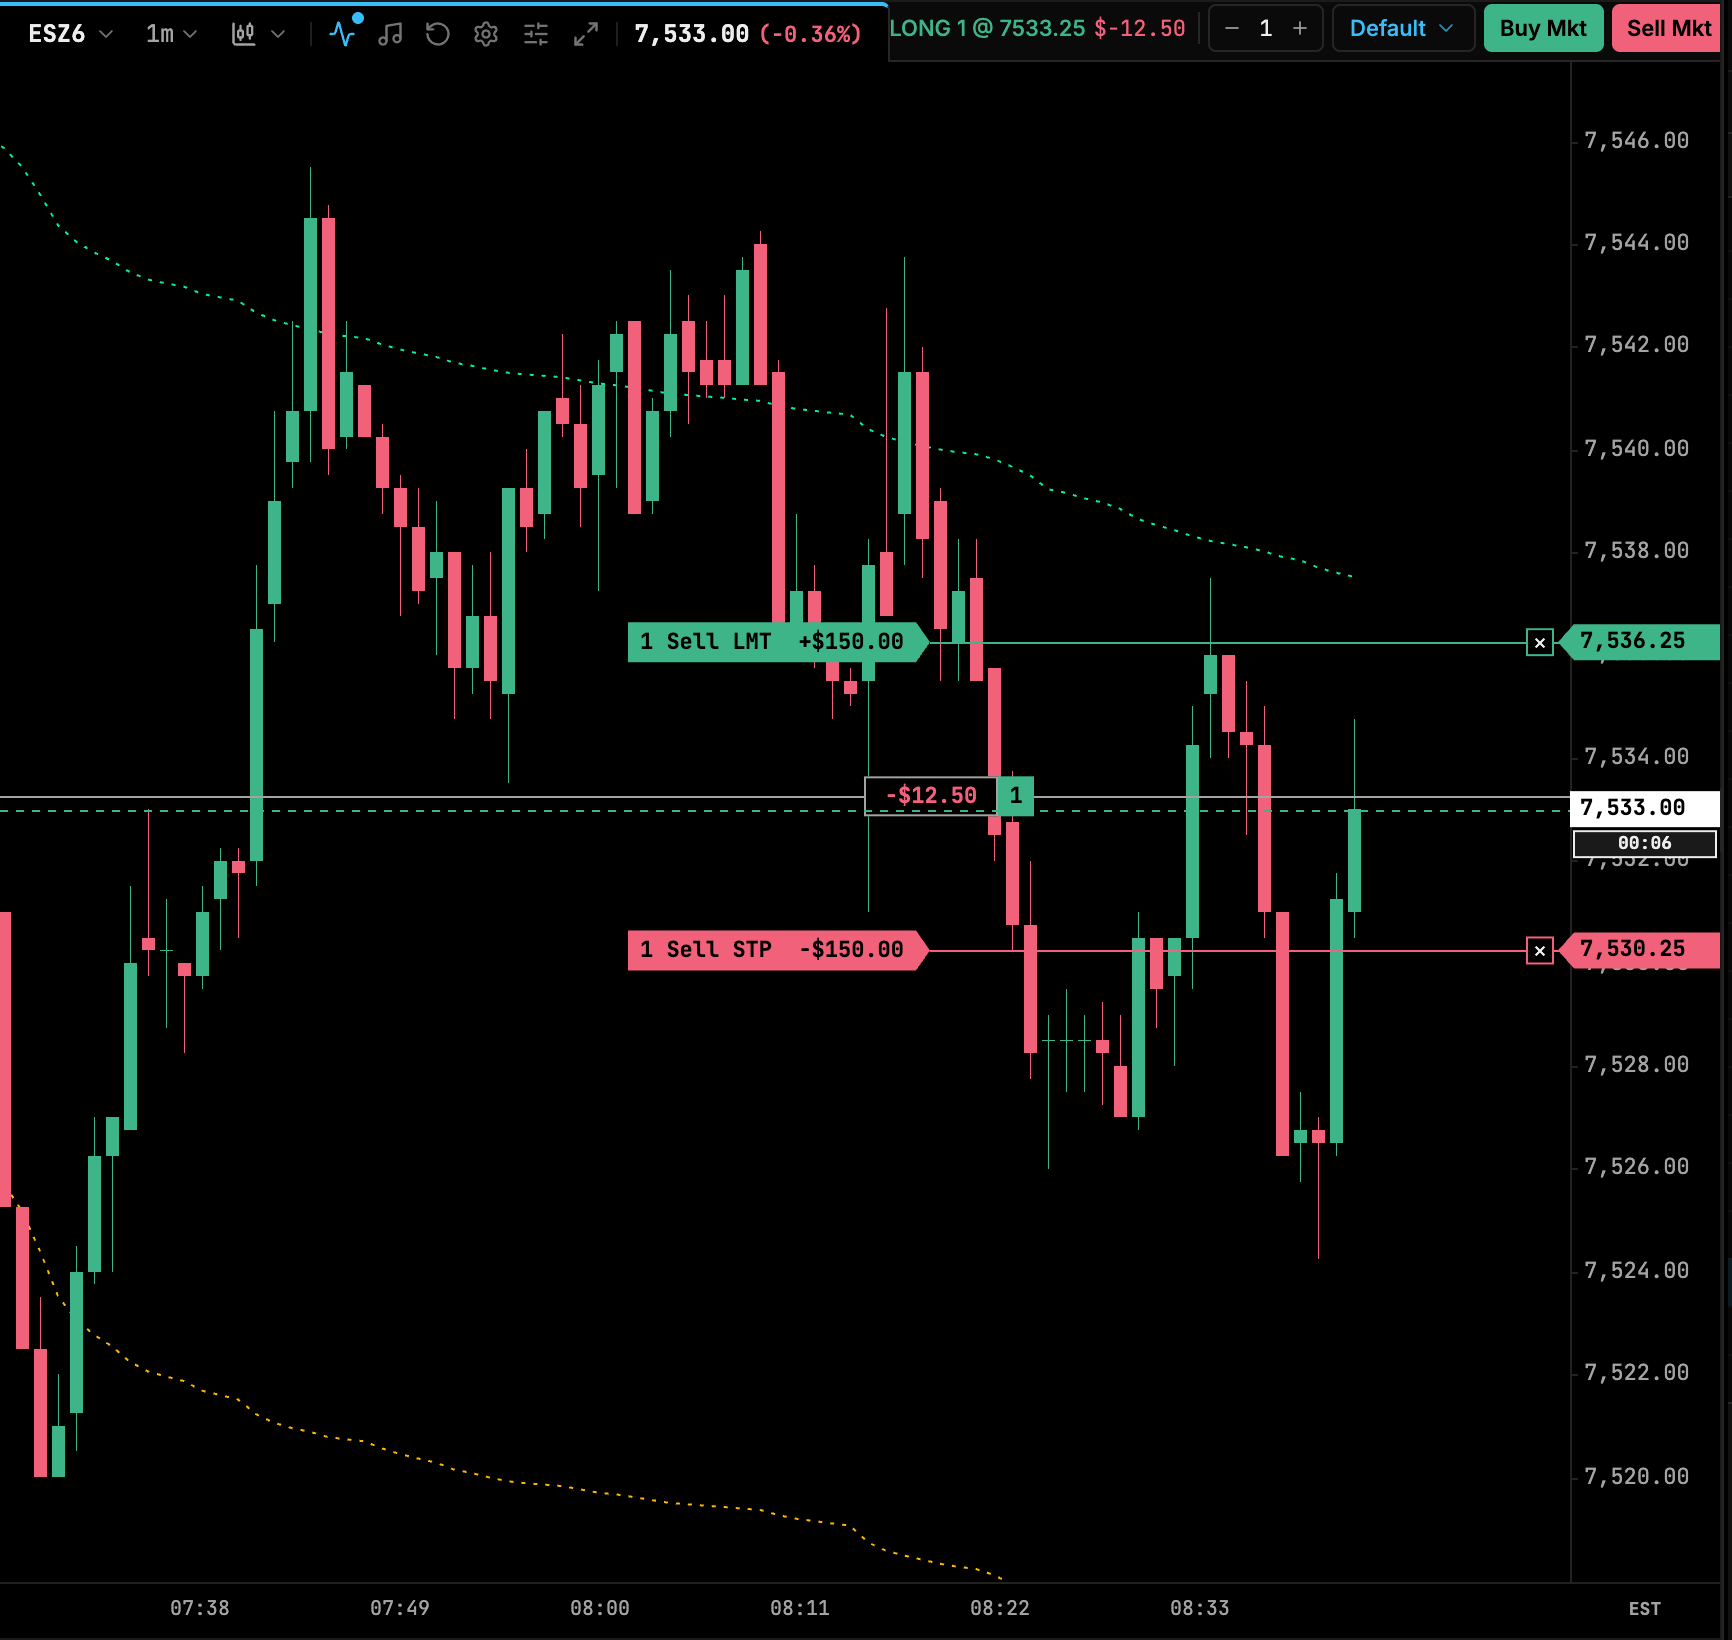
- The position line is a neutral line at your average price with two boxes: the open value (green or red) and your size (green long, red short, such as
-3for a 3-lot short). - Each working order has a coloured label such as
1 Sell LMT +$150.00: quantity, side, type and, for take-profits and stops, the value if it fills. A solid line in the order’s colour runs from the label’s arrow to the price axis, where the price is tagged. Nothing is drawn to the left of the label. - Drag an order’s label, or its line to the right of the label, to a new price to modify the order. Press Esc during the drag to cancel it.
- Click the × box at the right end of an order line to cancel that order.
Values show in dollars by default (+$150.00). Pick Ticks or Points under Value display in the panel’s Trading settings to show the number alone, such as +12 ticks or +3.00 points. Ticks and Points are per contract; dollars include the quantity. The setting applies to both order entry styles.
This is the Standard order entry style. Choose Minimal under Order entry style in the panel’s Trading settings for compact tags beside the price axis, without lines across the chart. In Minimal:
- each order tag shows ×, quantity, role and the value if it fills, such as
× 1 SL -$250.00; - drag a tag to modify the order, and click its × to cancel only that order (cancelling an unfilled entry also drops its ATM bracket, which is only placed on fill);
- the position tag shows ×, signed size and the open value. Clicking its × flattens the symbol right away, with no confirmation, the same as Flatten.
See Chart panel settings for a side-by-side comparison.
Take-profit and stop-loss lines are kept on the correct side of the price while you drag them. If you drag quickly, TickMint sends only the latest price once the previous modify is acknowledged, so the broker isn’t flooded with intermediate prices.
Right-click menu
Right-click a price on the chart to open an order menu for that exact price.
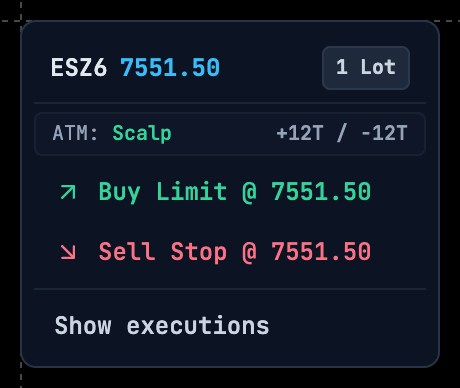
The header shows the symbol, the clicked price and the order quantity. The ATM row shows the active strategy and its first target and stop in ticks. The order items depend on where you clicked:
| Clicked price | Order items |
|---|---|
| Below the market | Buy Limit, Sell Stop |
| Above the market | Sell Limit, Buy Stop |
| At the market | Buy Market, Sell Market |
Show executions / Hide executions toggles fill markers on the chart. The menu doesn’t open on analysis-only charts.
Trade Panel
Press Shift+T or click the Trade Panel button in the panel header to dock an order ticket beside the chart. It docks on the right by default; you can move it to the left with Dock side under Dockable trade panel in the panel’s Trading settings. While the Trade Panel is open, the header order bar is hidden.
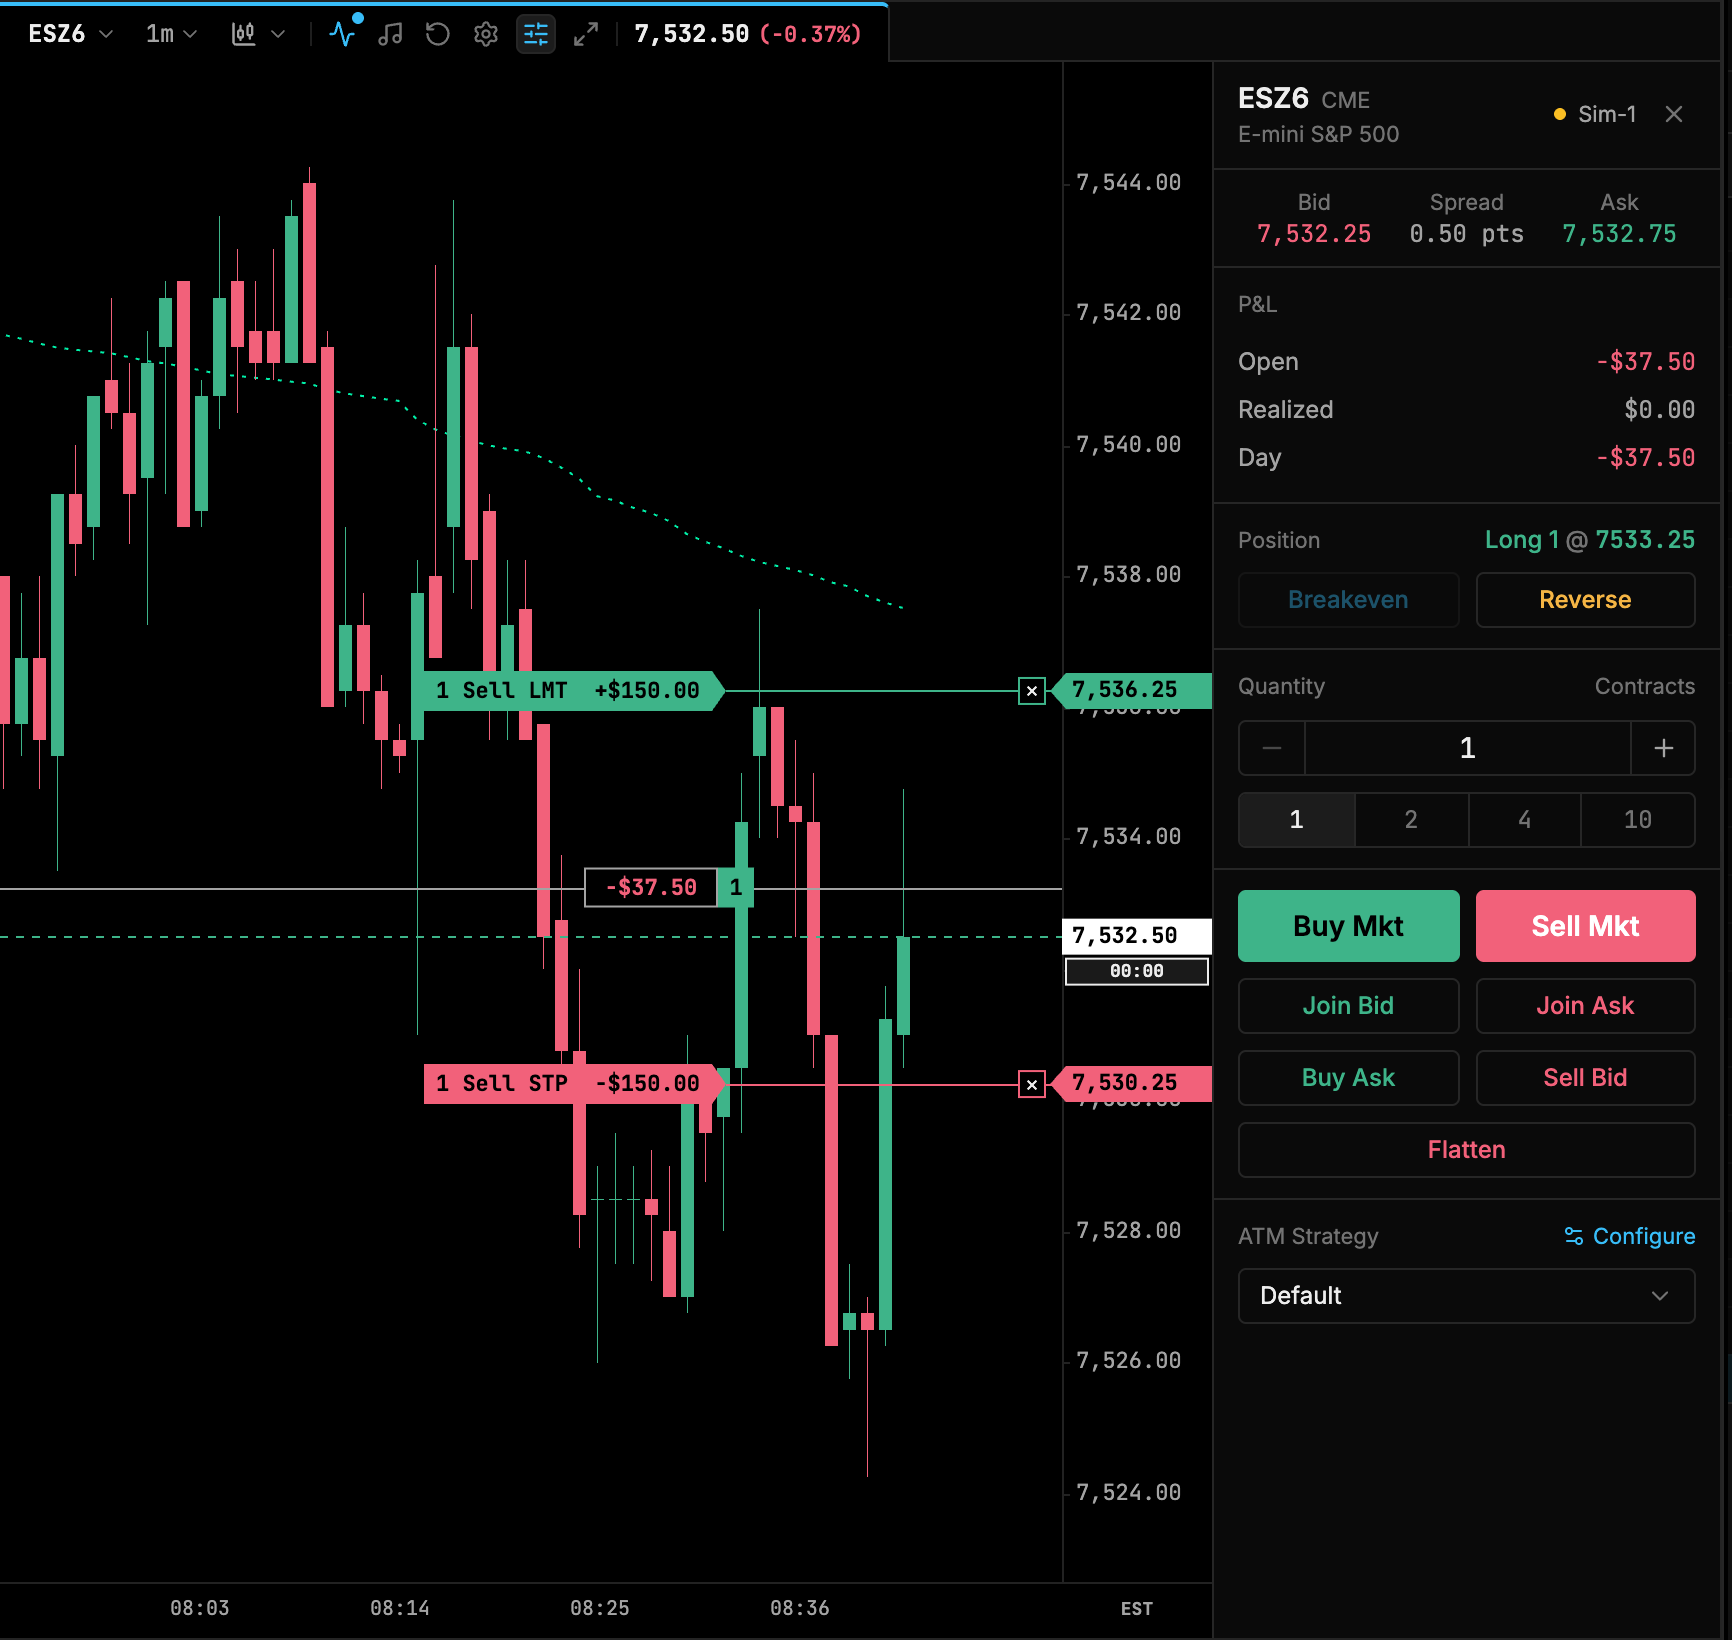
| Section | Controls |
|---|---|
| Header | Symbol and exchange, the trading account, close button |
| Market | Bid, spread and ask |
| P&L | Open, Realized and Day (whole-account P&L for the day) |
| Position | Current position and breakeven price |
| Reverse | Cancels the position’s brackets and sends a market order for twice the position size in the opposite direction |
| Quantity | − / + stepper and presets 1, 2, 4, 10 |
| Market orders | Buy Mkt, Sell Mkt |
| Join | Join Bid (buy limit at the bid), Join Ask (sell limit at the ask) |
| Aggressive limits | Buy Ask (buy limit at the ask), Sell Bid (sell limit at the bid) |
| Flatten | Closes the position at market and cancels all working orders |
| ATM Strategy | Choose None (Brackets Disabled) or a template (shown as TP: n t · SL: n t); Configure opens the ATM editor |
Analysis-only charts
For charts used only for research, turn on Analysis only in chart settings → Trading. The panel then shows no trading information at all: no header order bar or position badge, no trade panel or Shift+T, no order or position lines, no execution markers, no account picker in pop-out windows and no right-click menu. Your orders and positions aren’t touched; they’re just not shown on that chart. The trading settings (order entry style, trade panel, trade markers) are greyed out but kept, and come back when you turn Analysis only off. It applies per panel, so a layout can mix trading charts and analysis charts.
Typical workflow
- Pick the account in the header and check the quantity.
- Choose an ATM strategy in the order bar or Trade Panel, or None to trade without brackets.
- Enter with Buy Mkt / Sell Mkt, or right-click a price for a limit or stop entry.
- When the entry fills, the ATM attaches the take-profit and stop-loss lines. Drag them to adjust.
- Exit with Flatten, or let a target or stop fill.
Positions, working orders and fills for all accounts are also listed in the Trading Dock. The Order Lifecycle page explains the statuses an order goes through.