Trend Indicators
Trend indicators show you which way the market is moving and how strongly. All nine are calculated from bar data, so they work on every bar type and in Market Replay. To add one, open the Indicators dialog from the chart panel header. See the Indicators Overview.
Exponential Moving Average
An exponentially weighted average of the close. It weights recent bars more heavily than older ones, so it reacts to price changes faster than an SMA of the same length. Traders use it to read trend direction, as dynamic support and resistance, and for fast/slow crossovers. Add several instances (for example 9 / 21 / 200) to build a ribbon.
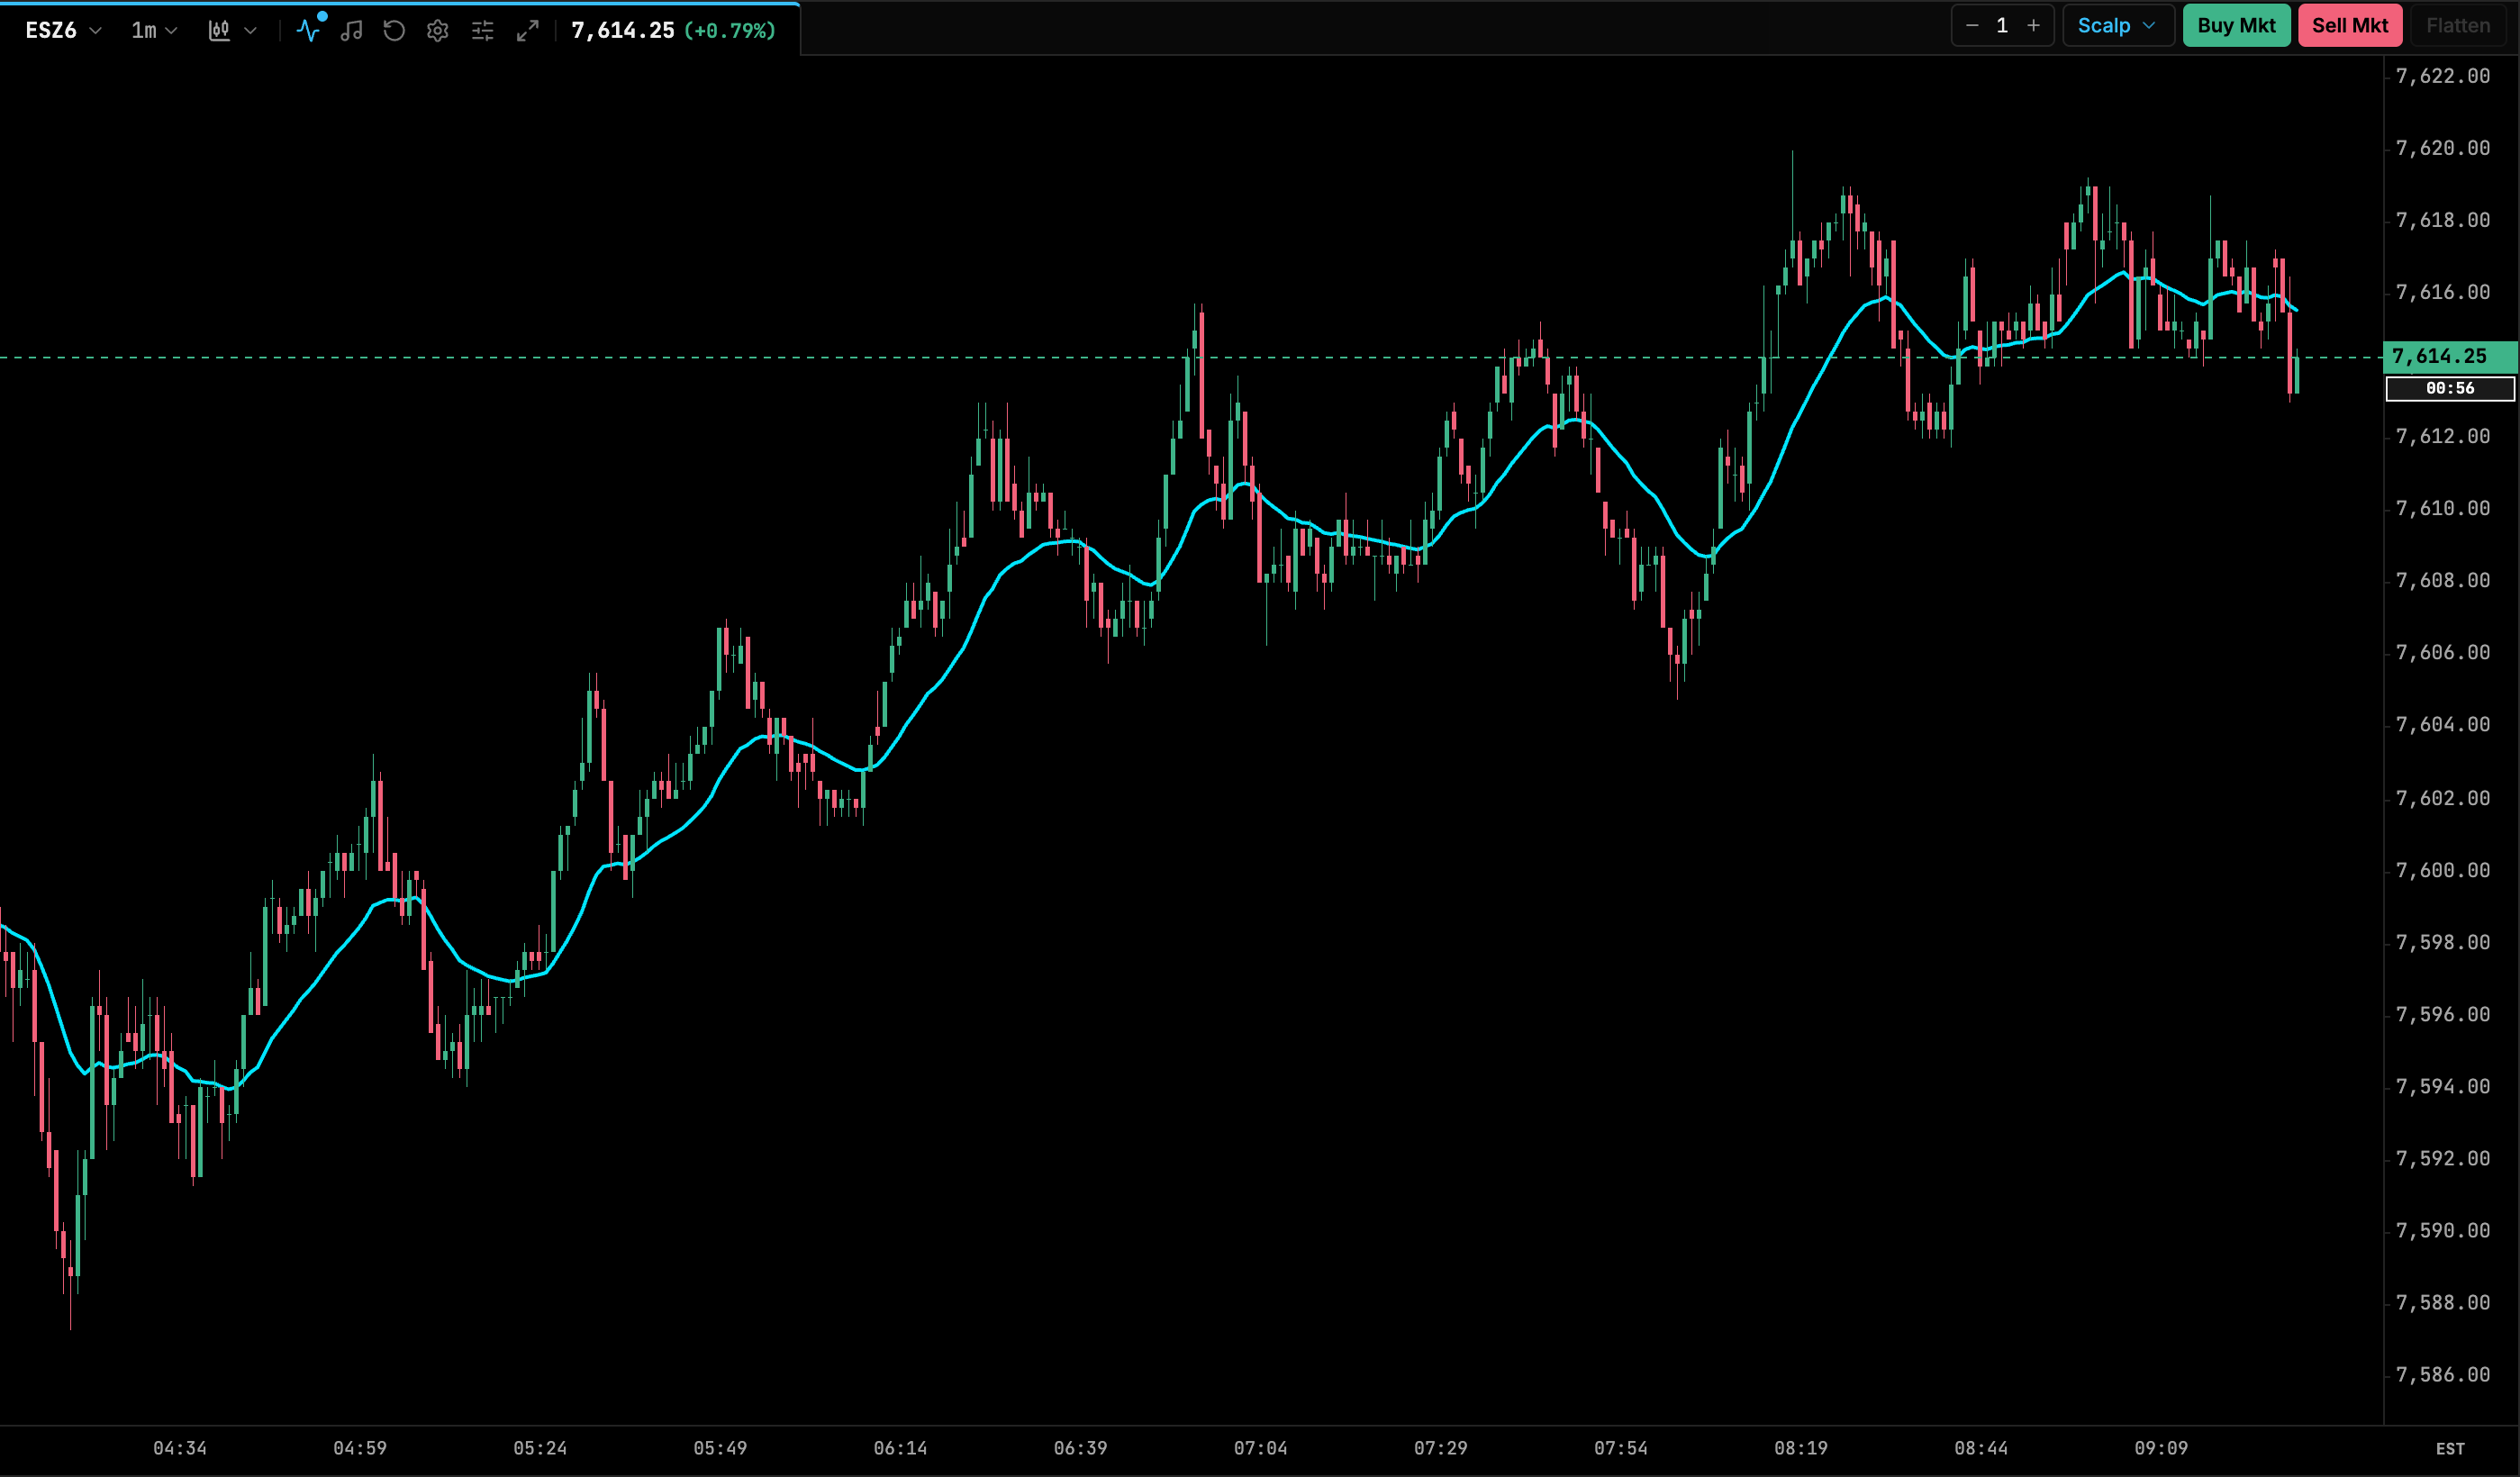
| Setting | Default | Range / options | Notes |
|---|---|---|---|
| Length / Period | 20 |
1–500 | Number of bars in the average. |
| Line Color | #00E5FF |
color | |
| Line Thickness | 2 |
1–5 (step 1) | Pixels. |
Simple Moving Average
The plain average of the last N closes, with every bar weighted equally. It is slower and smoother than an EMA, and is commonly used as a trend baseline (the 50 or 200 SMA) or as the slow line in a crossover.
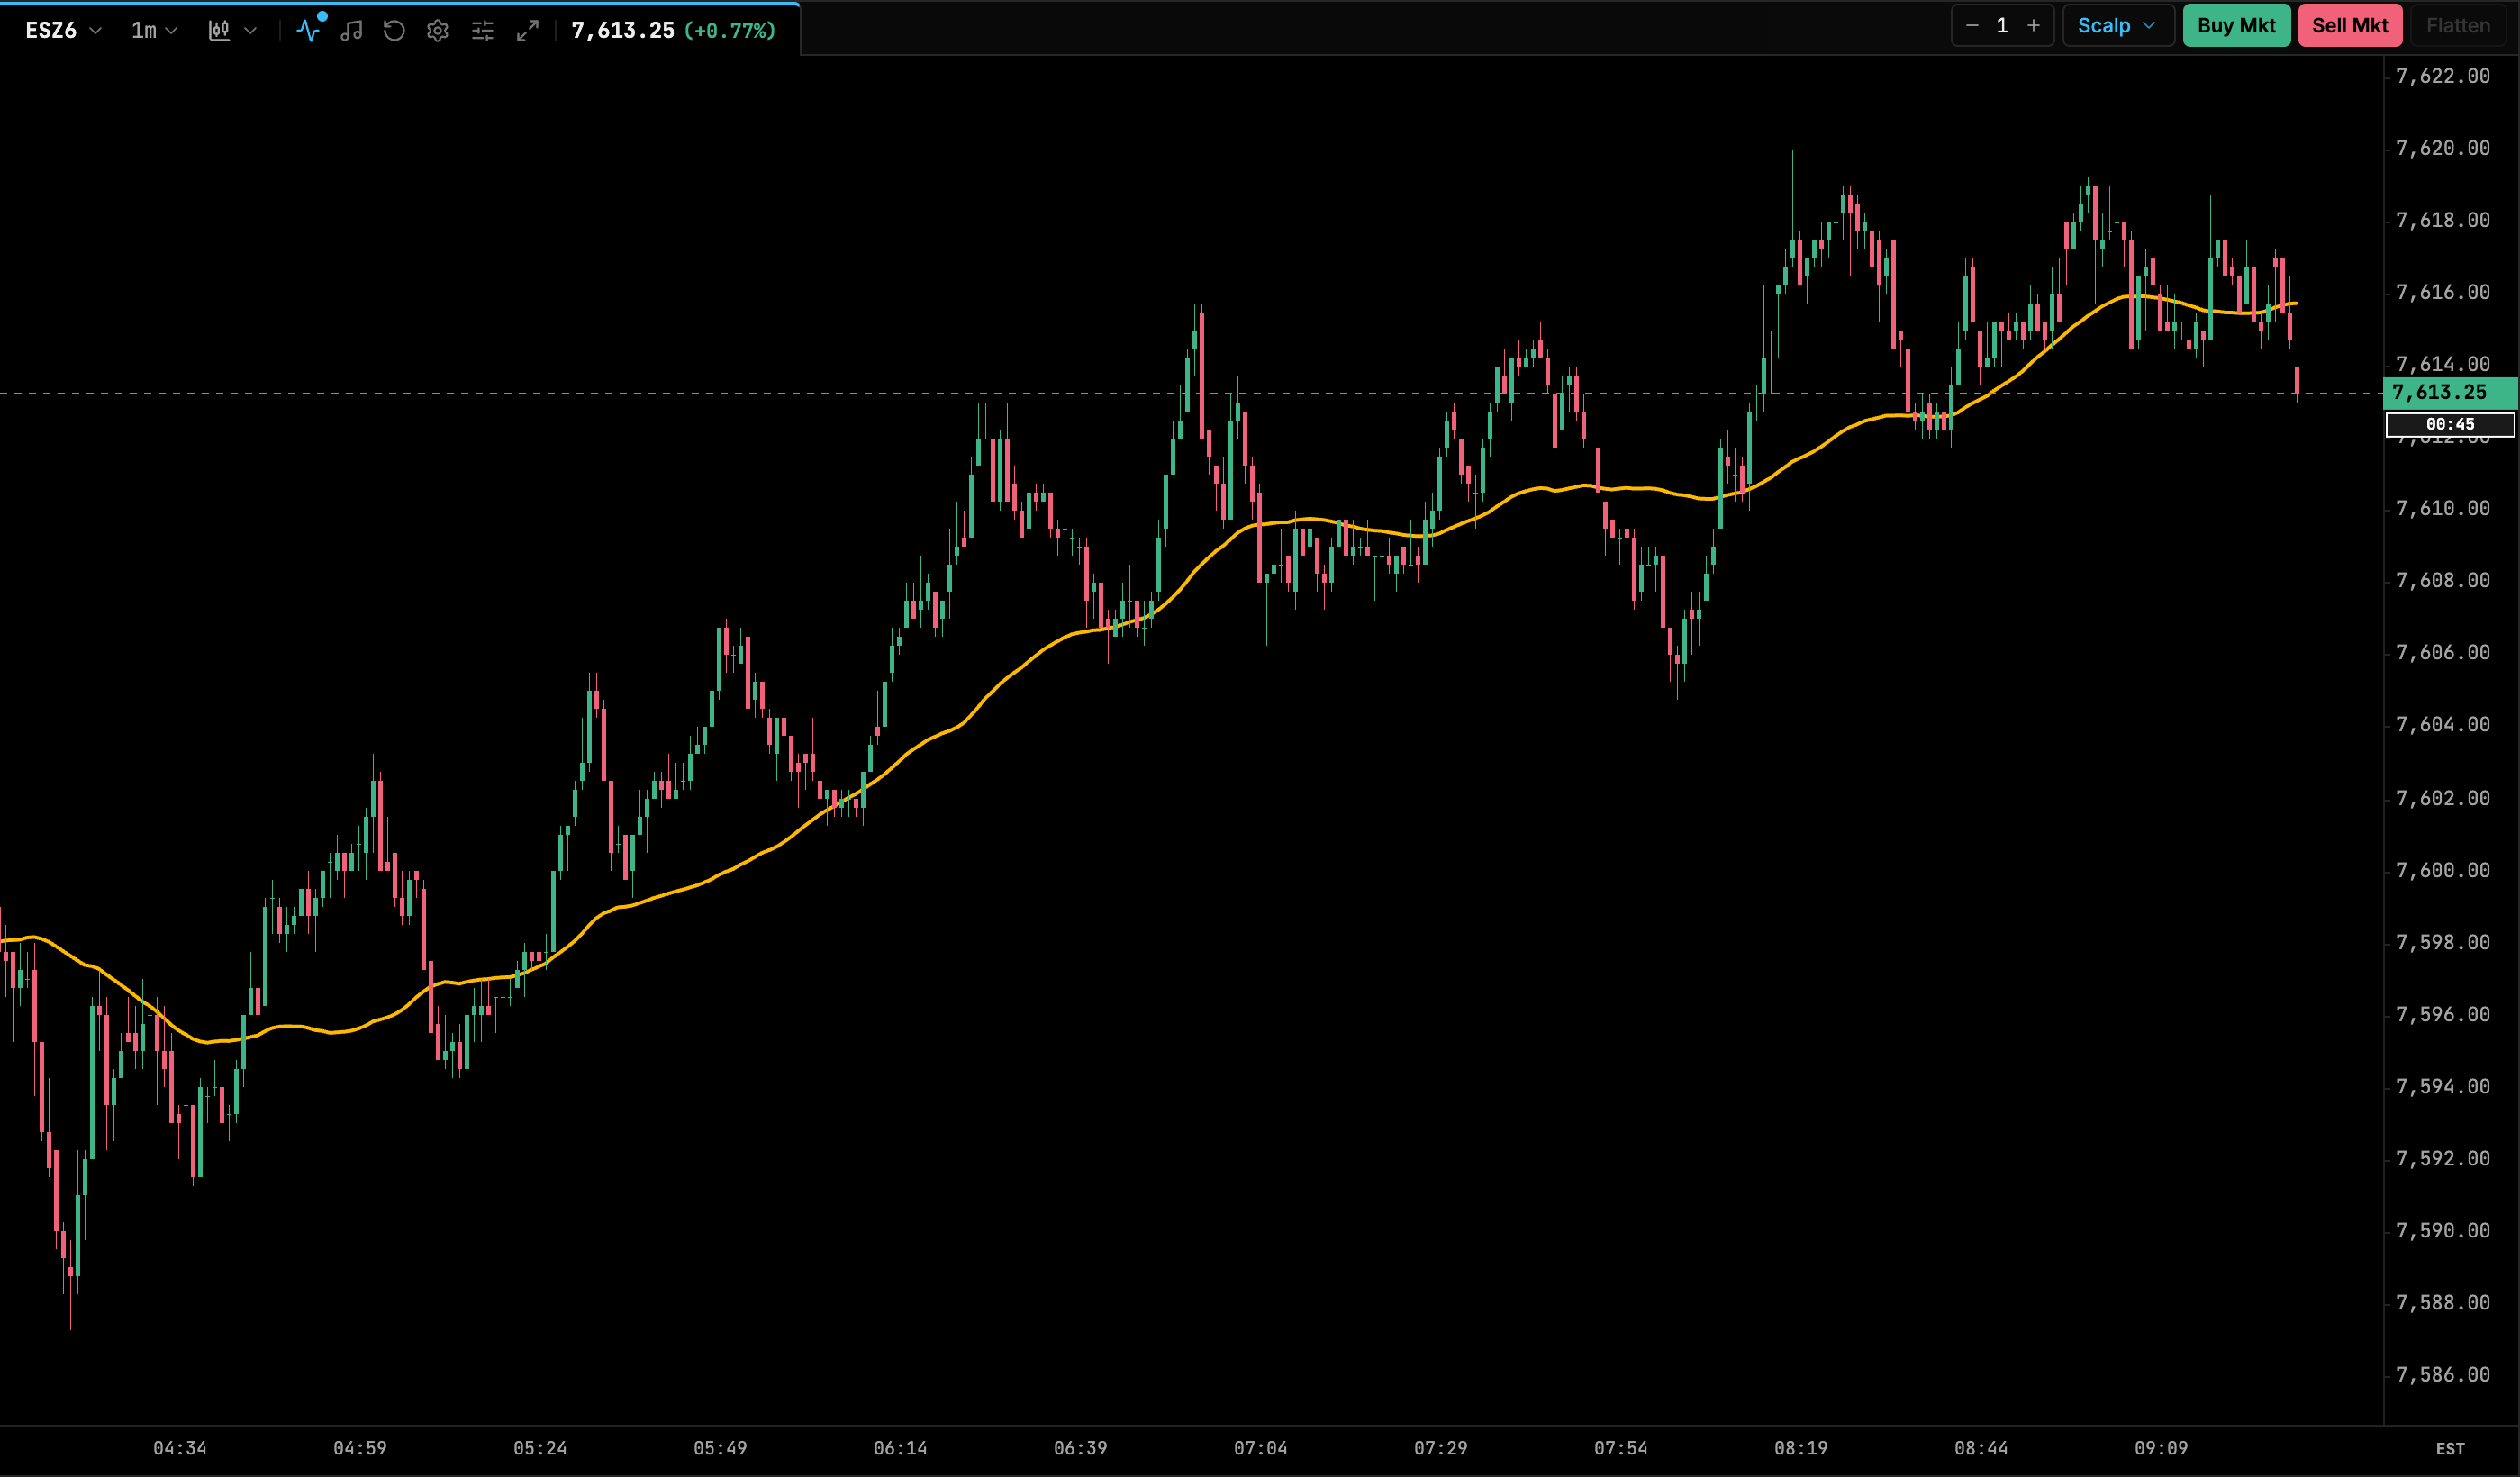
| Setting | Default | Range / options | Notes |
|---|---|---|---|
| Length / Period | 50 |
1–500 | |
| Line Color | #FFB800 |
color | |
| Line Thickness | 2 |
1–5 (step 1) |
Hull Moving Average
Alan Hull’s low-lag average. It takes a weighted moving average of 2 × WMA(n/2) − WMA(n) over √n bars, which stays smooth but turns much sooner than an EMA or SMA. It’s useful for catching short-term trend turns.
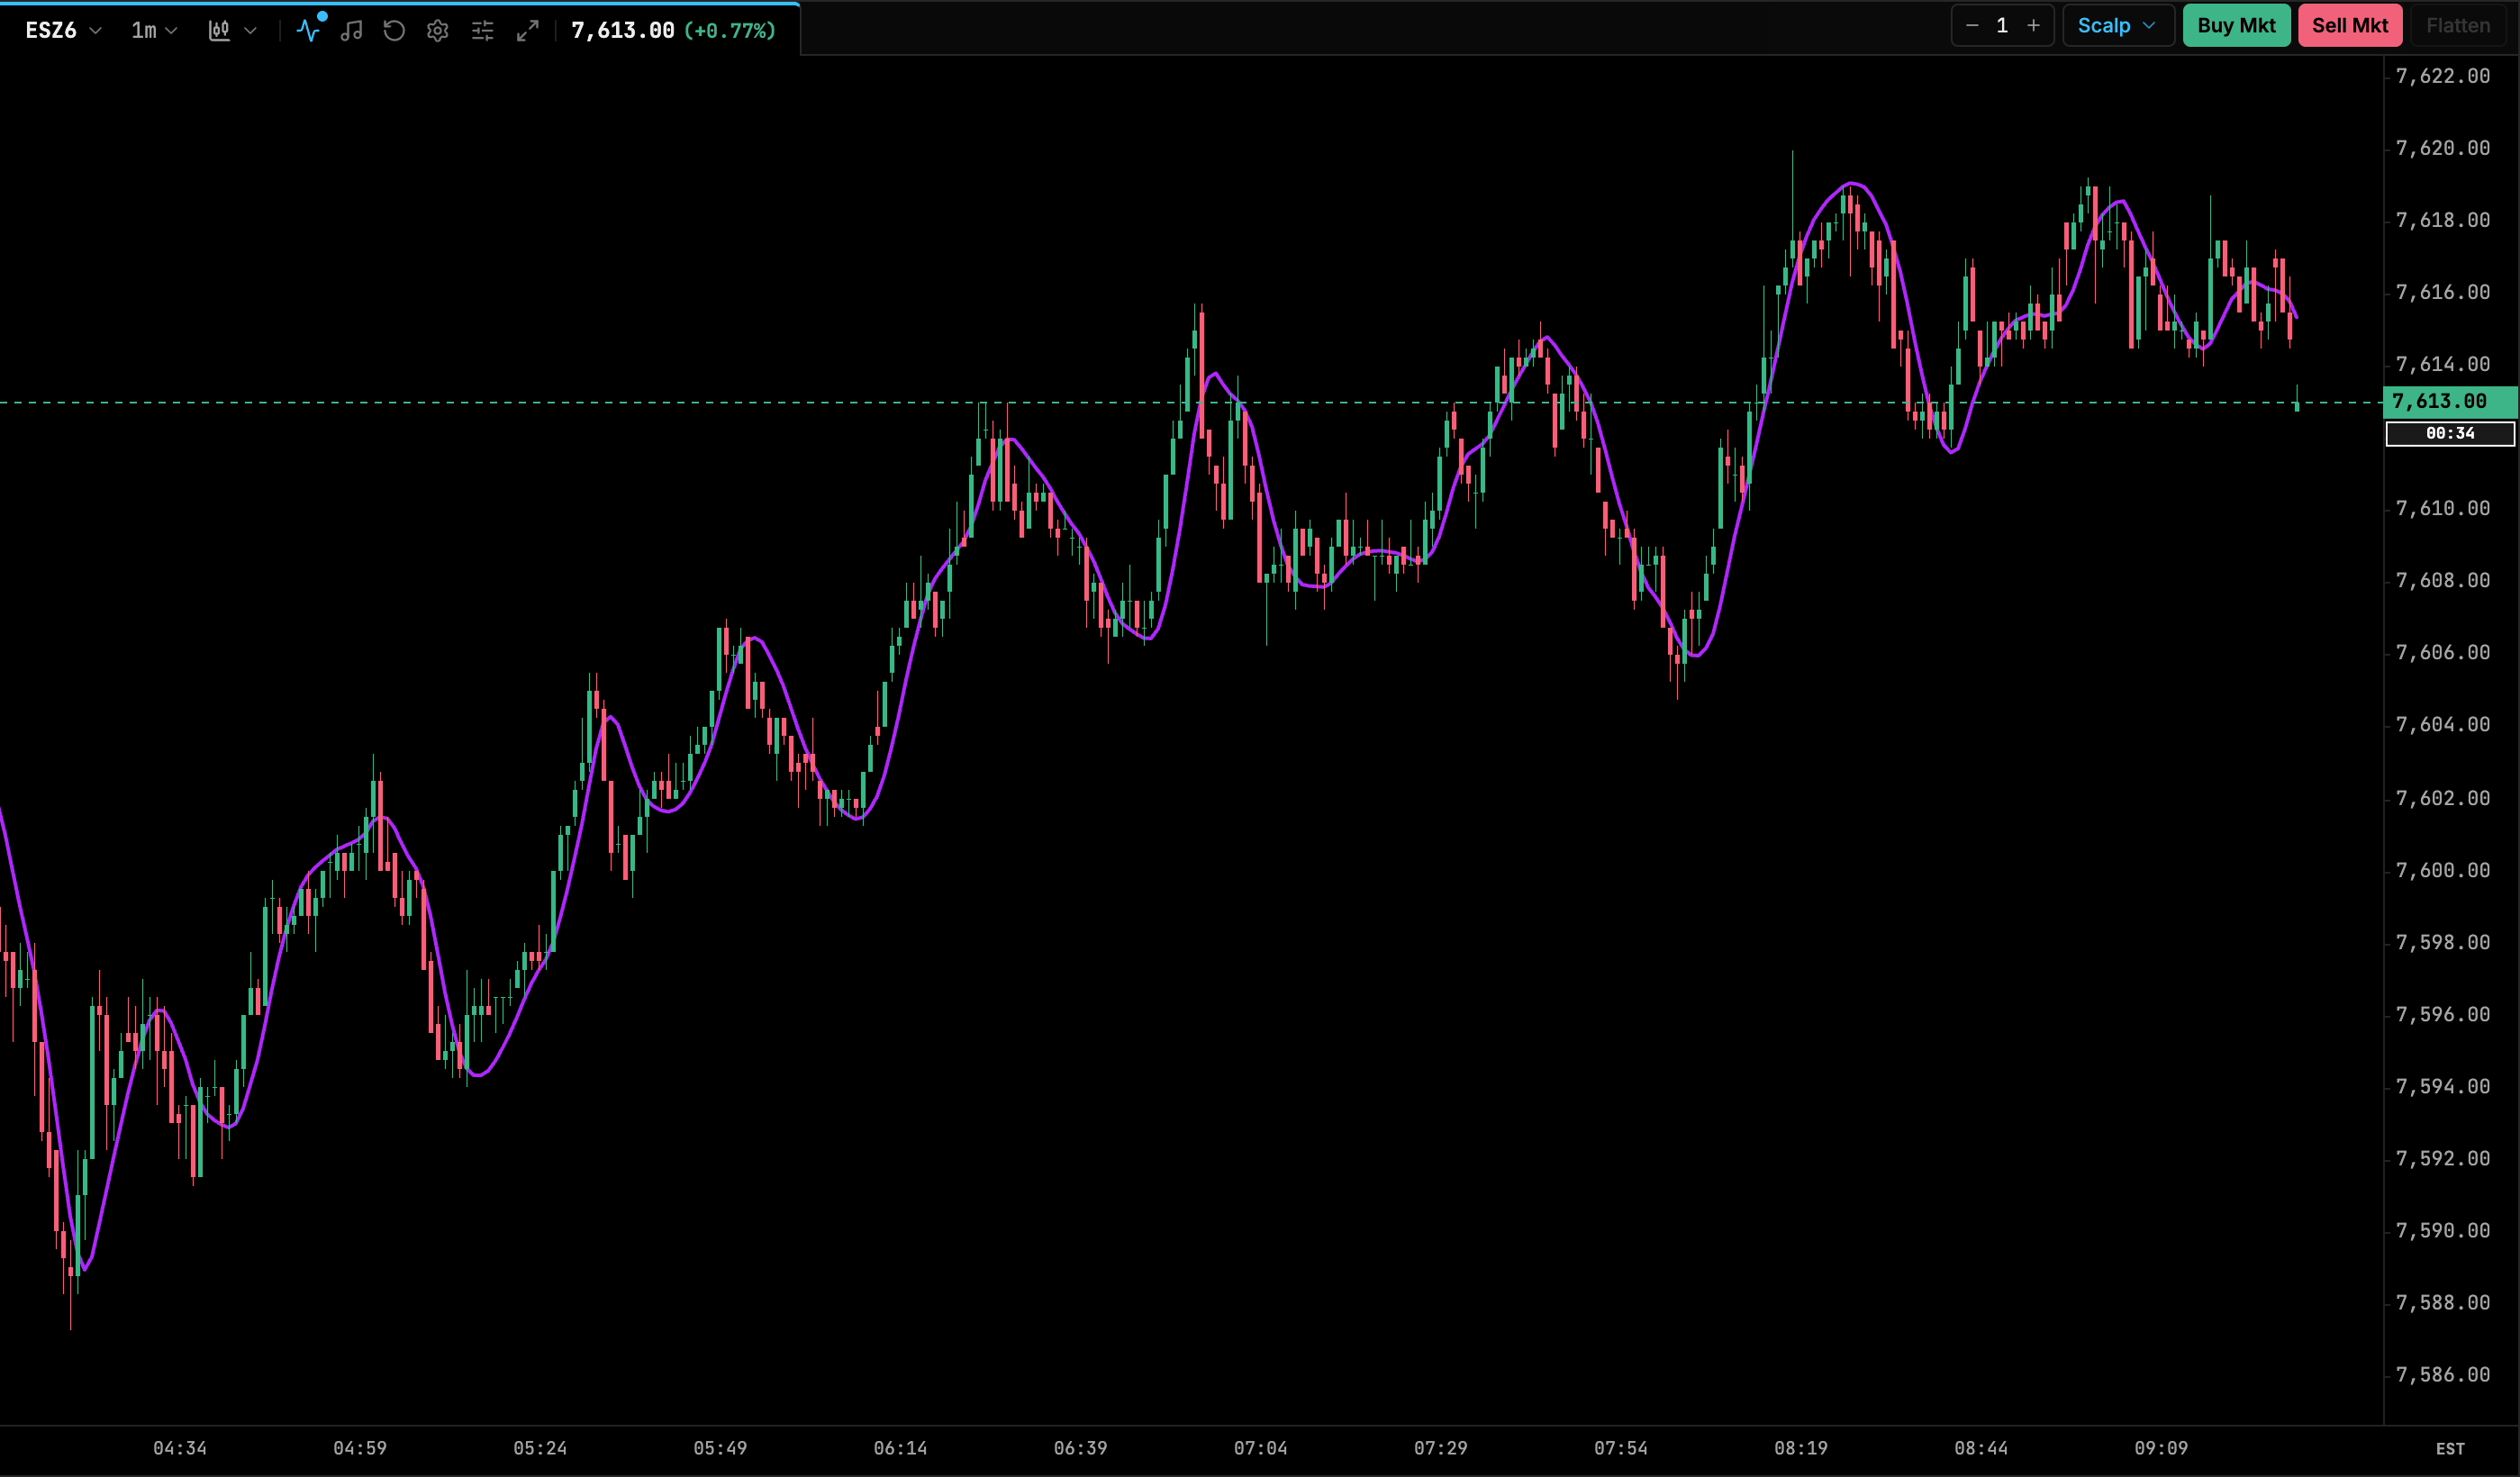
| Setting | Default | Range / options | Notes |
|---|---|---|---|
| Length / Period | 20 |
2–500 | |
| Price Source | Close | Close, HL/2 (Median), HLC/3 (Typical) | Price the average is computed from. |
| Line Color | #B026FF |
color | |
| Line Thickness | 2 |
1–5 (step 0.5) |
Weighted Moving Average
A linearly weighted average: the newest bar has weight N, the one before it N−1, and so on. Its responsiveness sits between an SMA and an EMA.
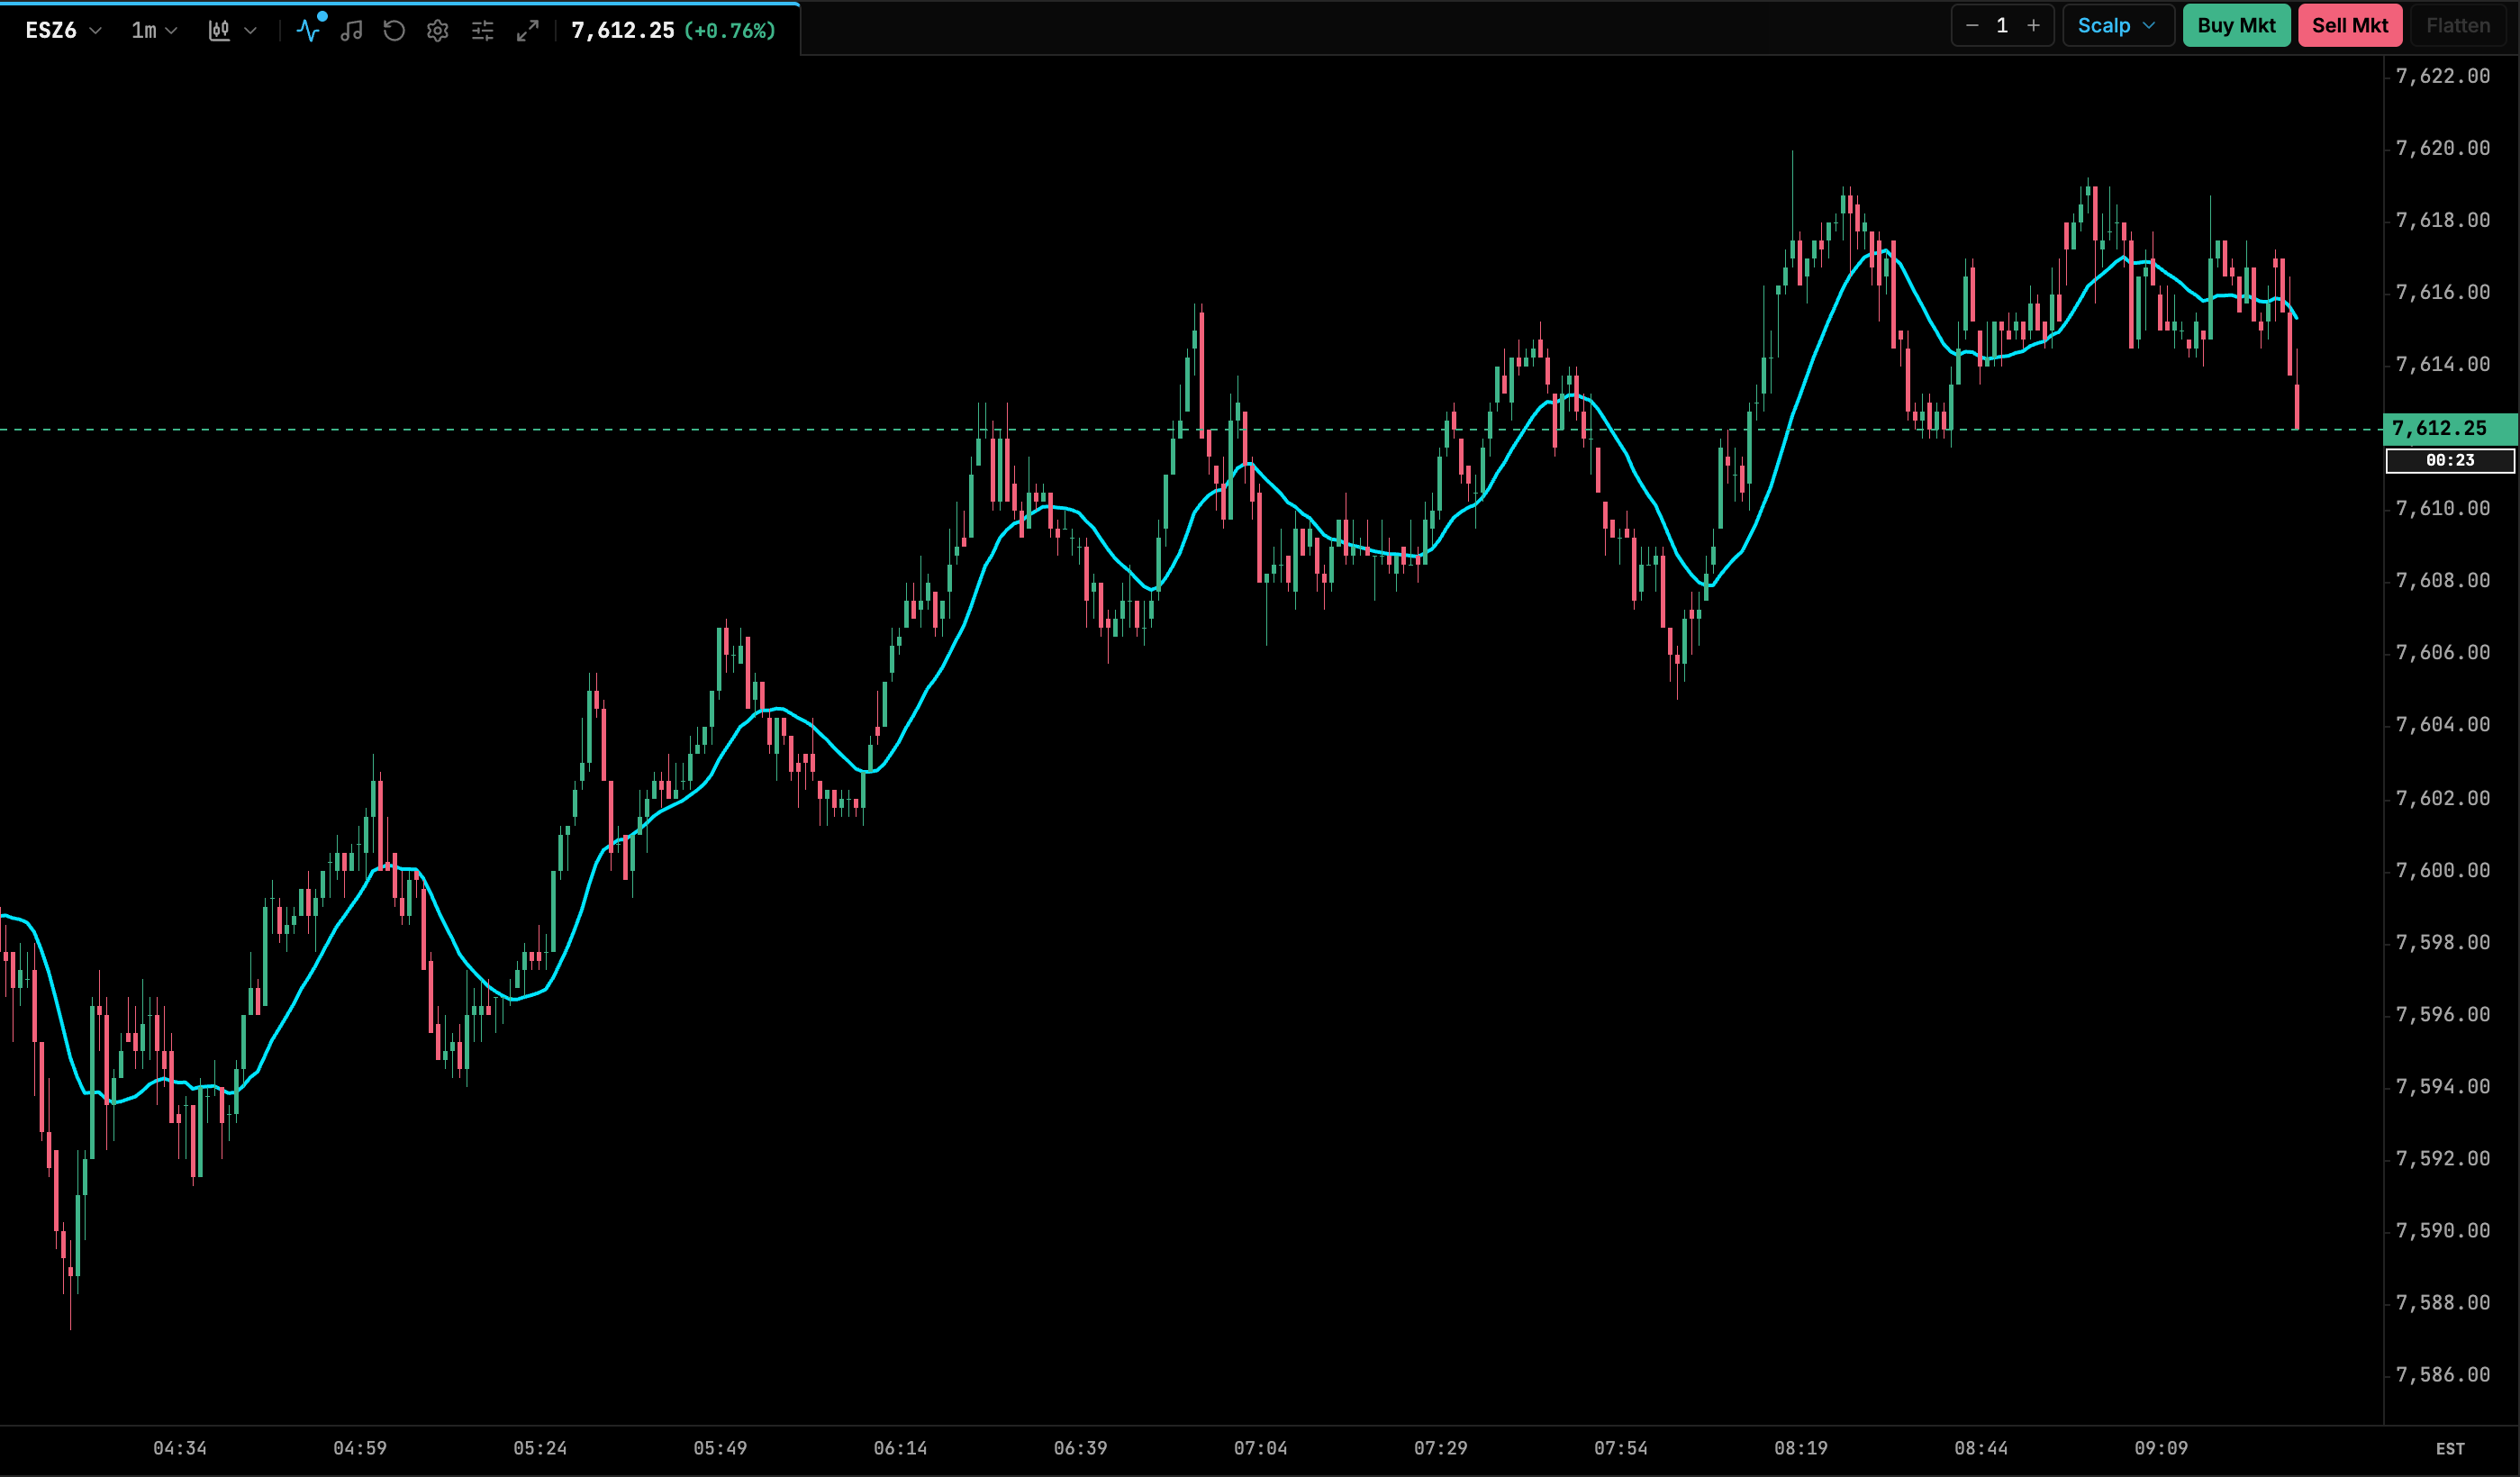
| Setting | Default | Range / options | Notes |
|---|---|---|---|
| Length / Period | 20 |
1–500 | |
| Price Source | Close | Close, HL/2 (Median), HLC/3 (Typical) | |
| Line Color | #00E5FF |
color | |
| Line Thickness | 2 |
1–5 (step 0.5) |
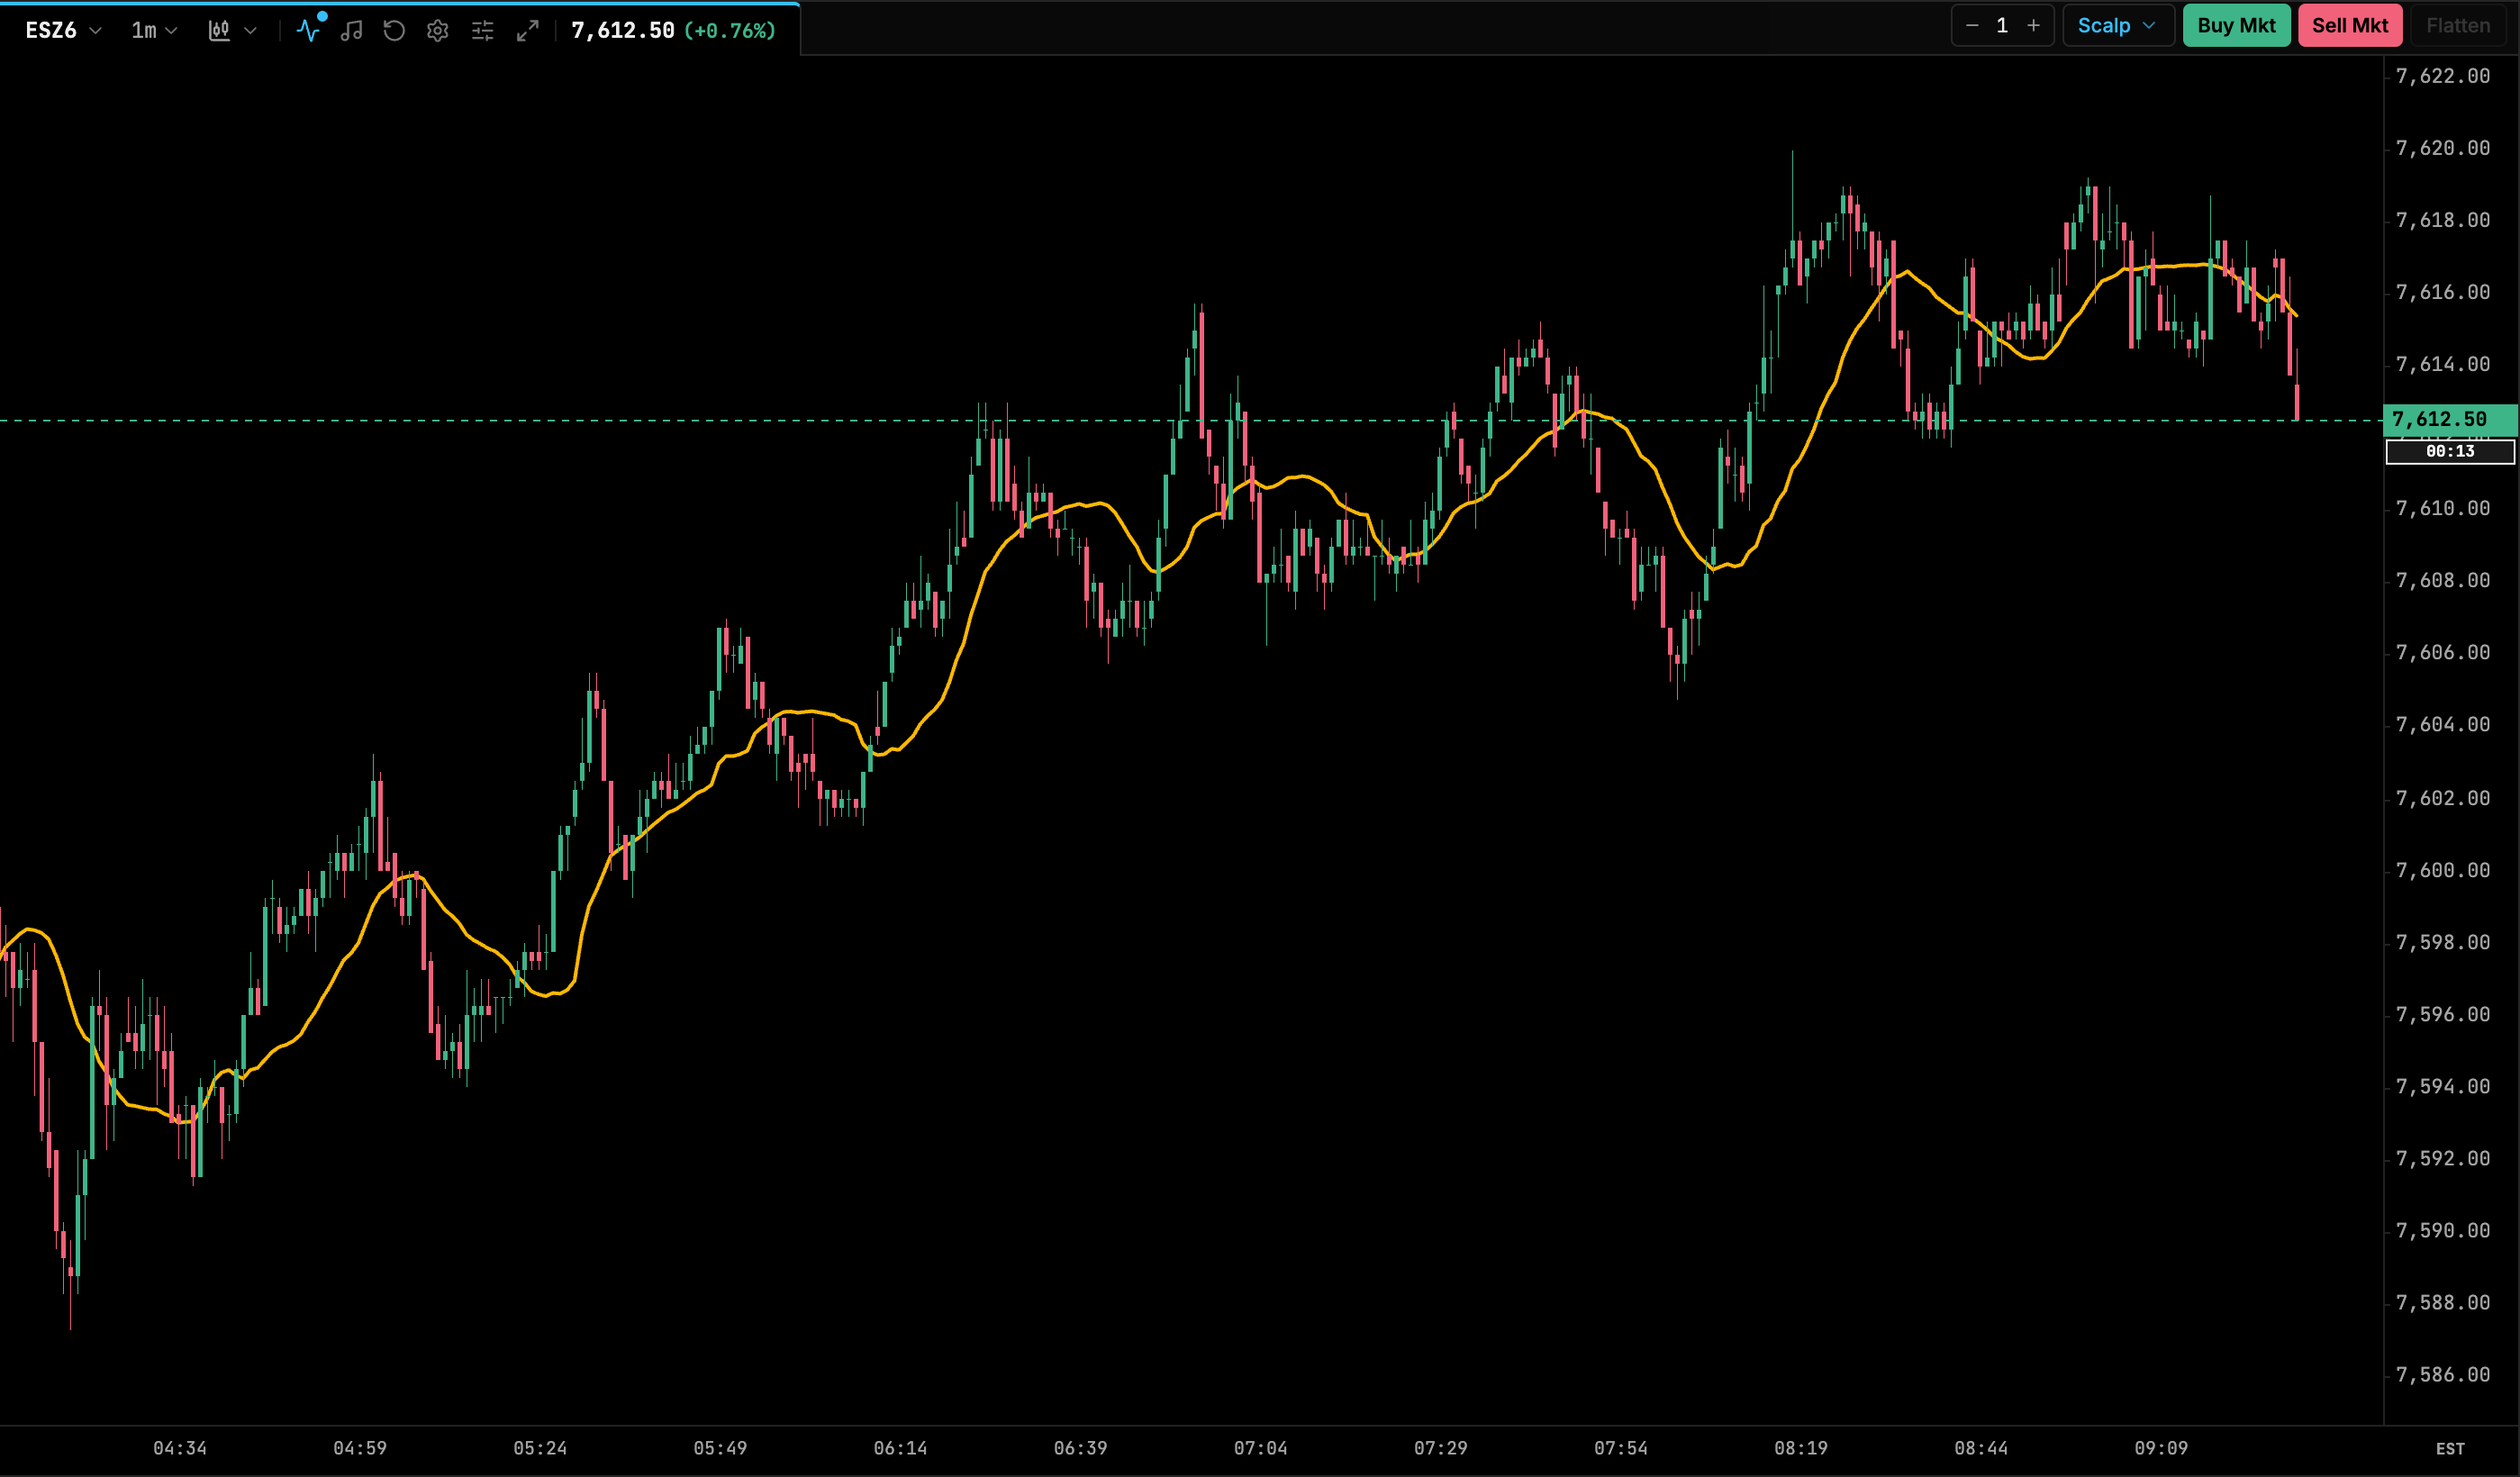
Volume-Weighted Moving Average
A moving average where each bar’s price is weighted by its volume, so high-volume bars pull the line harder than quiet ones. When the VWMA sits above an SMA of the same length, volume is concentrated in up moves, and vice versa. Unlike VWAP, it is a rolling N-bar window and never resets.
| Setting | Default | Range / options | Notes |
|---|---|---|---|
| Length / Period | 20 |
1–500 | |
| Price Source | Close | Close, HL/2 (Median), HLC/3 (Typical) | |
| Line Color | #FFB800 |
color | |
| Line Thickness | 2 |
1–5 (step 0.5) |
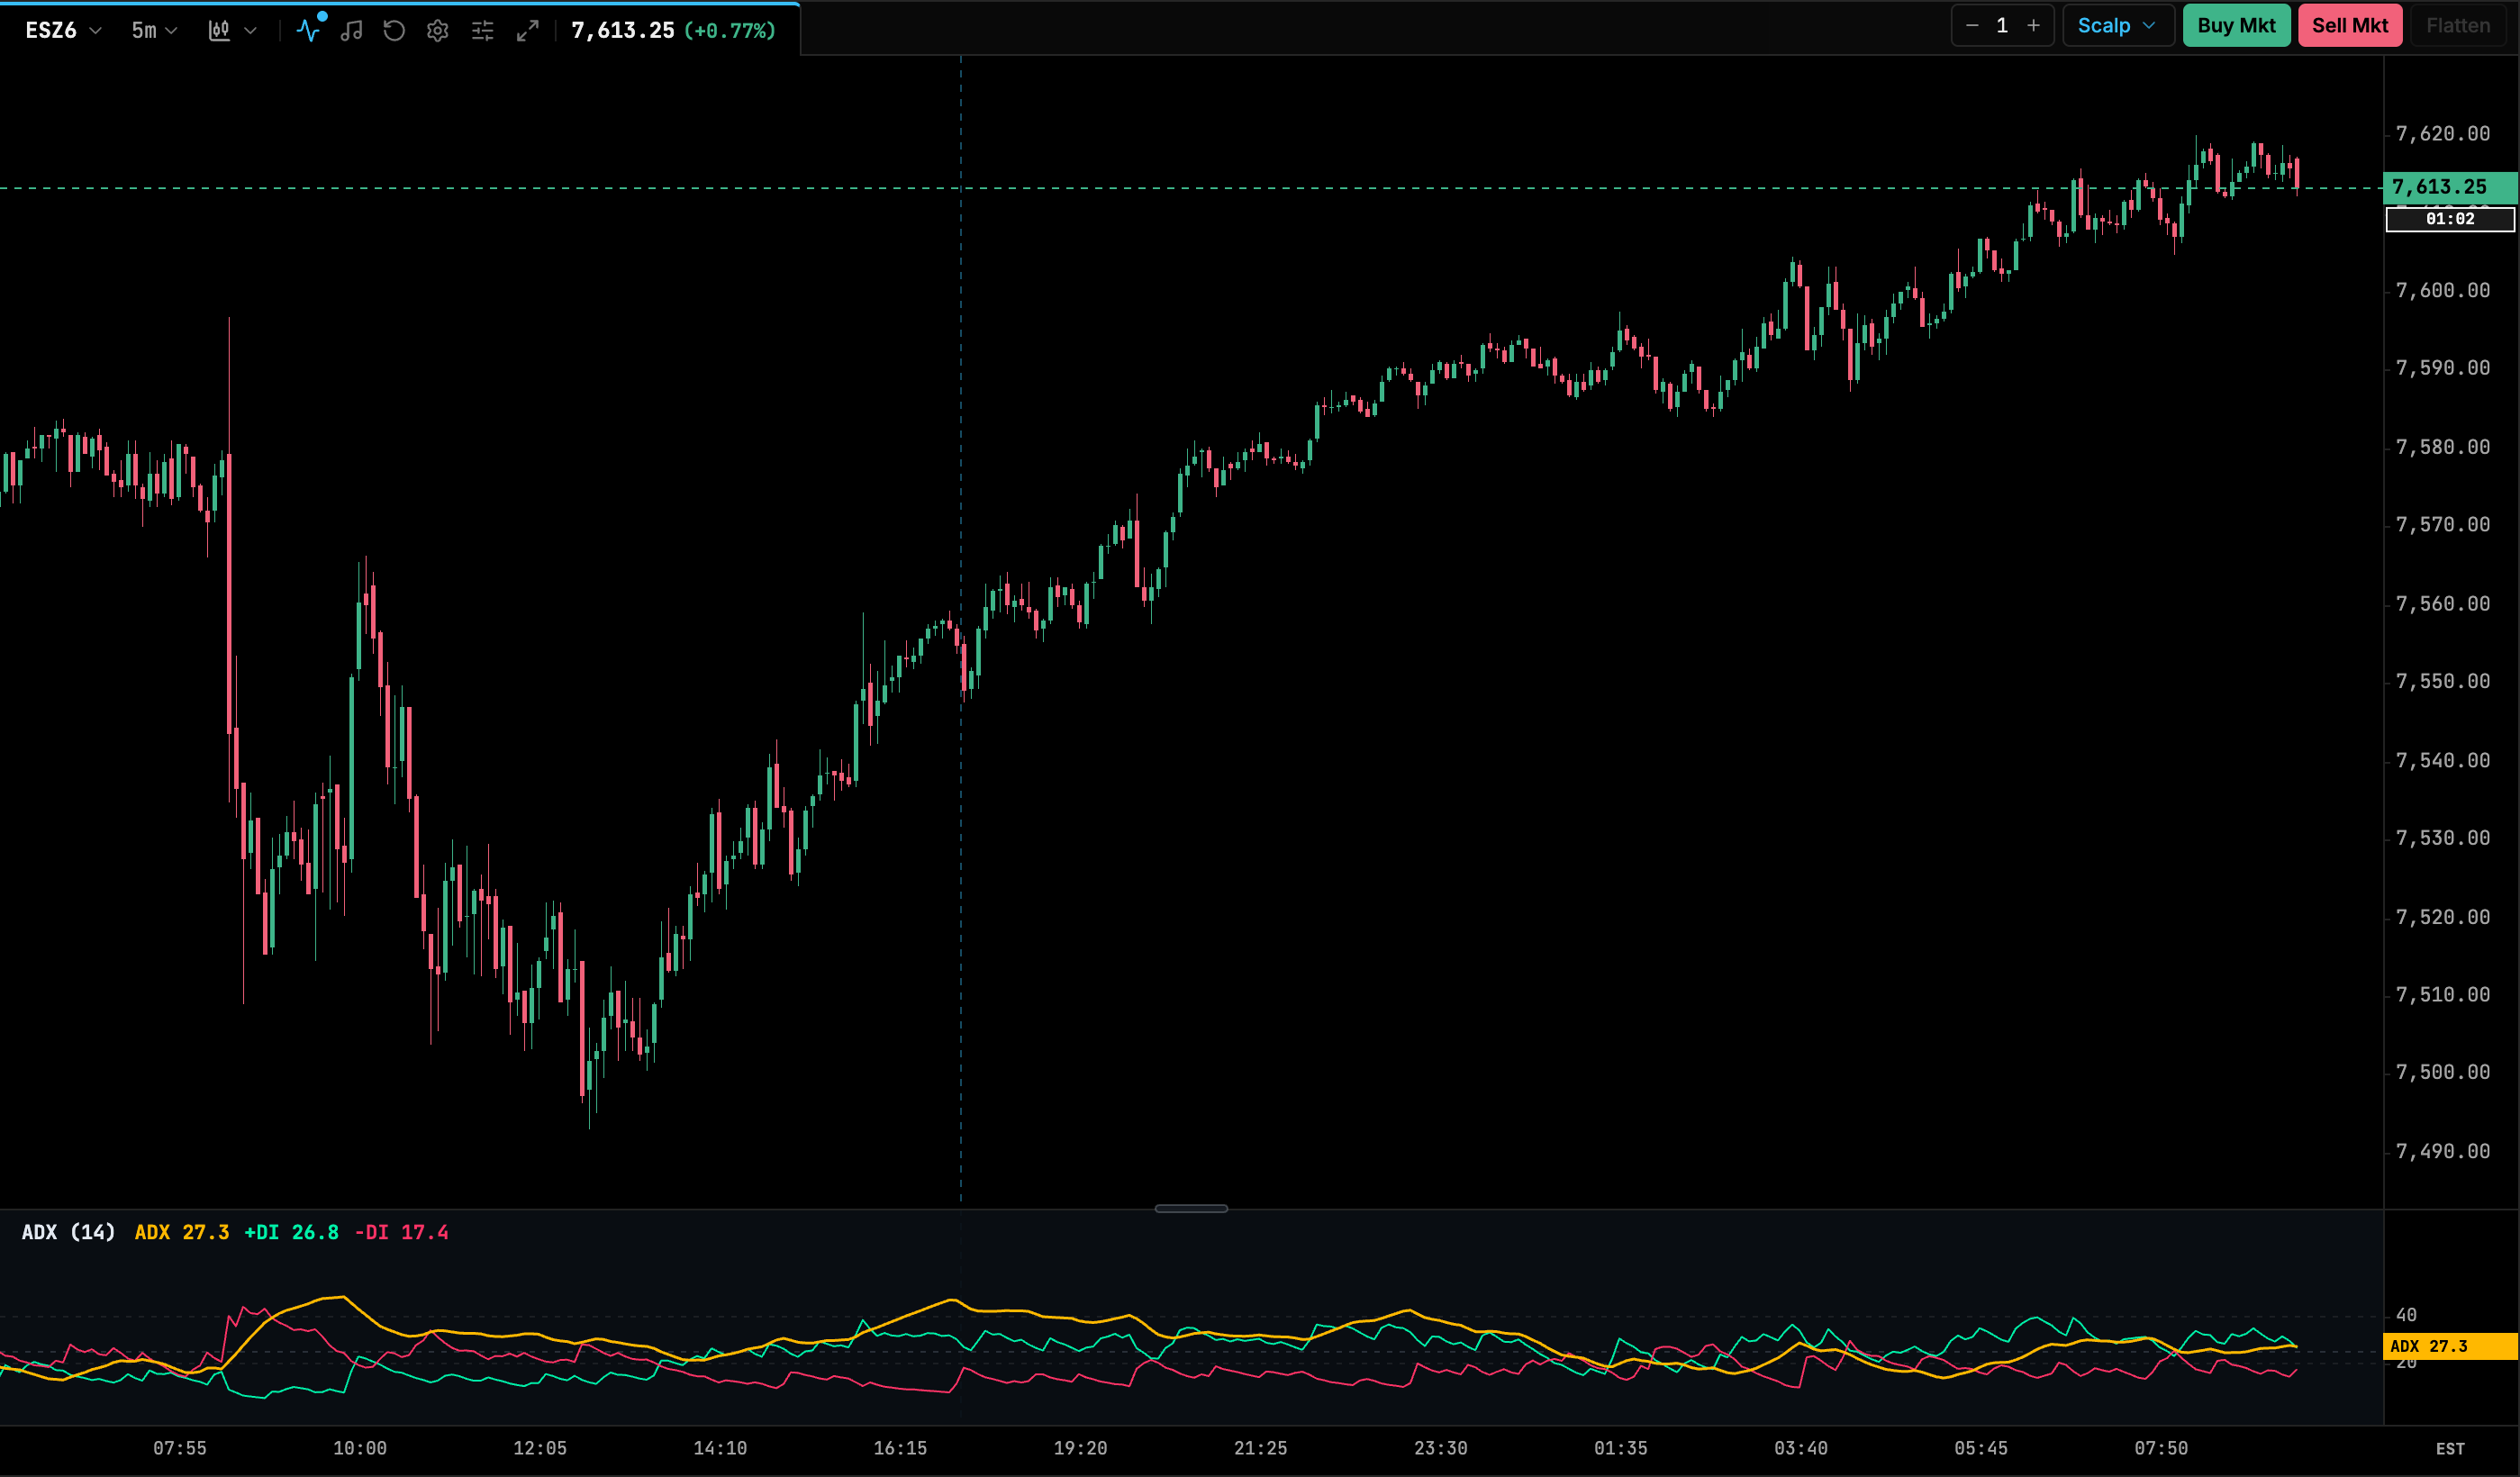
Average Directional Index
Welles Wilder’s directional movement system. The ADX line measures trend strength without regard to direction. The +DI and −DI lines show direction. A reference line marks the trend key level: ADX above it means a trending market, and below it means a range. +DI crossing above −DI is a bullish cue, and the reverse is bearish.
| Setting | Default | Range / options | Notes |
|---|---|---|---|
| Length / Period | 14 |
2–100 | Smoothing period for directional movement and ADX. |
| Trend Key Level | 25 |
10–50 | Threshold line. 20 or 25 is typical. |
| ADX Line Color | #FFB800 |
color | |
| +DI Line Color | #00F0A8 |
color | |
| -DI Line Color | #FF3366 |
color | |
| Line Thickness | 1.5 |
1–4 (step 0.5) | |
| Show +DI / -DI Lines | On | on / off | Turn off to show the ADX line only. |
Ichimoku Cloud
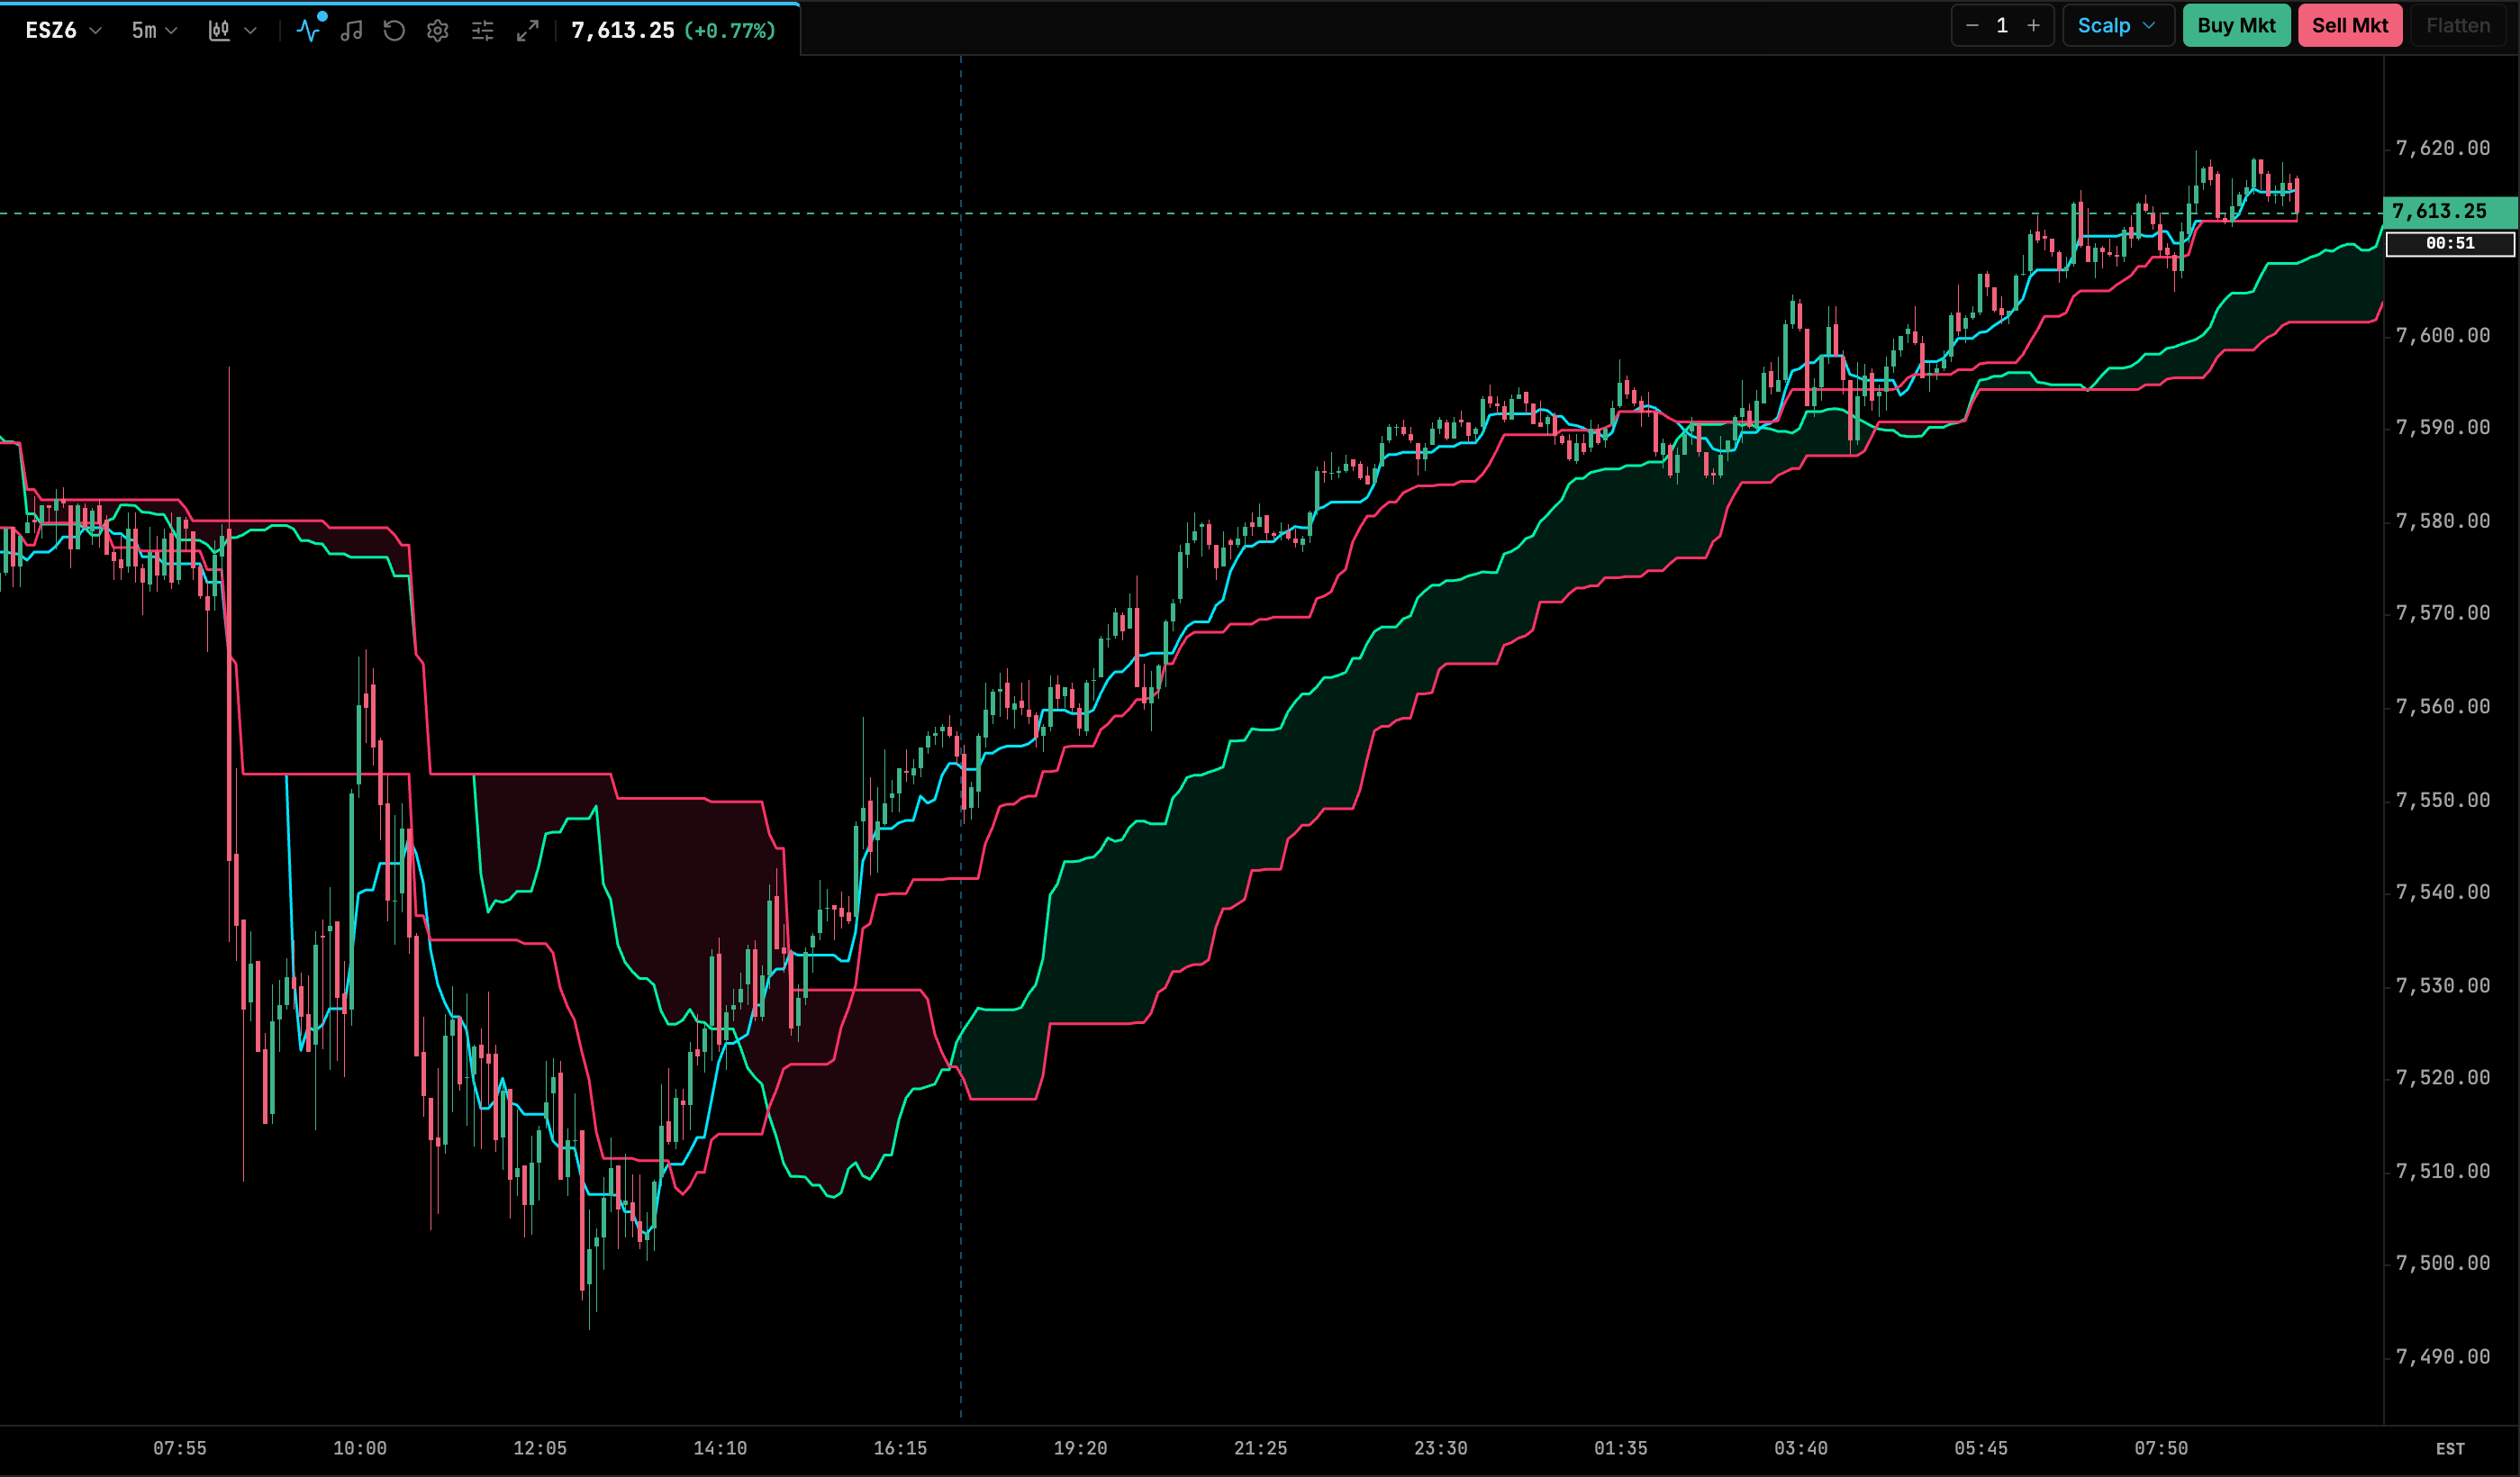
A complete trend system in one overlay:
- Tenkan-sen (conversion line) and Kijun-sen (base line) are midpoints of the high/low range over their periods.
- Senkou Span A and B form the Kumo cloud, which is projected forward by the displacement. The cloud is shaded bullish when Span A is above Span B and bearish when it is below.
- Chikou Span is the close plotted back by the displacement. It is off by default.
Price above the cloud is a bullish bias and below it is bearish. Tenkan/Kijun crosses and cloud edges act as signals and support/resistance.
| Setting | Default | Range / options | Notes |
|---|---|---|---|
| Conversion Line (Tenkan-sen) | 9 |
1–50 | |
| Base Line (Kijun-sen) | 26 |
1–100 | |
| Leading Span B (Senkou Span B) | 52 |
1–200 | |
| Displacement / Cloud Offset | 26 |
1–100 | Bars the cloud is shifted forward (and Chikou back). |
| Show Tenkan-sen | On | on / off | |
| Show Kijun-sen | On | on / off | |
| Show Senkou Span A | On | on / off | |
| Show Senkou Span B | On | on / off | |
| Show Chikou Span | Off | on / off | |
| Show Kumo Cloud Fill | On | on / off | |
| Tenkan-sen Color | #00E5FF |
color | |
| Kijun-sen Color | #FF3366 |
color | |
| Senkou Span A Color | #00F0A8 |
color | |
| Senkou Span B Color | #FF3366 |
color | |
| Chikou Span Color | #B026FF |
color | |
| Line Width | 1.5 |
1–4 (step 0.5) |
The cloud fill colors (bullish and bearish) come from the theme and have no setting in the dialog.
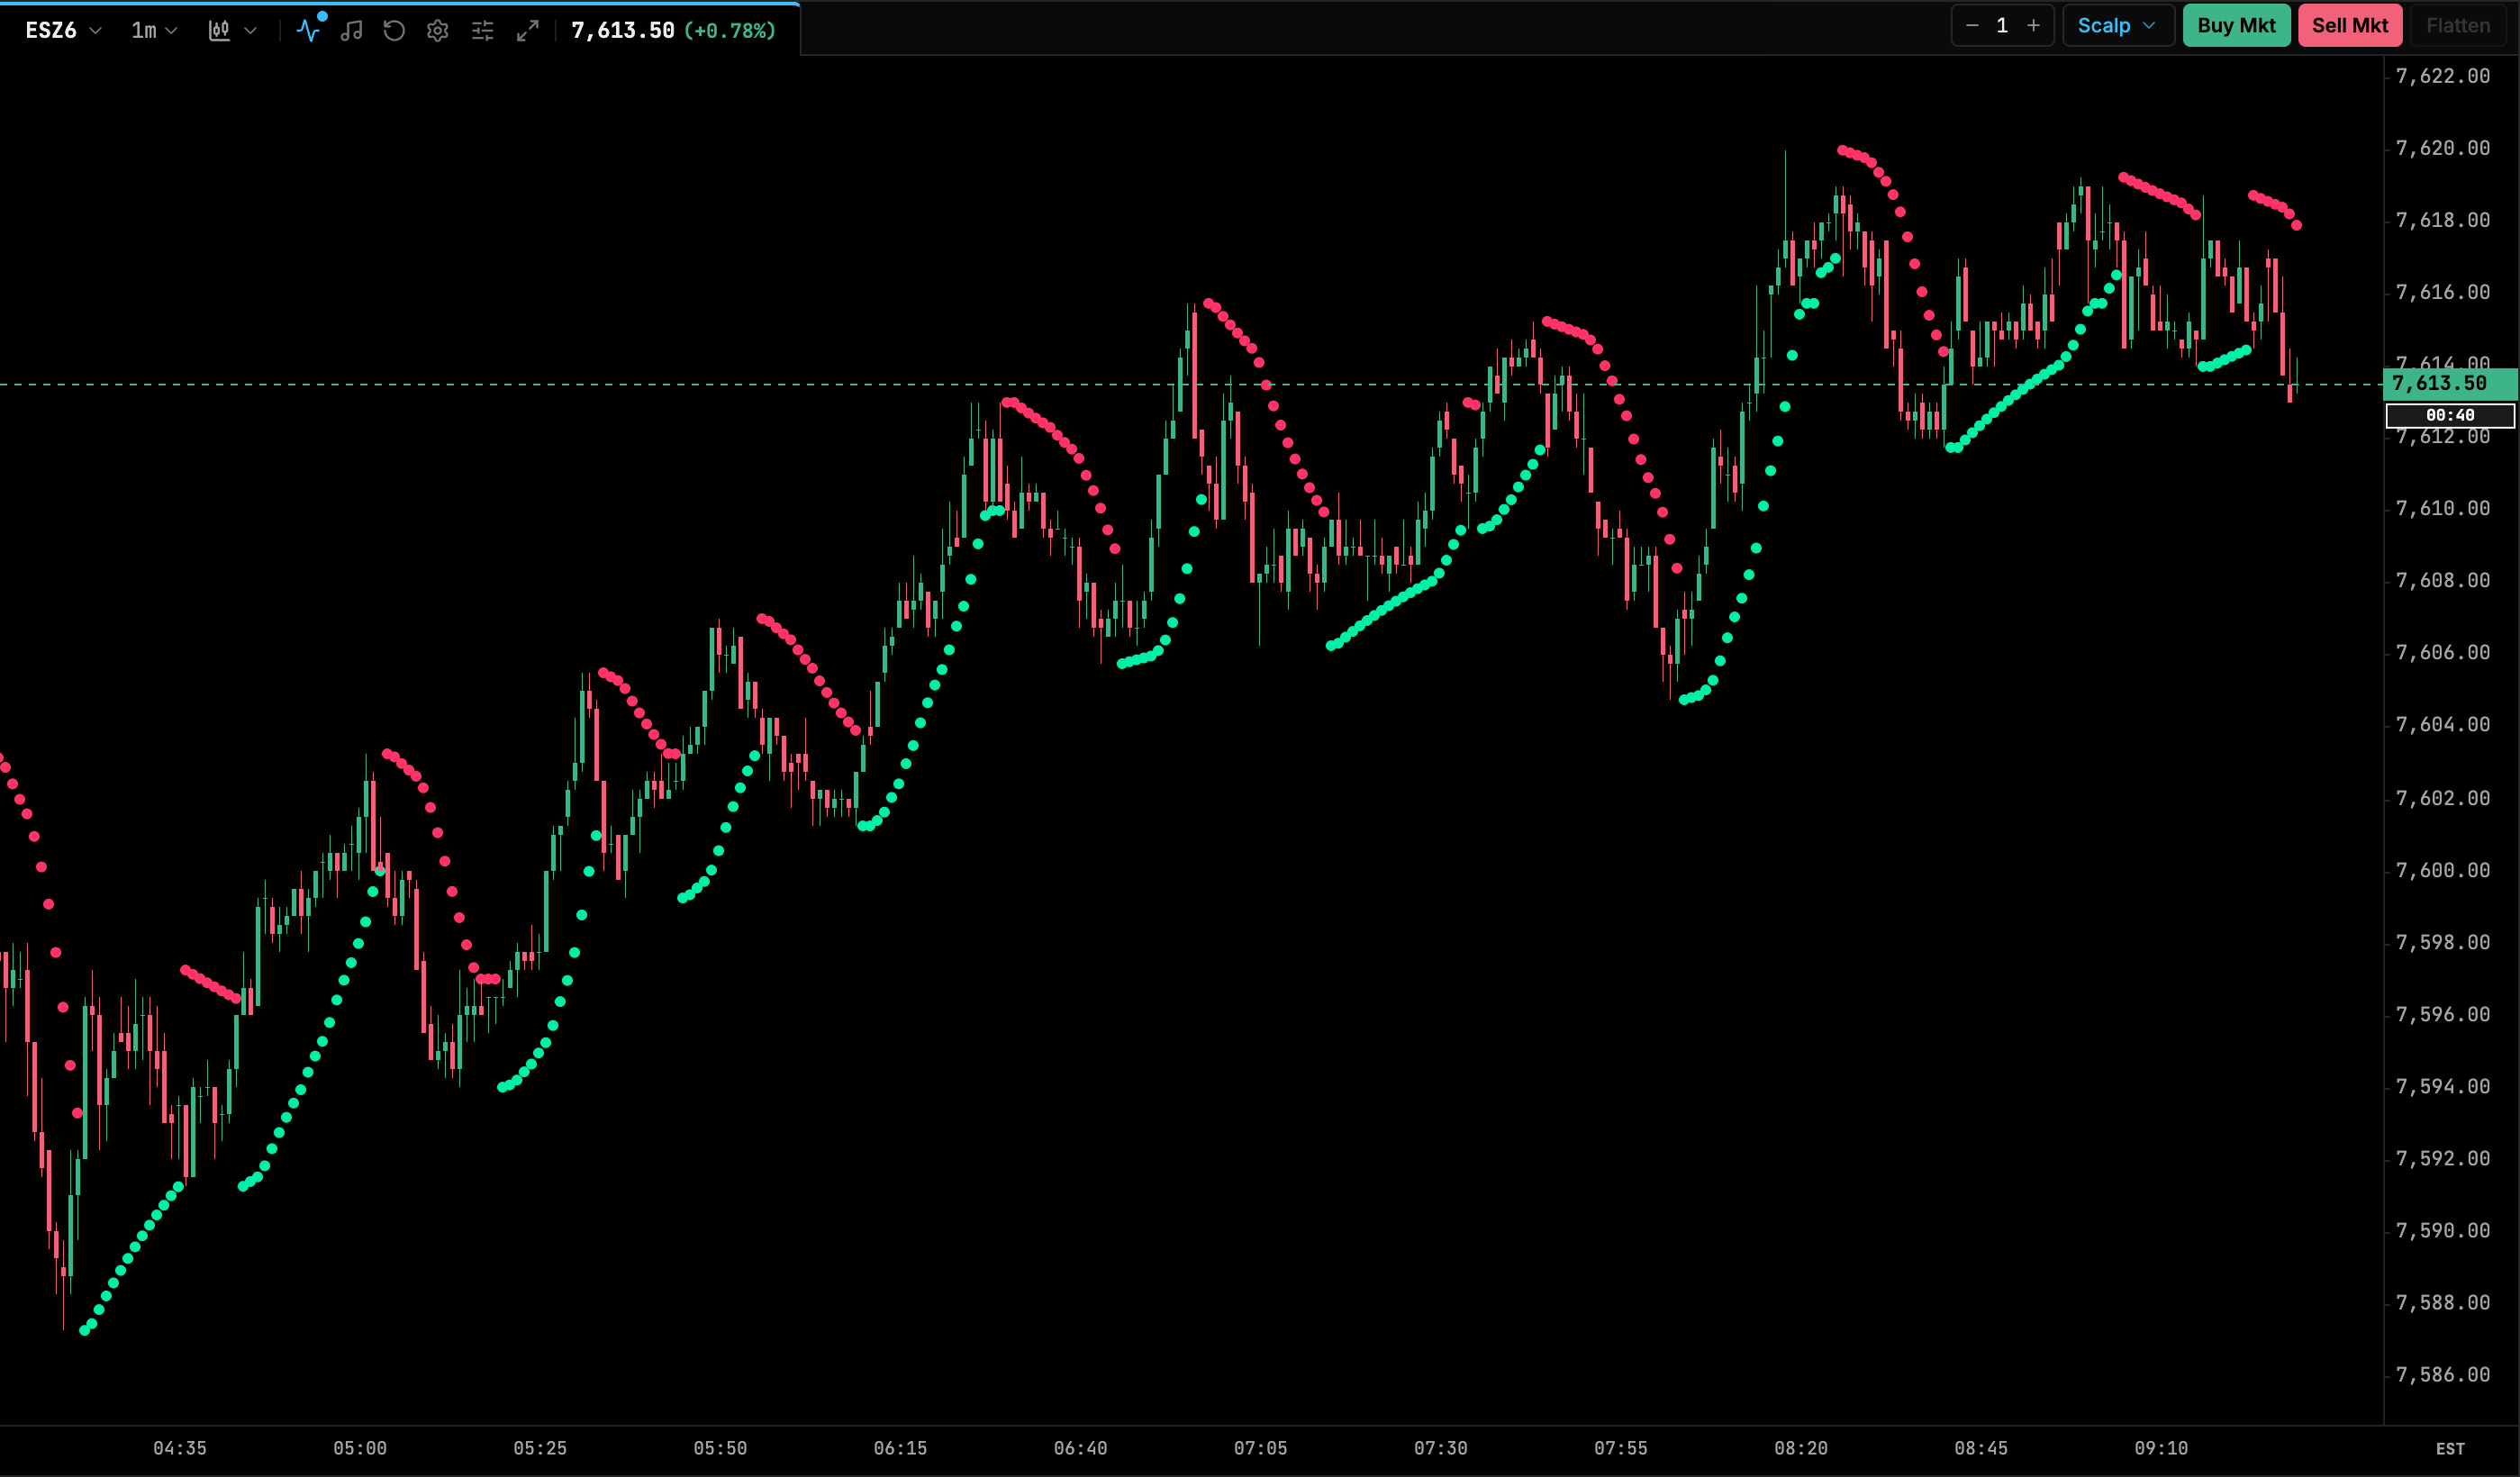
Parabolic SAR
Wilder’s Stop And Reverse. It draws a dot under price in an uptrend and over price in a downtrend. The dots accelerate toward price as the trend extends, and they flip sides when price crosses them. Traders use it as a trailing stop and as a simple trend-reversal signal.
| Setting | Default | Range / options | Notes |
|---|---|---|---|
| Start Acceleration Factor | 0.02 |
0.005–0.1 (step 0.005) | Acceleration factor at the start of each trend. |
| Step Acceleration Factor | 0.02 |
0.005–0.1 (step 0.005) | Added each time the trend makes a new extreme. |
| Max Acceleration Factor | 0.2 |
0.05–0.5 (step 0.01) | Cap on the acceleration factor. |
| Bullish (Long) Dot Color | #00F0A8 |
color | |
| Bearish (Short) Dot Color | #FF3366 |
color | |
| Marker Size (px) | 3 |
1.5–6 (step 0.5) |
Supertrend
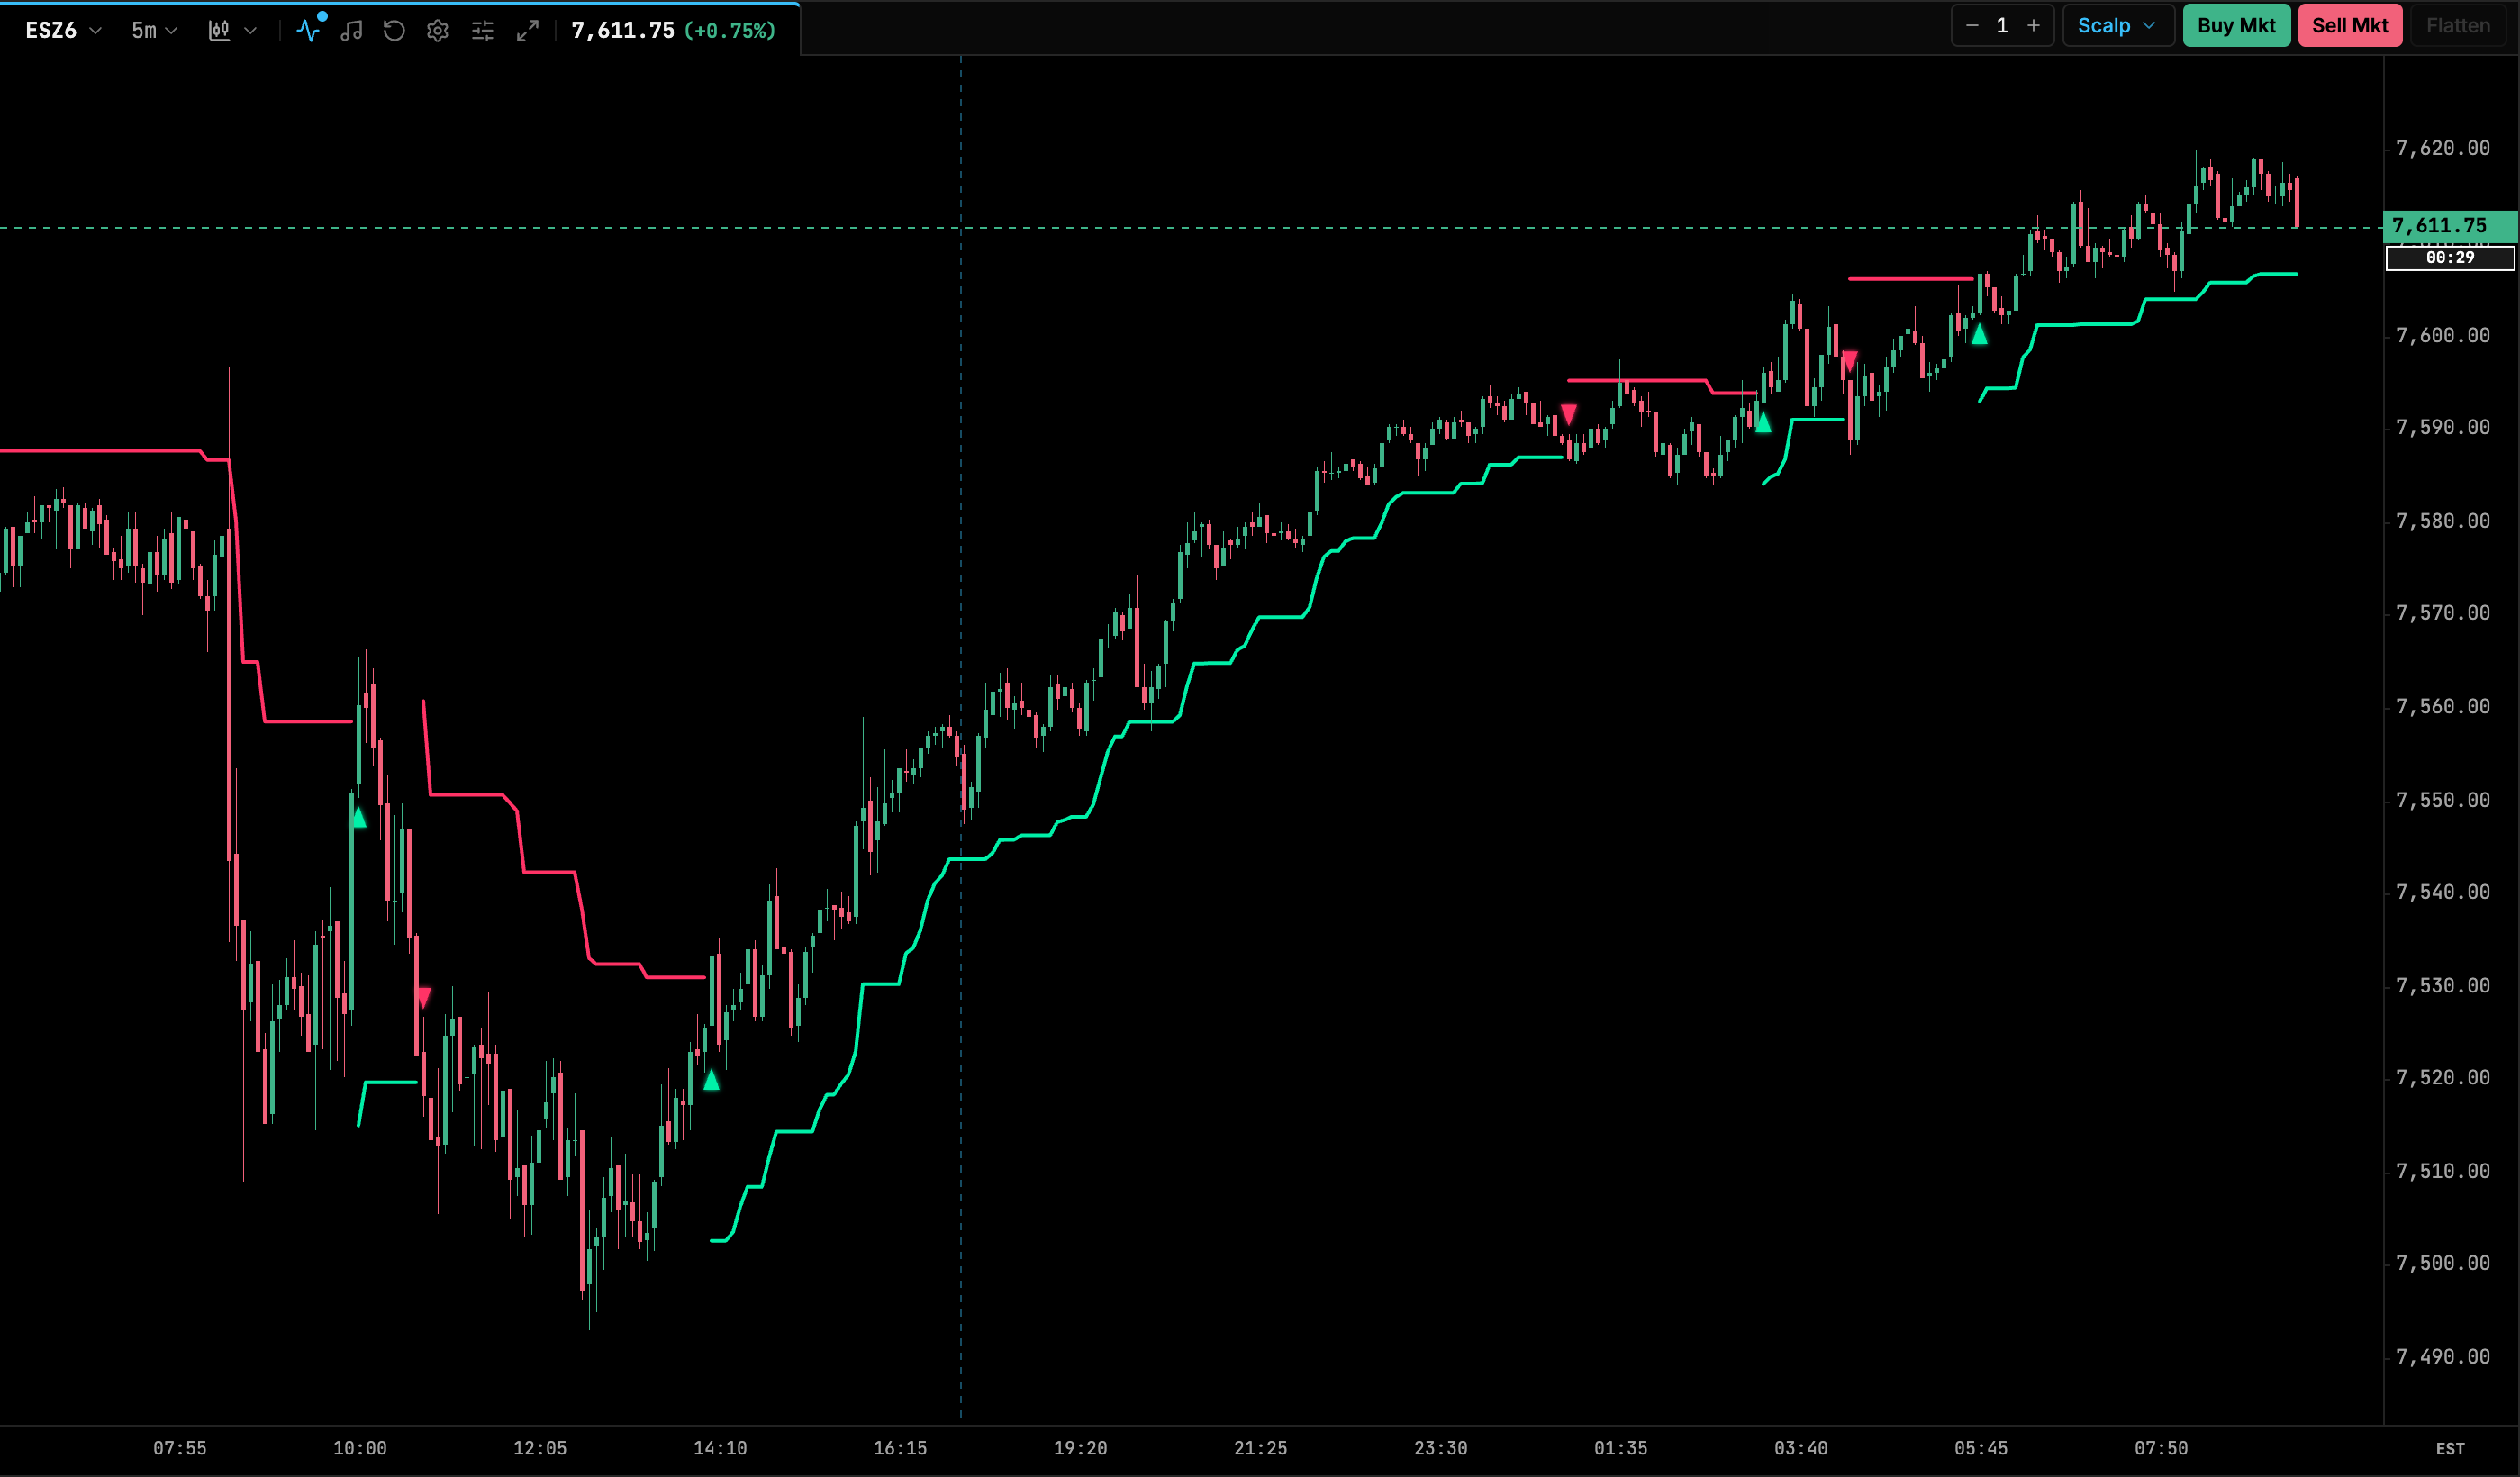
An ATR-based trailing line. It sits below price in an uptrend and above price in a downtrend, at the median price (HL/2) ∓ multiplier × ATR. It only ratchets in the trend’s direction. When the close crosses the line, the trend flips, the line changes color, and an optional Buy/Sell marker is drawn. It’s popular as a trend filter and as a volatility-adjusted trailing stop.
| Setting | Default | Range / options | Notes |
|---|---|---|---|
| ATR Period | 10 |
1–100 | |
| ATR Multiplier | 3 |
0.5–10 (step 0.25) | Larger values mean a wider line and fewer flips. |
| Bullish Trend Color | #00F0A8 |
color | |
| Bearish Trend Color | #FF3366 |
color | |
| Line Thickness | 2 |
1–4 (step 0.5) | |
| Show Flip Signals | On | on / off | Buy/Sell markers where the trend flips. |