Indicators Overview
TickMint ships 49 built-in indicators, ranging from moving averages and oscillators to order-flow, Level 2 depth, session levels and an economic news card. You can also add your own MintScript indicators. Each chart panel keeps its own indicator list, so a 1-minute ES chart and a 5-minute NQ chart in the same layout can carry completely different studies.
Open the Indicators dialog
Click the Indicators button (the pulse icon) in a chart panel’s header. Its tooltip reads Indicators for <symbol> (N active). The dialog opens for that panel only, and its subtitle shows the panel’s symbol and timeframe (for example ESZ6 · 5m).
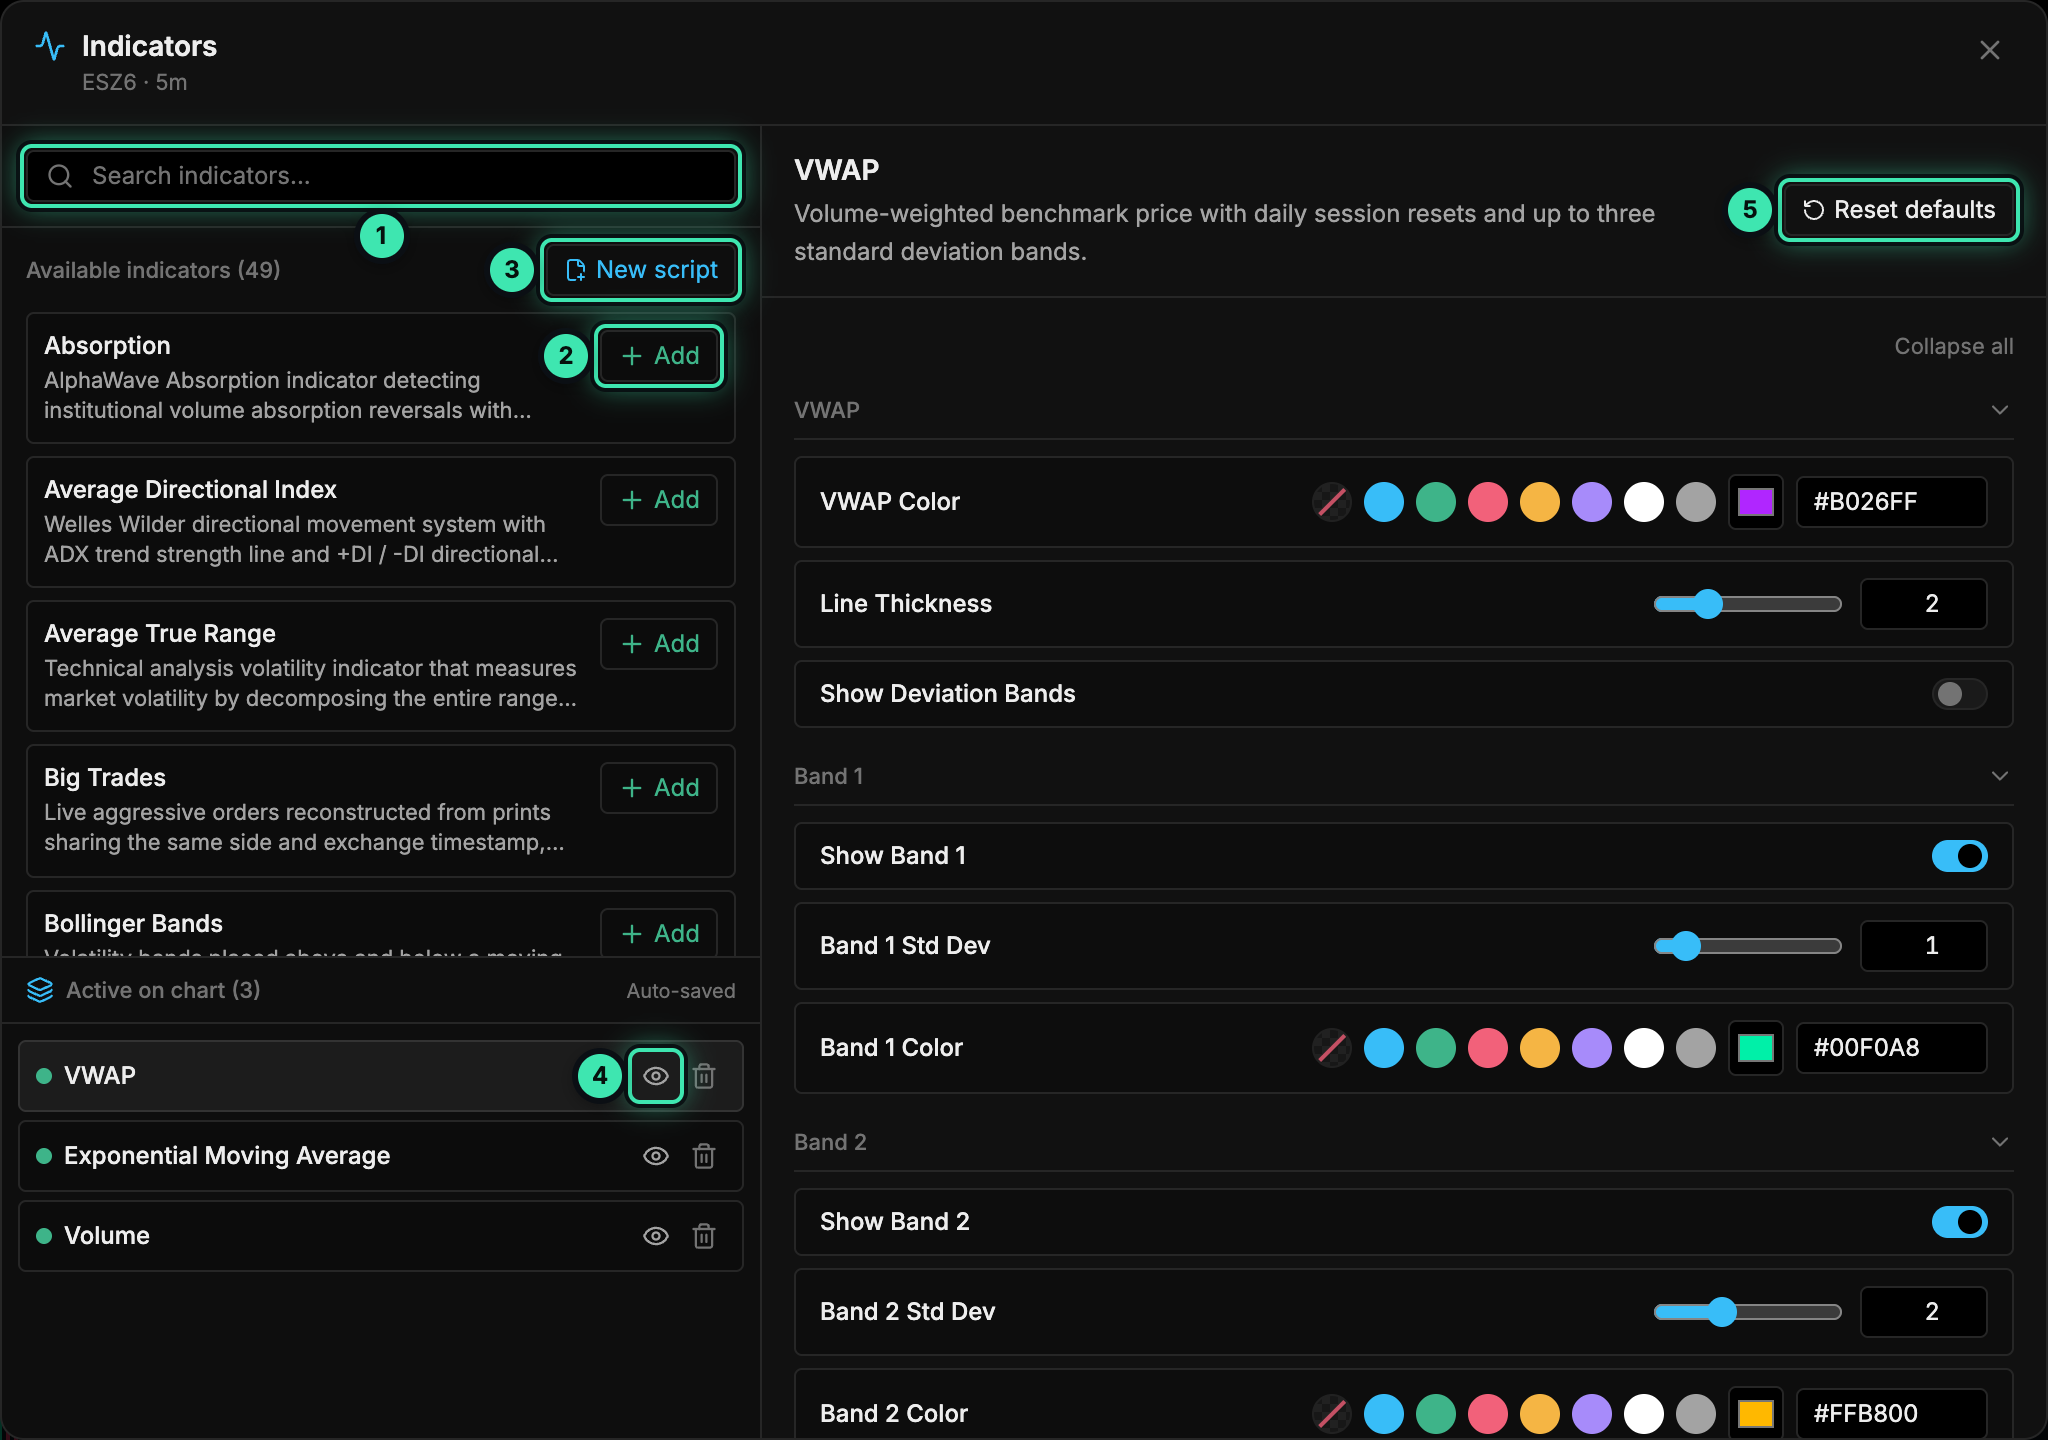
- Search indicators… filters the library as you type.
- + Add puts a new instance of that indicator on the chart.
- New script opens the MintScript editor so you can write a custom indicator.
- The eye icon hides or shows an indicator without removing it. The trash icon next to it removes the indicator.
- Reset defaults restores the selected indicator's default settings, using the active theme's colors.
Add an indicator
- Open the Indicators dialog from the chart panel header.
- Find the indicator in Available indicators (49). The list is flat and alphabetical. Scroll it, or type in the search box (1).
- Click + Add (2) on its row. The indicator appears on the chart straight away, shows up under Active on chart, and is selected so you can adjust its settings on the right.
You can add the same indicator more than once, for example a 9, 21 and 200 EMA. Each instance has its own settings.
Where an indicator draws depends on its type:
- Overlay indicators (moving averages, VWAP, bands, profiles, levels) draw on the price chart.
- Sub-pane indicators (RSI, MACD, CVD, Volume…) get their own pane below the price chart. A new sub-pane starts at 120 px tall. Drag the divider above it to resize it (50 to 600 px). The height is saved per panel.
- Chart card: Economic News draws as a card in a corner of the chart.
Searching
The search box matches an indicator’s name, short name, description or category, so you can search by concept as well as by name. Searching order finds Big Trades, Iceberg, Liquidity Heatmap, LiveDOM, Market Depth and others, because their descriptions mention orders. Short names work too: rsi, atr, svp, cvd.
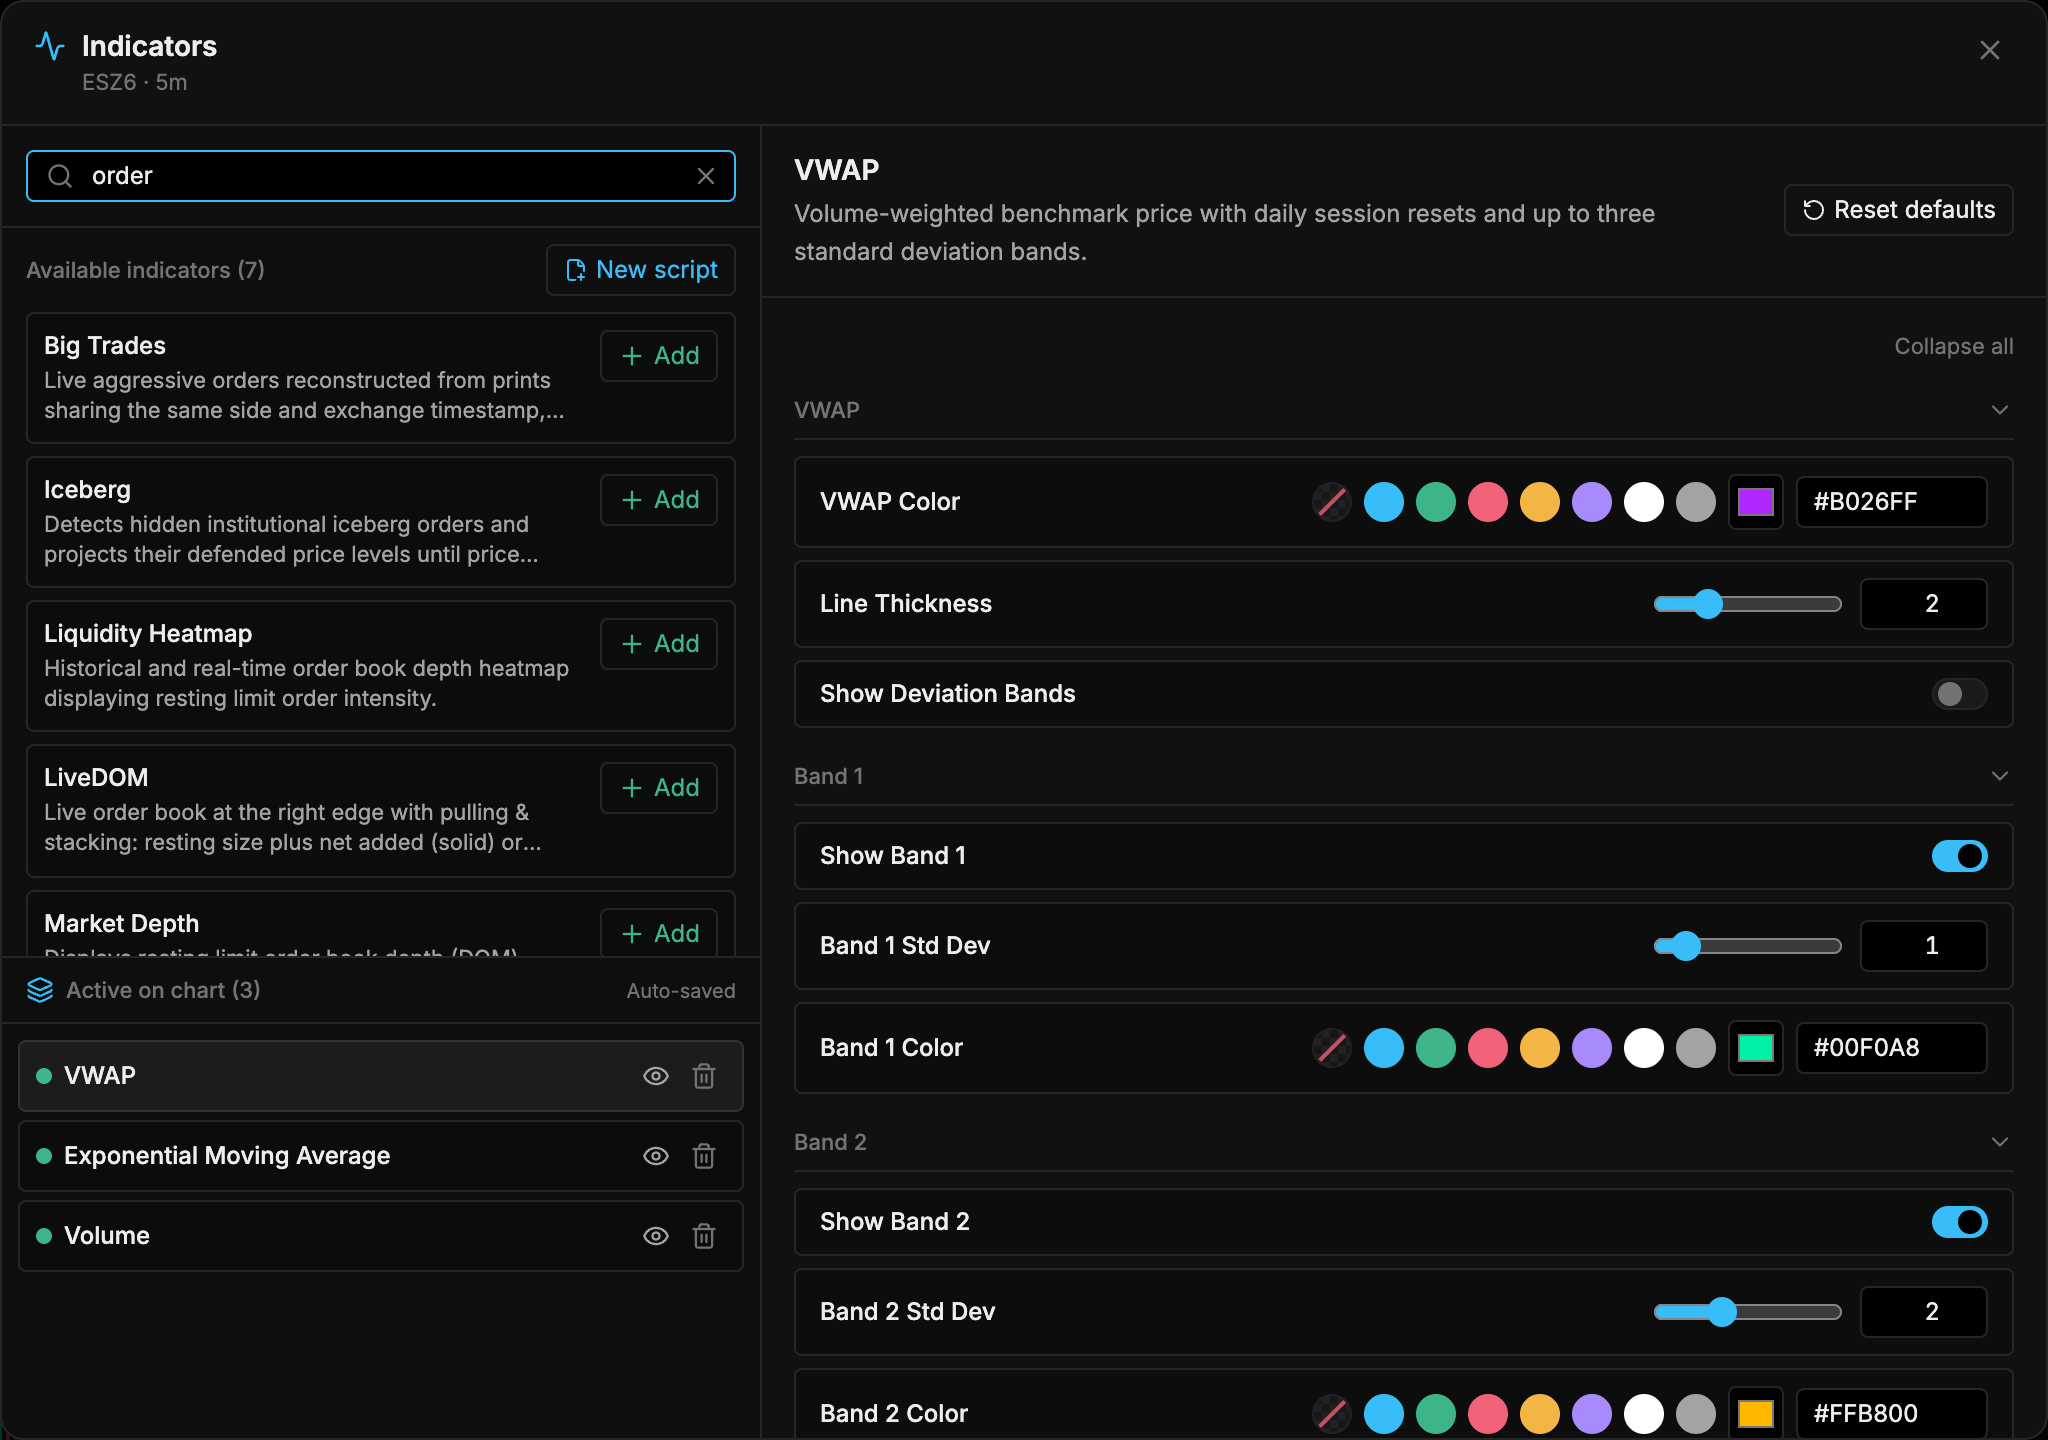
order narrows the library to 7 indicators whose name or description matches. Active on chart
The Active on chart (N) list at bottom-left shows every indicator on this panel, in the order you added them. The Auto-saved tag means changes are saved as you make them, so there is no Apply or Save button.
| Action | How |
|---|---|
| Select an indicator to edit | Click its row. Its settings open on the right. |
| Hide or show | Click the eye icon (4). The indicator stays in the list with its settings and stops drawing. |
| Remove | Click the trash icon. The indicator is removed immediately, with no confirmation. |
User-script indicators also show a Custom chip. A script whose build failed shows a warning chip, and a script that no longer has a published build shows Missing. For script indicators the settings pane also has an Edit script button, which opens that script in the Script Editor.
The settings pane
The right side of the dialog shows the selected indicator’s name, description and settings. Changes apply to the chart live.
- Settings are grouped into collapsible sections (VWAP’s are VWAP, Band 1, Band 2 and Band 3, for example). Indicators without groups show everything under General settings. Use Collapse all / Expand all to fold or unfold every section at once.
- If a section starts with a
Show …switch, that switch turns the whole section on or off and dims the settings below it while it’s off. - Number settings have a slider plus a number box. Switches turn features on and off. Dropdowns choose a mode or option.
- Color settings have a row of theme palette swatches, a transparent option, a custom color picker and a text box. The text box accepts hex or
rgba(...)values. - Reset defaults (5) puts every setting of the selected instance back to its default, using the active theme’s colors.
The settings tables on the indicator pages list the raw default from each indicator’s definition. Colors on your chart may differ, because the theme overrides them (see below).
Colors follow your theme
Every theme includes its own indicator palette.
- When you add an indicator or press Reset defaults, its colors come from the active theme. On the default TickMint Dark theme, for example, the definition’s neon cyan, mint, coral, amber and purple become softer sky, mint, rose, amber and violet tones.
- When you switch themes, TickMint recolors the indicators on every panel to the new theme’s palette.
How indicators are saved
- Auto-saved per panel. Indicator lists and sub-pane heights are saved locally as you work and synced to your local TickMint gateway in the background. They’re still there after you restart.
- Saved with layout templates. A chart layout template stores the indicators of every panel together with the panels themselves. Save current layout & indicators (Ctrl/⌘+S) in the layout menu writes the current indicators into the active template. Switching templates swaps all panels’ indicators in one step. See Layouts & Templates.
- No separate indicator presets. To reuse a set of studies, save it as a layout template.
- Pop-out windows start with a copy of the source panel’s indicators. After that the copy is independent. See Pop-out Windows.
Indicators in Market Replay
Most indicators work the same in Market Replay as on live data, because they’re calculated from the replayed bars and ticks. Replay doesn’t include an order book, though, so indicators that need live Level 2 depth have nothing to draw:
- Liquidity Heatmap, Market Depth, Order Book Imbalance, Iceberg, LiveDOM and Pulling & Stacking Delta.
While replay is running, these indicators show a No depth in Replay badge in the Indicators dialog and are skipped on the chart. The replay header also lists any of them that are switched on.
Big Trades and Market Speed are built only from individual live trade prints, never from historical bars (history arrives as 1-second aggregates). They start empty when you open a chart, fill in as trades print, and may not populate during replay.
Write your own
Click New script (3) to open the MintScript editor. Once your script builds, it is registered as an indicator and appears in this same dialog, where you add and configure it like a built-in indicator. Start with the Script Editor guide and the SDK Reference.
All 49 indicators
| Indicator | Short | Page | Draws on |
|---|---|---|---|
| Exponential Moving Average | EMA | Trend | Overlay |
| Simple Moving Average | SMA | Trend | Overlay |
| Hull Moving Average | HMA | Trend | Overlay |
| Weighted Moving Average | WMA | Trend | Overlay |
| Volume-Weighted Moving Average | VWMA | Trend | Overlay |
| Average Directional Index | ADX | Trend | Sub-pane |
| Ichimoku Cloud | ICHIMOKU | Trend | Overlay |
| Parabolic SAR | PSAR | Trend | Overlay |
| Supertrend | ST | Trend | Overlay |
| Relative Strength Index | RSI | Oscillators | Sub-pane |
| MACD | MACD | Oscillators | Sub-pane |
| Stochastic Oscillator | STOCH | Oscillators | Sub-pane |
| Stochastic RSI | StochRSI | Oscillators | Sub-pane |
| Commodity Channel Index | CCI | Oscillators | Sub-pane |
| Williams %R | %R | Oscillators | Sub-pane |
| Money Flow Index | MFI | Oscillators | Sub-pane |
| Average True Range | ATR | Volatility | Sub-pane |
| Bollinger Bands | BB | Volatility | Overlay |
| Keltner Channels | KC | Volatility | Overlay |
| Donchian Channels | DC | Volatility | Overlay |
| VWAP | VWAP | Volume & Profile | Overlay |
| Volume | VOL | Volume & Profile | Sub-pane |
| On Balance Volume | OBV | Volume & Profile | Sub-pane |
| Chaikin Money Flow | CMF | Volume & Profile | Sub-pane |
| Volume Profile (Visible Range) | VP | Volume & Profile | Overlay |
| Session Volume Profile | SVP | Volume & Profile | Overlay |
| Cumulative Volume Delta | CVD | Order Flow & Delta | Sub-pane |
| Delta Volume | DV | Order Flow & Delta | Sub-pane |
| Delta Divergence | ΔDIV | Order Flow & Delta | Overlay |
| Absorption | ABS | Order Flow & Delta | Overlay |
| Big Trades | Big Trades | Order Flow & Delta | Overlay |
| Market Speed | Speed | Order Flow & Delta | Sub-pane |
| OrderFlow Scalper | OFS | Order Flow & Delta | Overlay |
| Iceberg | ICEBERG | Order Flow & Delta | Overlay |
| Liquidity Heatmap | HEATMAP | Market Depth / L2 | Overlay |
| Market Depth | MD | Market Depth / L2 | Overlay |
| LiveDOM | LDOM | Market Depth / L2 | Overlay |
| Pulling & Stacking Delta | LDOM Δ | Market Depth / L2 | Sub-pane |
| Order Book Imbalance | OBI | Market Depth / L2 | Sub-pane |
| Fair Value Gaps | FVG | Price Action & Levels | Overlay |
| Initial Balance | IB | Price Action & Levels | Overlay |
| Market Structure | MS | Price Action & Levels | Overlay |
| Overnight Levels | ONL | Price Action & Levels | Overlay |
| Pivot Points | Pivots | Price Action & Levels | Overlay |
| Previous Session Levels | PSL | Price Action & Levels | Overlay |
| Reversal Levels | REV | Price Action & Levels | Overlay |
| Session Reference Levels | LEVELS | Price Action & Levels | Overlay |
| Swing Highs / Lows | SWING | Price Action & Levels | Overlay |
| Economic News | NEWS | Economic News | Chart card |