Script Editor
MintScript is TickMint’s scripting system. You write indicators in TypeScript against the @tickmint/sdk API, compile them with instant feedback, and add them to charts like any built-in indicator. The full API is documented in the SDK reference.
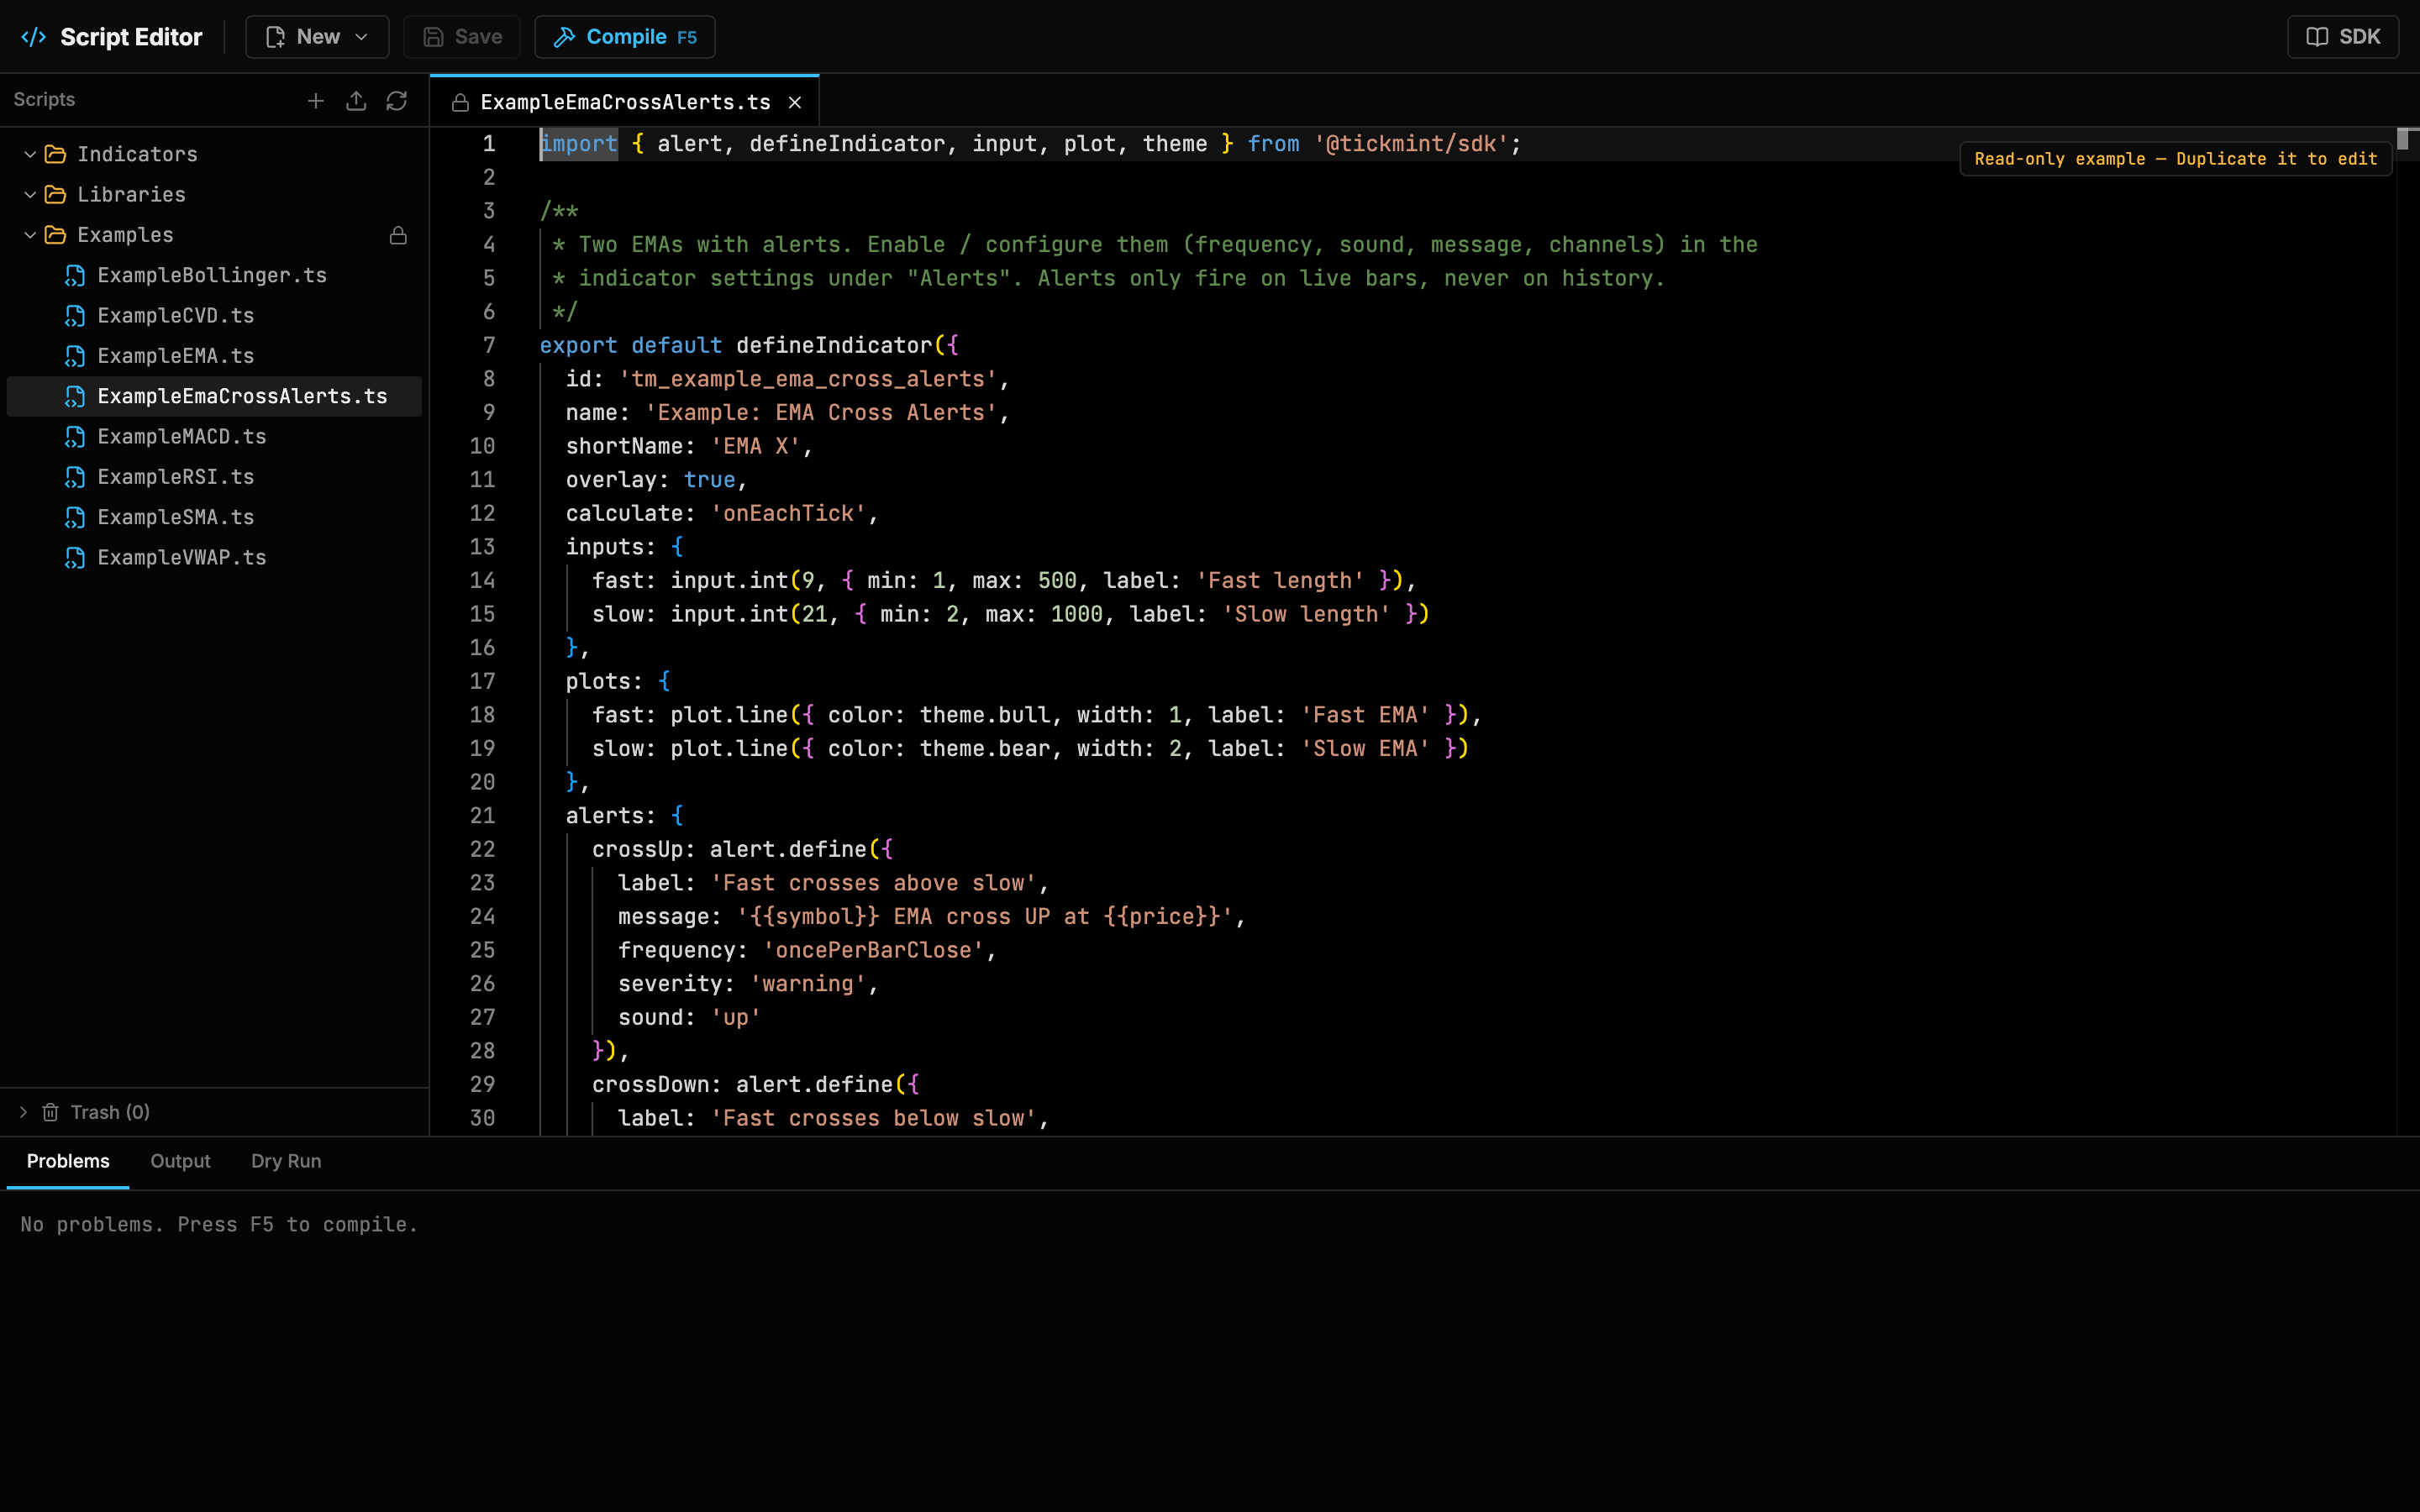
Examples/ExampleEmaCrossAlerts.ts open. Open the editor
| Where | How |
|---|---|
| Header toolbar | Scripts button (</> icon) |
| Indicators dialog | New Script, or Edit Script on a custom indicator |
The editor is a single window with tabs. Opening it again focuses the existing window and opens the file you asked for in a new tab.
- Desktop app: the editor is a dedicated window. Its size and position are remembered, and it closes with the main window. If you close it with unsaved changes, it asks Discard changes?
- Browser: the editor opens as a popup (
/editor.html). If nothing happens, allow popups for TickMint. Closing the tab with unsaved changes triggers the browser’s leave-page warning.
Files and folders
The left-hand Scripts explorer shows the scripts folder that the gateway keeps in your TickMint data directory (<data dir>/scripts):
| Folder | Contents |
|---|---|
Indicators/ |
Your indicators. Each .ts file has a unique id. |
Libraries/ |
Shared modules that indicators import. They have no defineIndicator. |
Examples/ |
Read-only examples, refreshed at startup: SMA, EMA, RSI, MACD, Bollinger, VWAP, CVD and EMA Cross Alerts. Use Duplicate to Indicators to make an editable copy. |
| Trash | Deleted files. Restore them from the Trash section. |
Only .ts files are allowed. Right-click a file for Open, Duplicate, Export (.mintscript), Rename…, Regenerate ID and Move to Trash. Right-click a folder for the New … templates and New Folder.
File badges in the explorer:
| Badge | Meaning |
|---|---|
| Green dot | Published. The tooltip says when a file edited outside the editor wasn’t type-checked. |
| ⚠ | The latest build failed. Charts keep running the last good build. |
| DUP | Another file uses the same id. Use Regenerate ID on one of them. |
Create a script
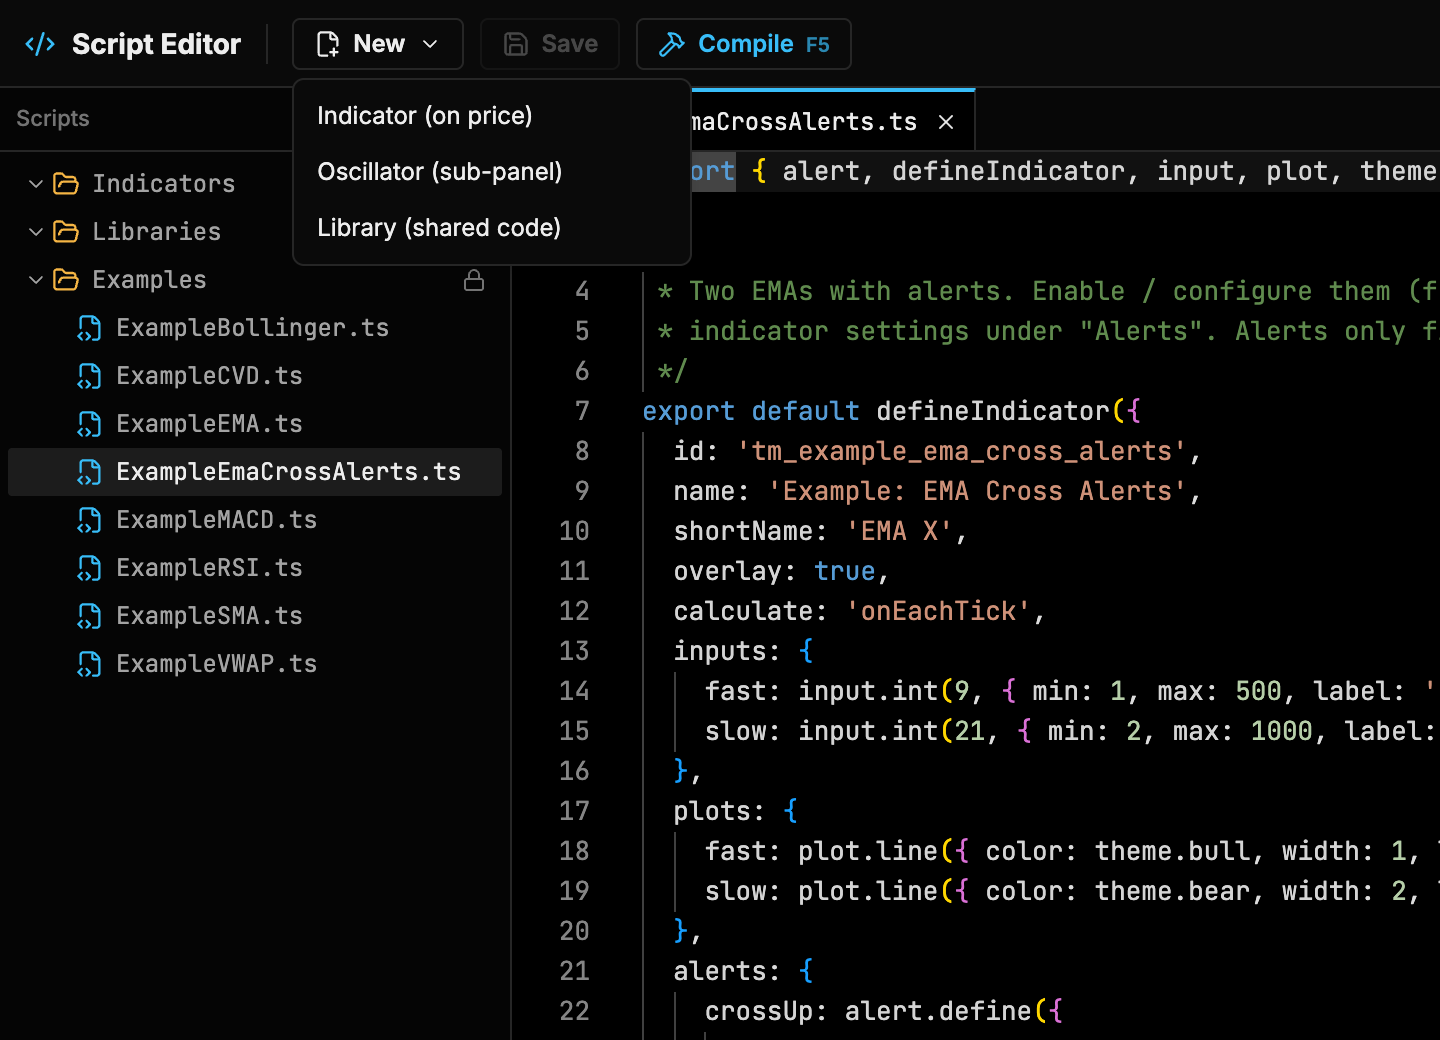
tm_… id. - Click New in the toolbar, or the New script button in the explorer header.
- Pick a template:
- Indicator (on price): an overlay with an SMA plot, created in
Indicators/. - Oscillator (sub-panel): an EMA-difference histogram with a 0 level, created in
Indicators/. - Library (shared code): exported helper functions, created in
Libraries/.
- Indicator (on price): an overlay with an SMA plot, created in
- Enter a name. Spaces and symbols are removed from the file name.
- Edit the code, then press F5 to compile and publish it.
- In a chart, open Indicators. Your script is listed with a Custom chip. Add it like any built-in indicator.
Save vs compile
| Key | Button | Action |
|---|---|---|
| ⌘S / Ctrl+S | Save | Saves the file. Saving does not publish. |
| F5 | Compile | Save → build → type check → dry run → publish. Charts update. |
- Any failing stage stops the pipeline, and charts keep running the last good build. Indicators whose latest build failed show a ⚠ badge.
- Type errors block publishing. Warnings don’t.
- Compiling a library rebuilds and republishes every indicator that imports it.
- Files edited outside the editor, for example in VS Code, are published automatically by the gateway but are not type-checked.
Bottom panel
| Tab | Shows |
|---|---|
| Problems | Build, type and runtime errors. Click one to jump to the line. |
| Output | Script logs (ctx.log), dry-run output and chart faults from the editor and every chart. |
| Dry Run | The script run on synthetic bars before publishing: bar count, load/calc/live timings against the limits, plots (values, first, last), draw objects and alerts raised by a simulated live update. |
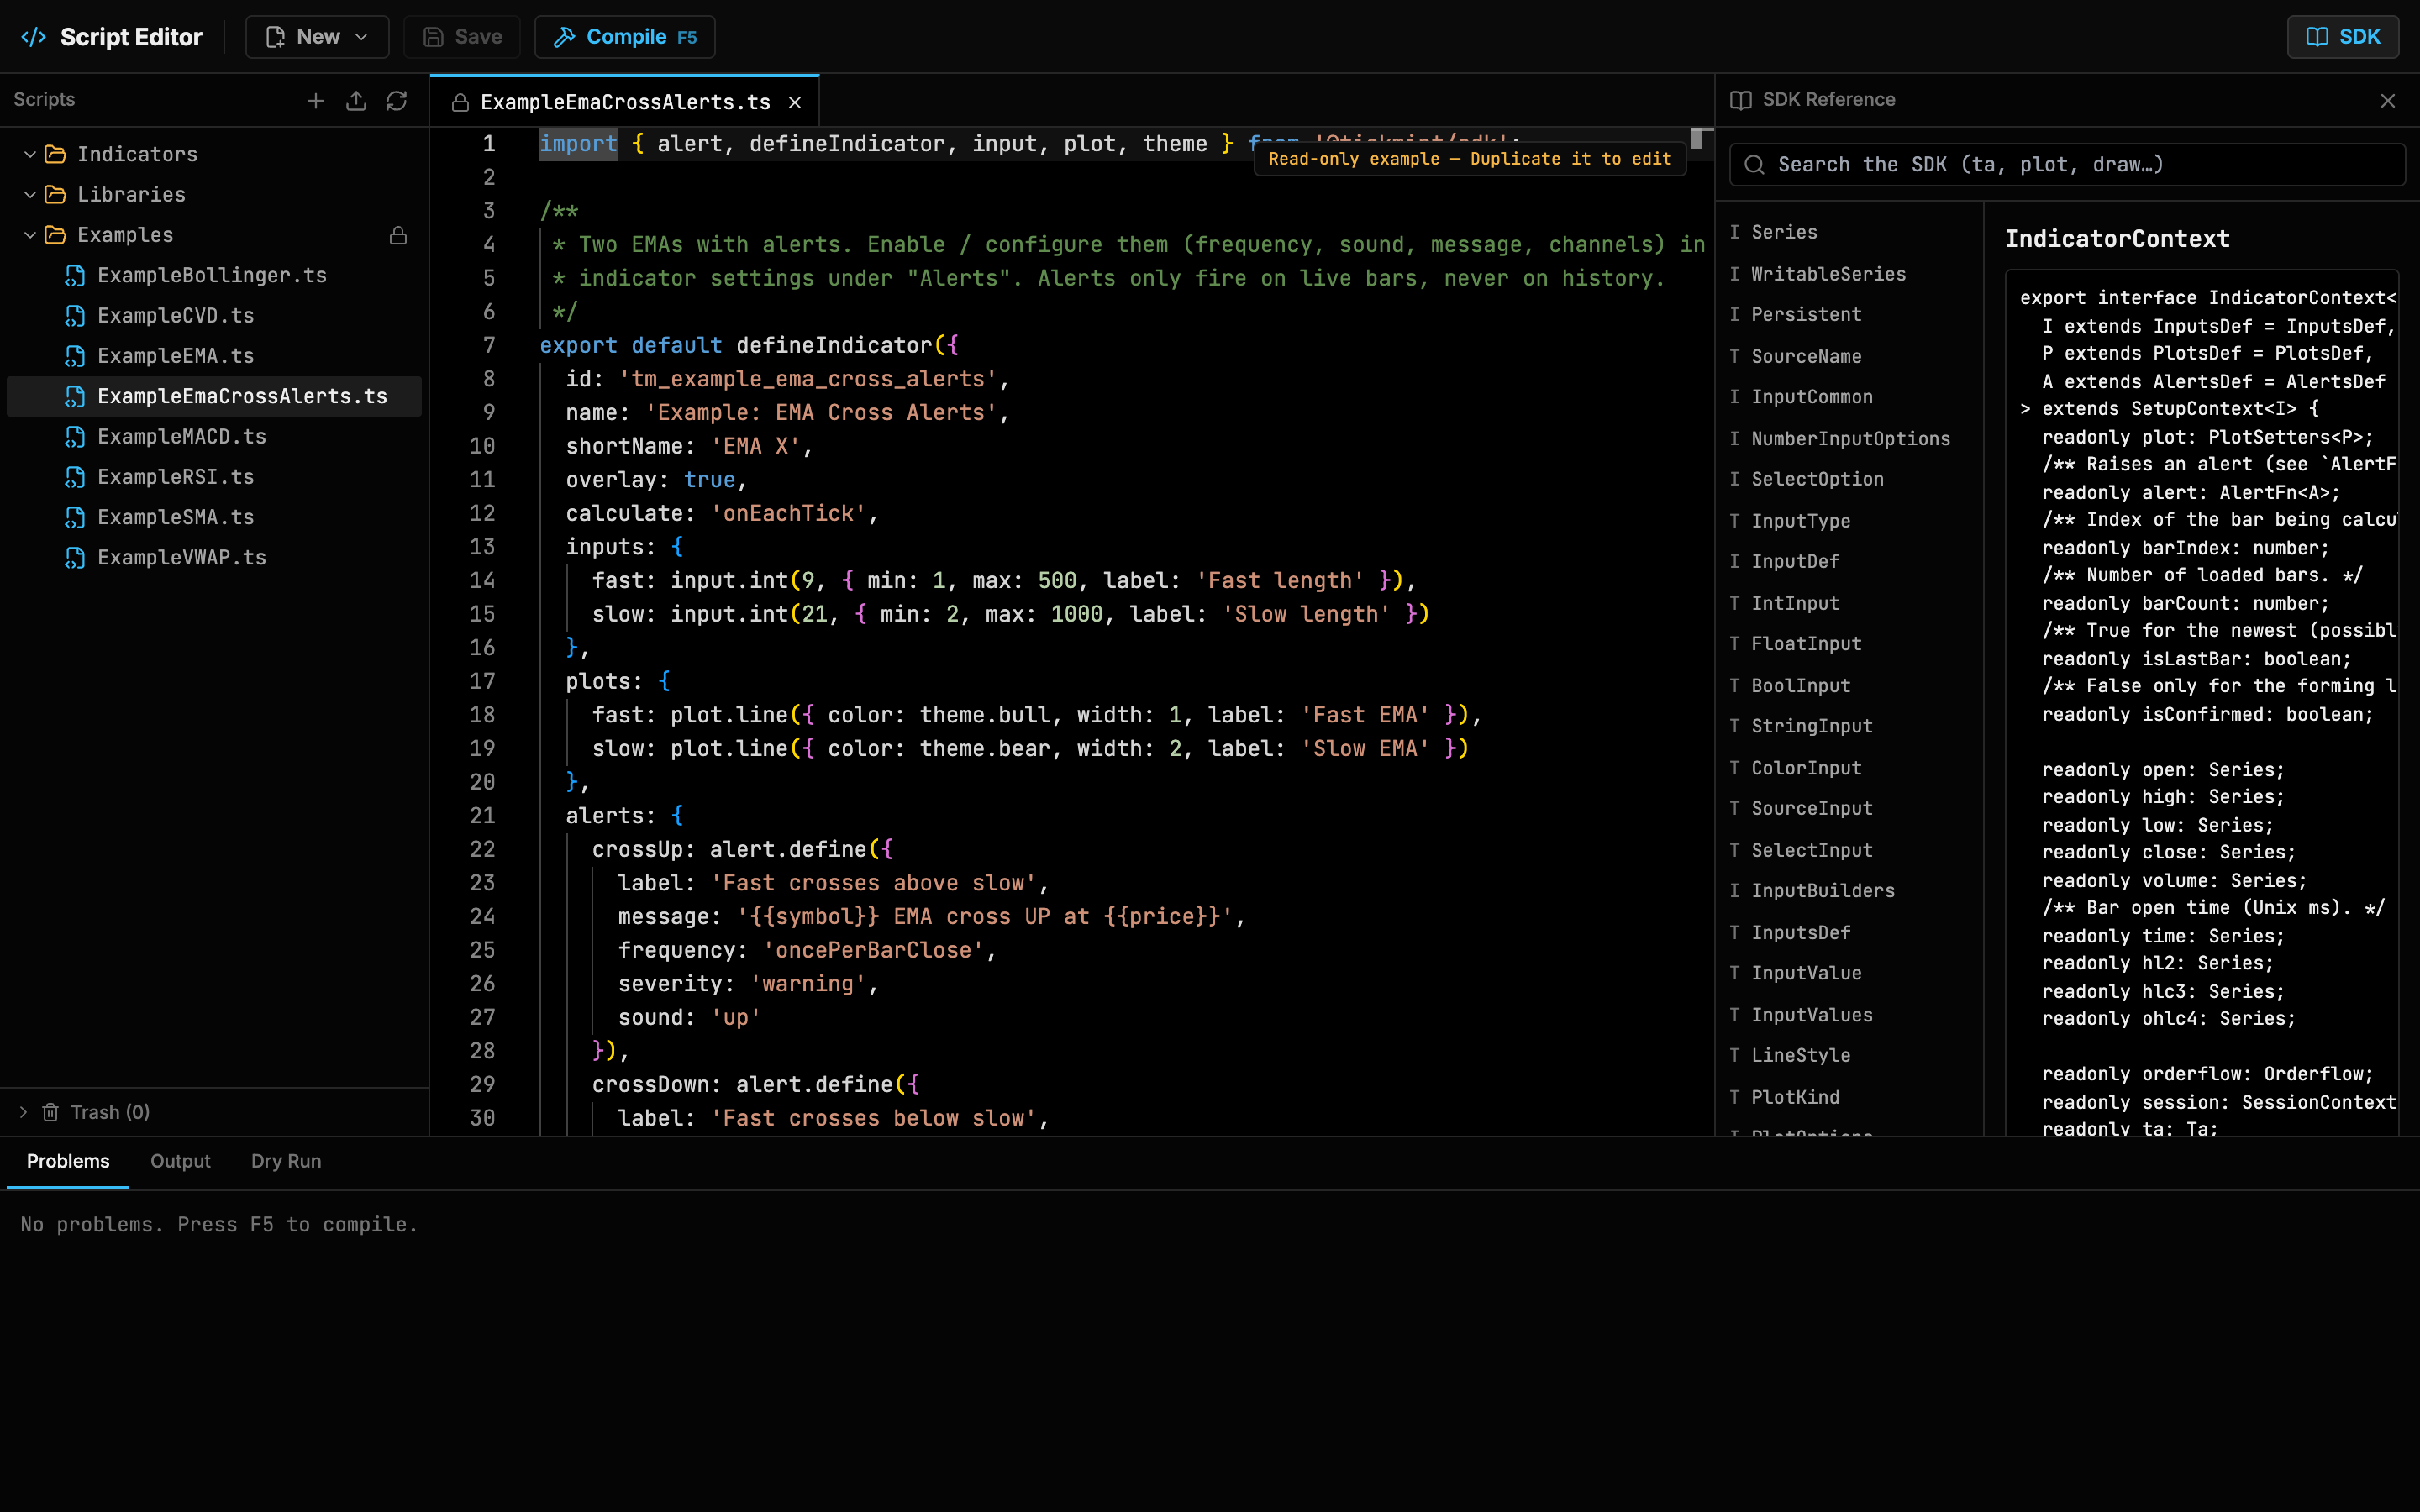
SDK reference panel
Minimal example
import { defineIndicator, input, plot, theme } from '@tickmint/sdk';
export default defineIndicator({  id: 'tm_mysma_ab12cd',  name: 'My SMA',  overlay: true,  inputs: {    length: input.int(20, { min: 1, label: 'Length' }),    source: input.source('close', { label: 'Source' })  },  plots: { value: plot.line({ color: theme.accent, width: 2 }) },  onBarUpdate(ctx) {    const avg = ctx.ta.sma(ctx.inputs.source, ctx.inputs.length);    ctx.plot.value(avg[0]); // [0] = current bar, [1] = previous bar, …  }});
The SDK reference covers inputs, plots, ctx.ta, drawing, order flow and alerts.
Limits
| Limit | Value |
|---|---|
| Load + full-history calculation | 3000 ms |
| Live (incremental) update | 100 ms |
| Drawing objects per instance | 5000 (oldest evicted) |
| Log lines | 50 per second per instance, 2000 characters each |
Nested ctx.indicator() depth |
8 |
| Alerts | 30 per minute per instance |
| Declared alerts per script | 32 |
Each chart panel runs its scripts in one sandbox worker, one request at a time. If a script goes over its time budget, only that script is stopped. The Indicators dialog then shows Script stopped with a Retry button, and the panel’s other scripts reload in a new worker.
Import and export
- Export (.mintscript) in a file’s context menu downloads a zip containing the script and every library it imports. Exported examples become editable
Indicators/files. - Import .ts or .mintscript in the explorer header imports files. Imported ids that clash with existing scripts are flagged DUP.
- If you delete a script that a chart uses, the chart keeps a Missing placeholder with its settings until you restore the file from Trash.