Price Action & Levels
These overlays draw reference prices and structure on the price chart: session highs and lows, opening ranges, pivots, swings and gaps. They’re built from bars, so they work on live charts and in Market Replay. To add one, open Indicators in the chart panel header and search by name. See Indicators overview.
Data requirements
- Bars with enough history. Session-based levels need the bars of the session they describe. For example, the prior day’s high and low need the prior session to be loaded on the chart. Load more history or use an intraday timeframe if a level is missing.
- Sessions follow the CME trading day. The day starts at 18:00 ET and RTH opens at 09:30 ET. Overnight Levels reads its time fields in the chart’s display time zone.
- Previous Session Levels gets its profiles from the local gateway (
/api/historical/session-levels), not from the bars on the chart.
Session Reference Levels
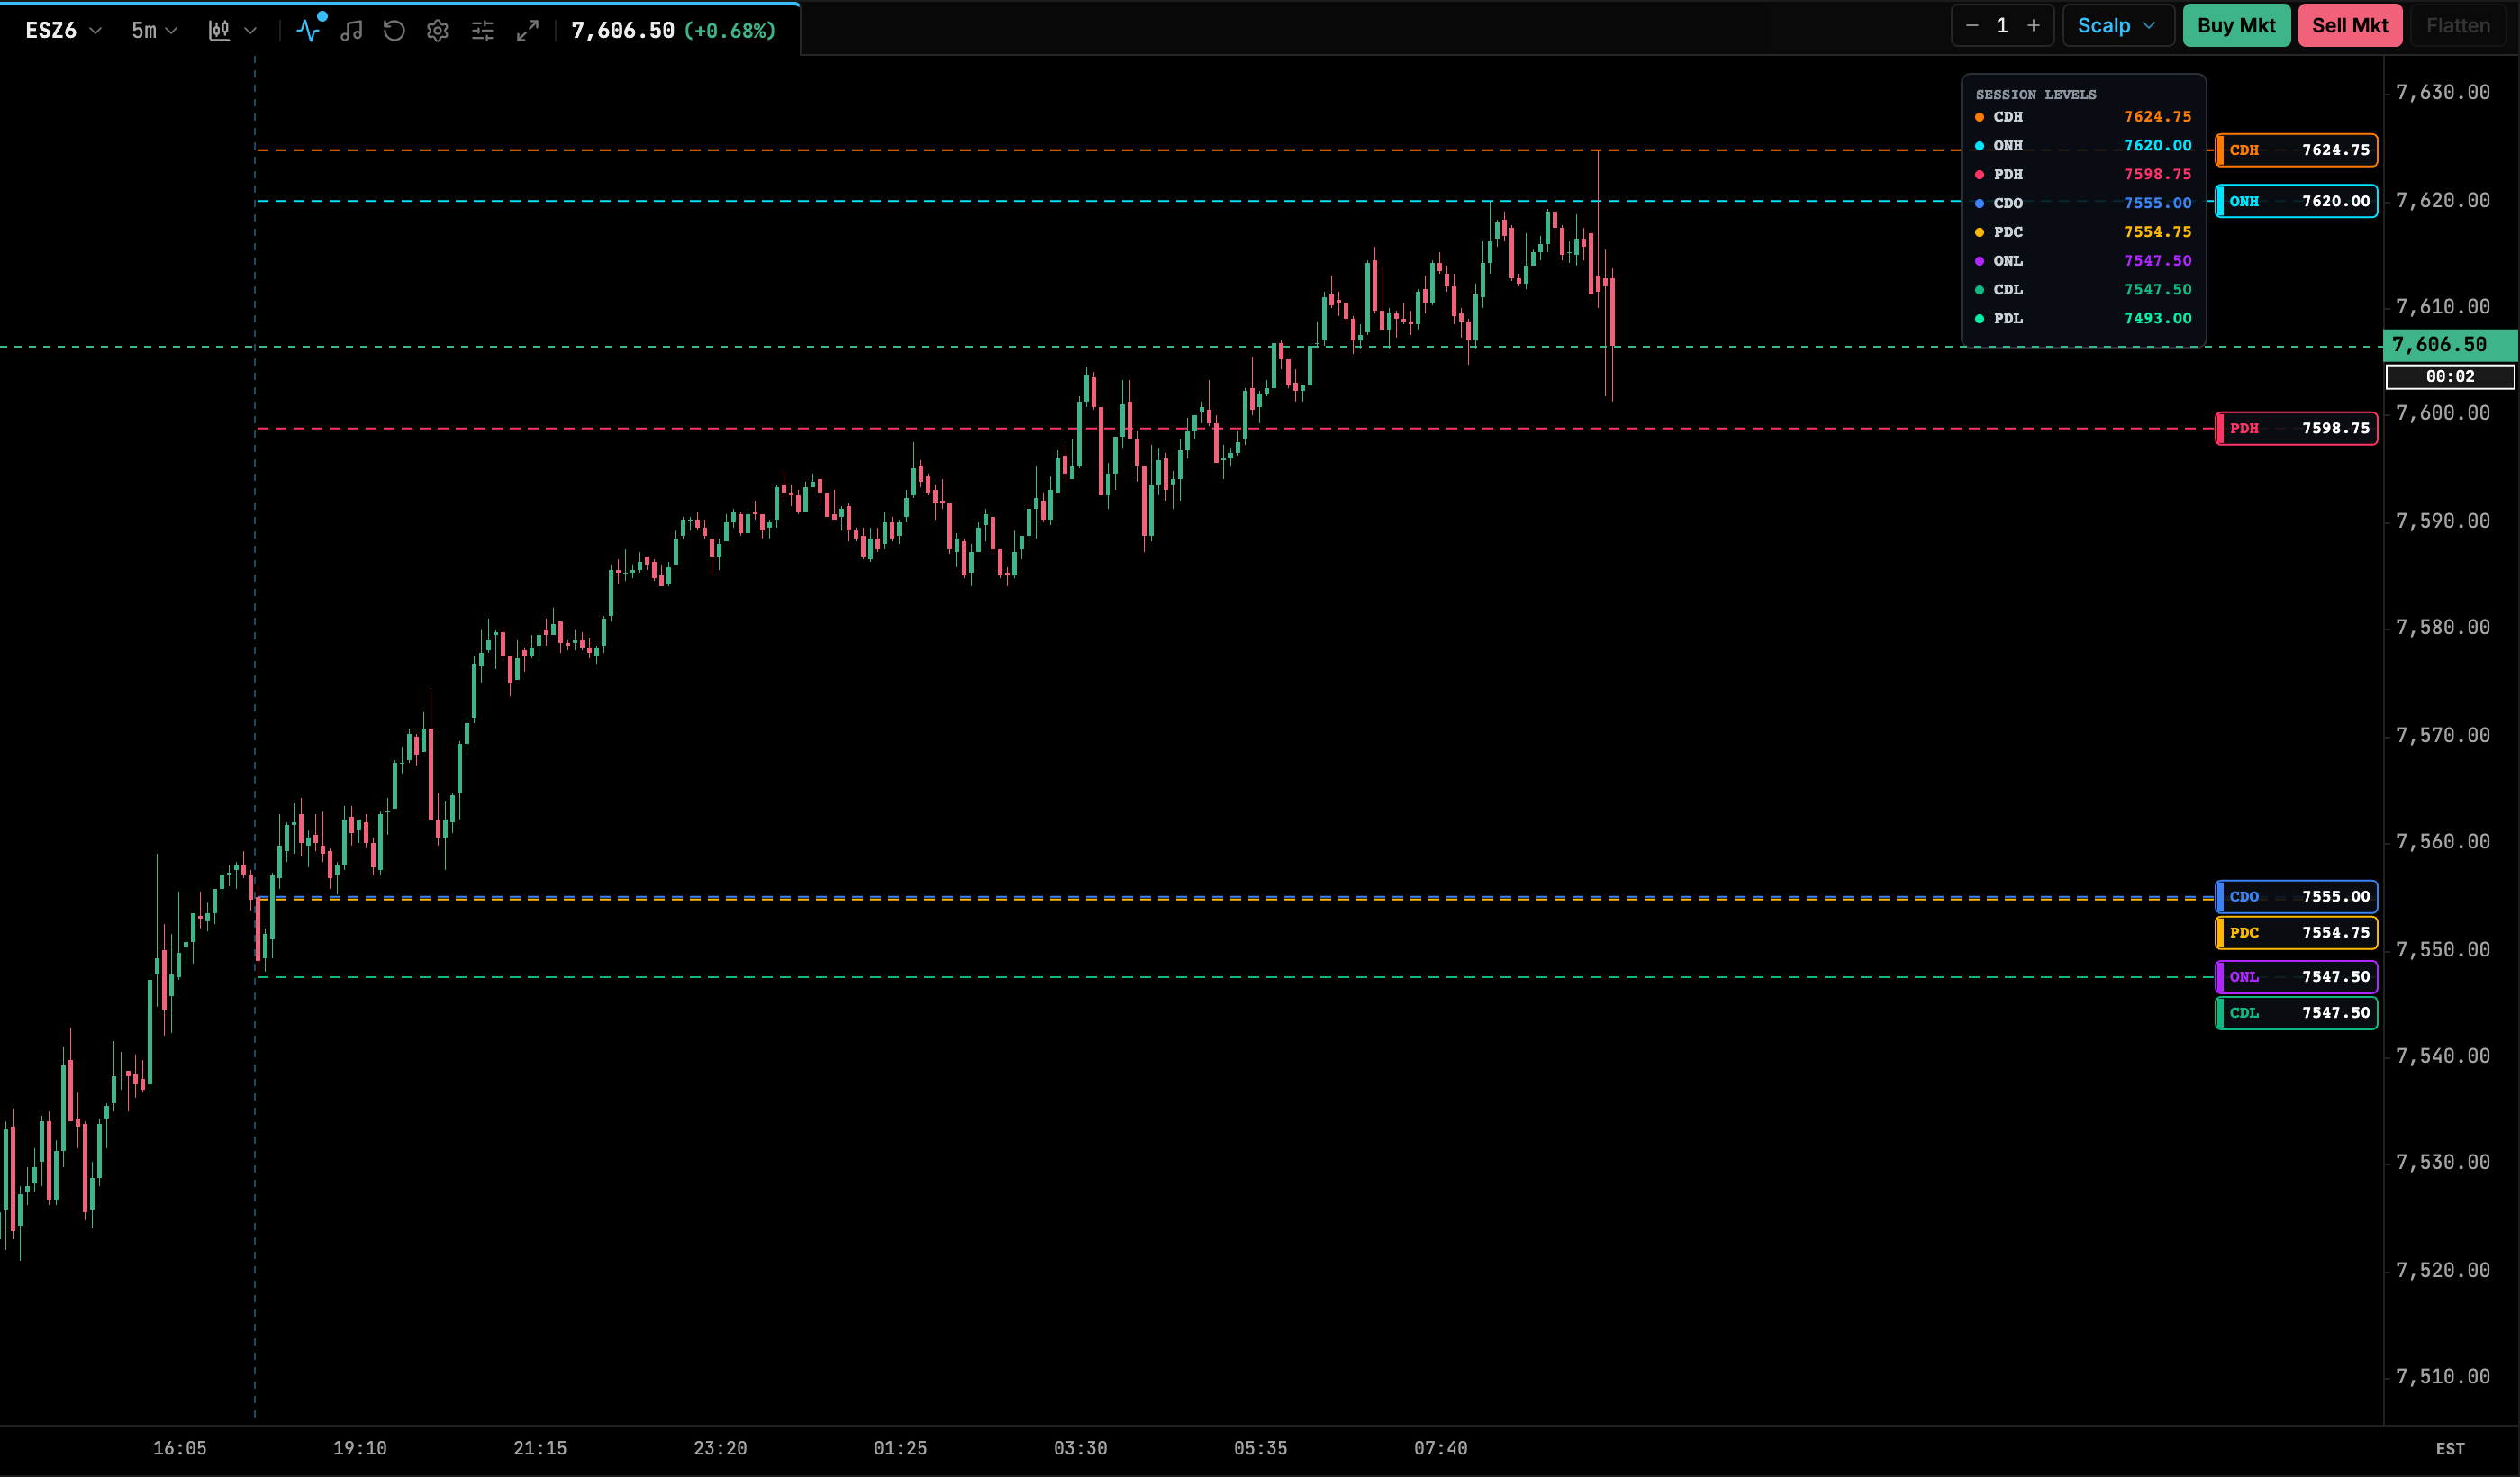
Key reference prices drawn as horizontal lines, with labelled badges on the price axis and an optional summary HUD box:
- Current day: open, high and low (CDO / CDH / CDL). In RTH mode they’re labelled RTO / RTH / RTL and measured from the 09:30 ET open.
- Prior day: high, low and close (PDH / PDL / PDC).
- Overnight: high and low (ONH / ONL).
| Setting | Default | Range / options | Notes |
|---|---|---|---|
| Show Horizontal Lines | on | on/off | Off leaves only the badges and HUD. |
| Current Day Session Mode | Full CME Session (ETH 18:00 ET) | Full CME Session (ETH 18:00 ET), Regular Trading Hours (RTH 09:30 ET) | |
| Show Summary HUD Box | on | on/off | |
| Line Style | Dashed | Dashed, Solid, Dotted | |
| Line Thickness | 1 | 1–3 | |
| Show Current Day Open / High / Low | on | on/off | One toggle each. |
| Open / High / Low Color | #3B82F6 / #FF7A00 / #10B981 | color | |
| Show Prior Day High / Low / Close | on | on/off | One toggle each. |
| PDH / PDL / PDC Color | theme bear / bull / amber | color | |
| Show Overnight High / Low | on | on/off | |
| ONH / ONL Color | theme cyan / purple | color |
Previous Session Levels
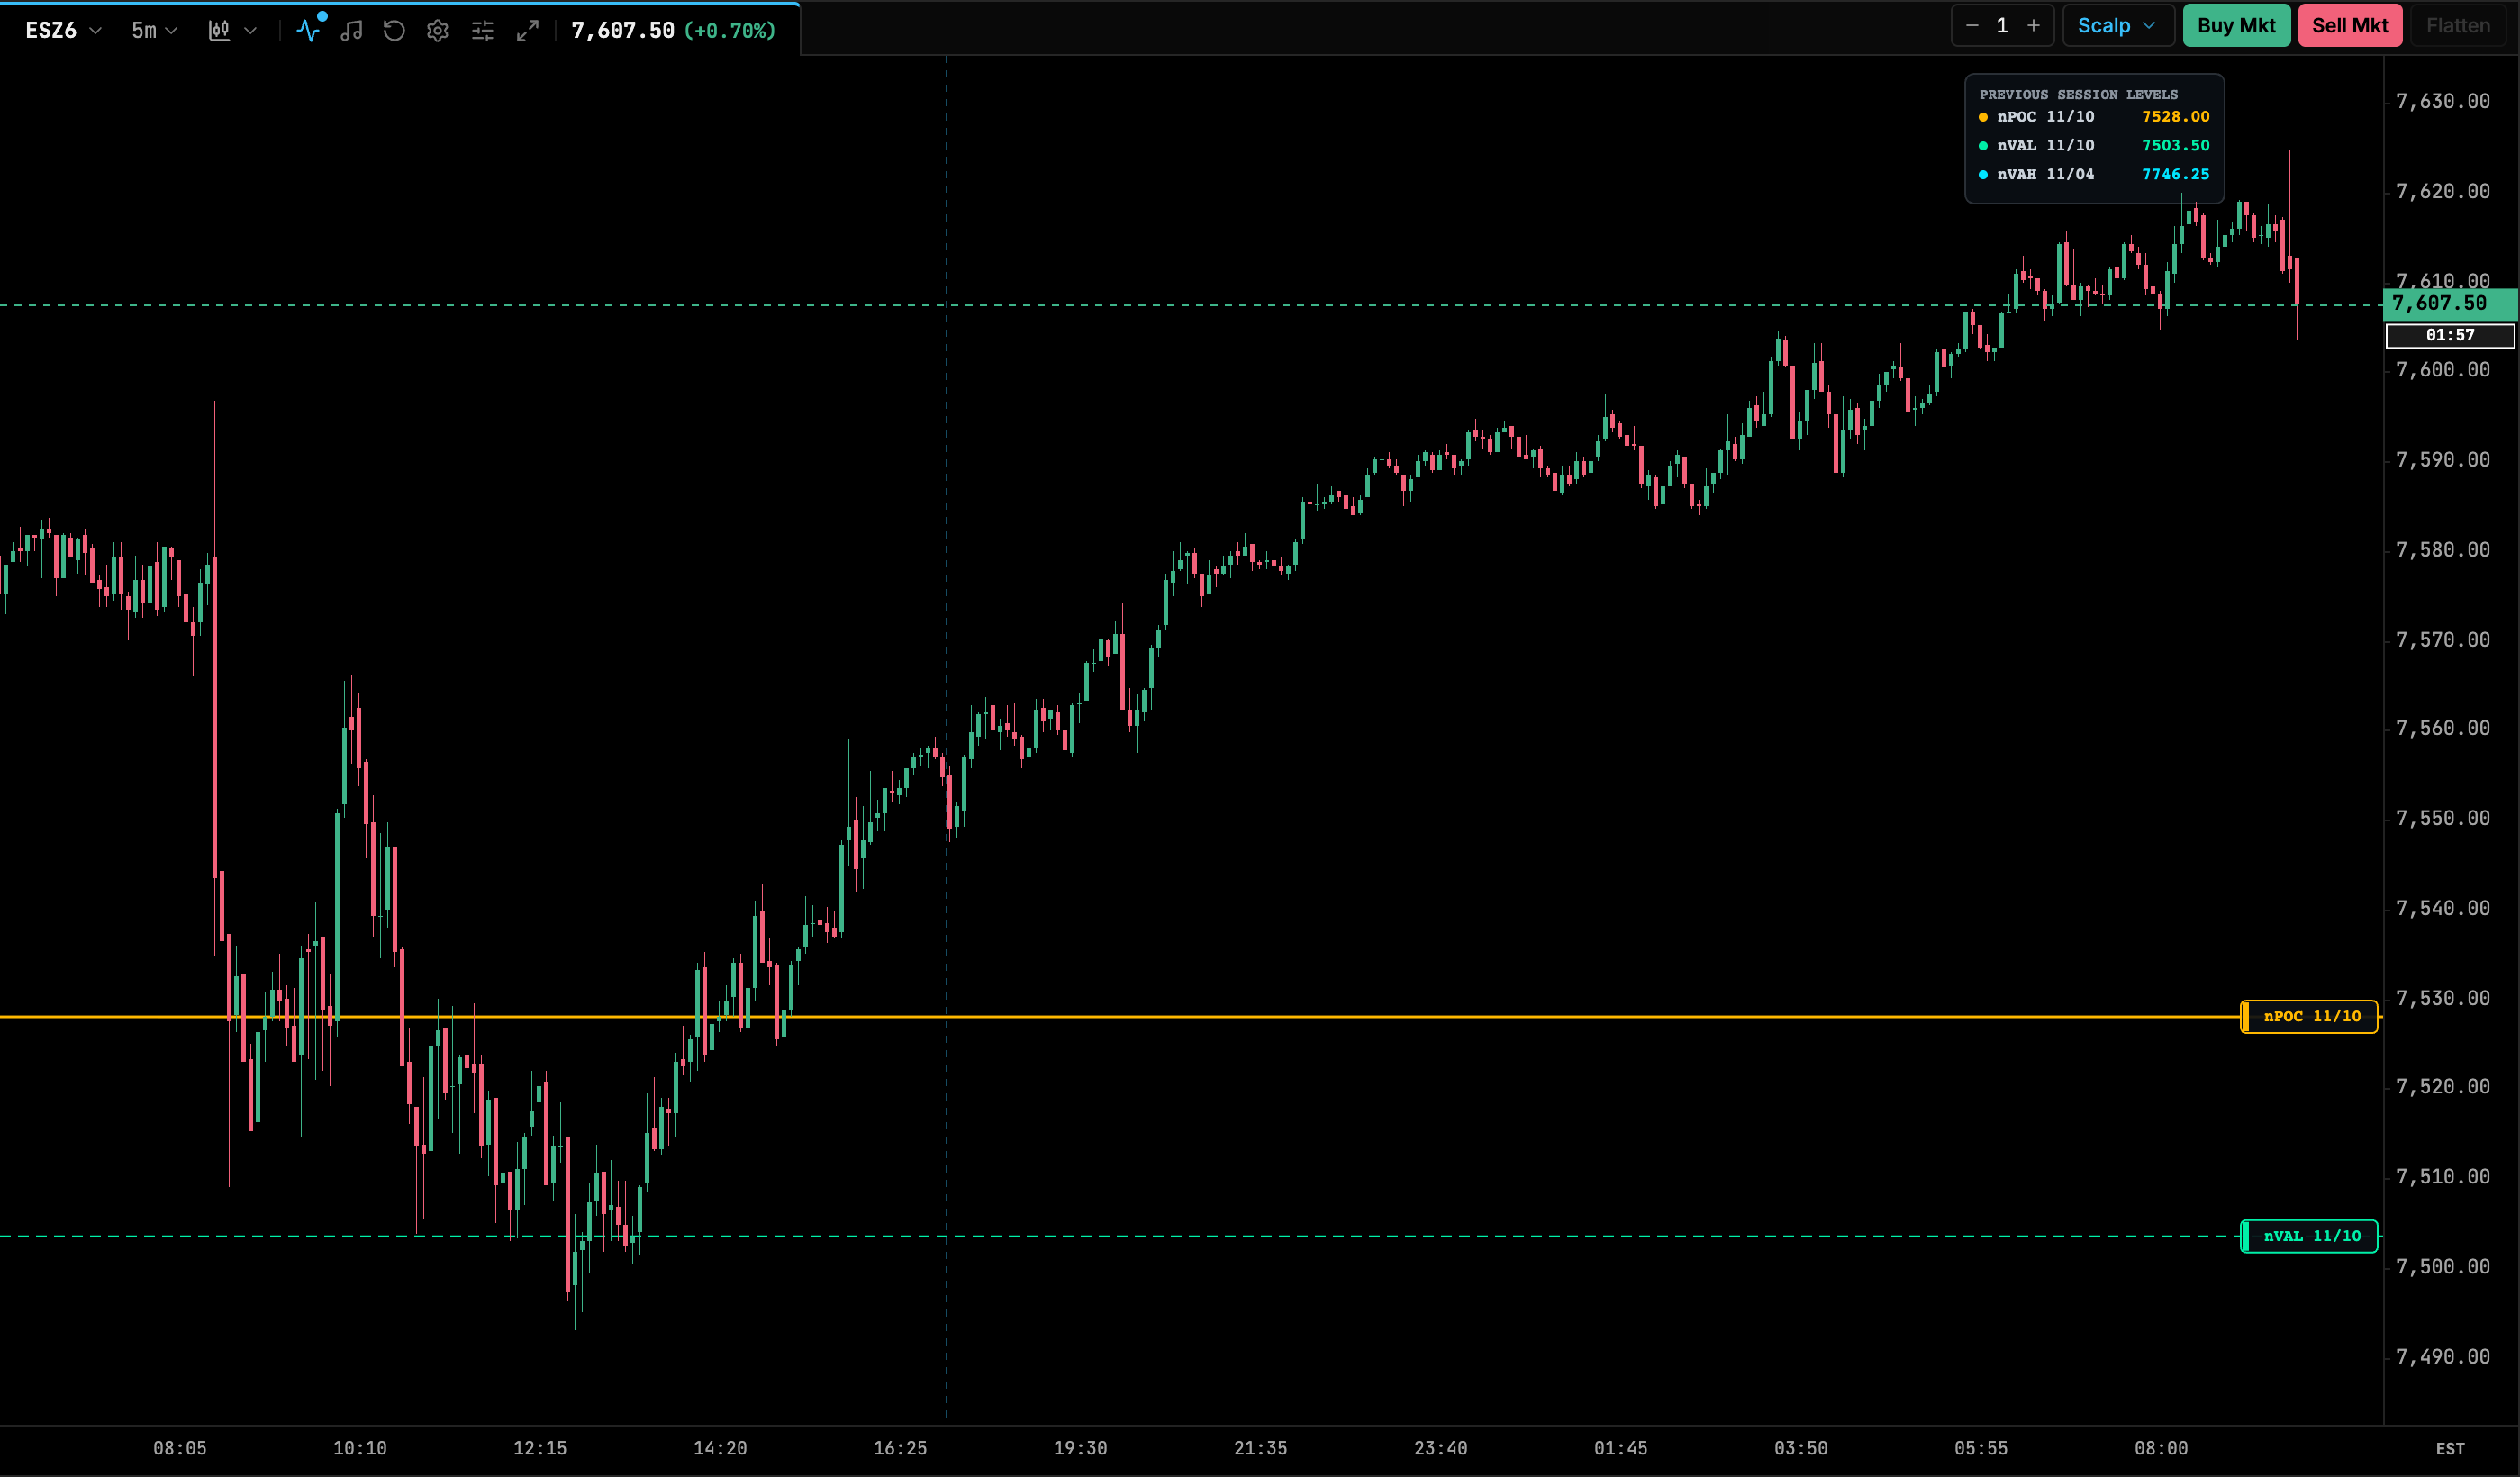
The POC, VAH and VAL from the volume profiles of previous daily sessions. By default only naked levels are drawn, meaning levels price hasn’t traded back to since. Traders watch these as magnets and targets. Each badge can show the session date (for example 10/05) and the price. A summary HUD box lists the active levels.
| Setting | Default | Range / options | Notes |
|---|---|---|---|
| Lookback Sessions | 10 Sessions (2 Weeks) | 5, 10, 15, 20 sessions | |
| Session Scope | Full CME Session (ETH 18:00 ET) | Full CME Session (ETH 18:00 ET), Regular Trading Hours (RTH 09:30 ET) | Session used to build each profile. |
| Max Active Levels Displayed | 10 | 1–30 | |
| Show Only Naked Levels | on | on/off | Hides levels once price touches or crosses them. |
| Show Touched Levels Dimmed | off | on/off | With Show Only Naked on, shows touched levels dimmed instead of hiding them. |
| Show Horizontal Lines | on | on/off | |
| Show Price Axis Badges | on | on/off | |
| Show Session Date in Badge | on | on/off | |
| Show Price in Badge | off | on/off | |
| Show Summary HUD Box | on | on/off | |
| Show Point of Control (POC) | on | on/off | Color theme amber, thickness 1.5 (1–3), Solid. |
| Show Value Area High (VAH) | on | on/off | Color theme cyan, thickness 1, Dashed. |
| Show Value Area Low (VAL) | on | on/off | Color theme bull, thickness 1, Dashed. |
Each of POC, VAH and VAL also has its own Color, Thickness and Style (Solid, Dashed, Dotted) settings.
Overnight Levels
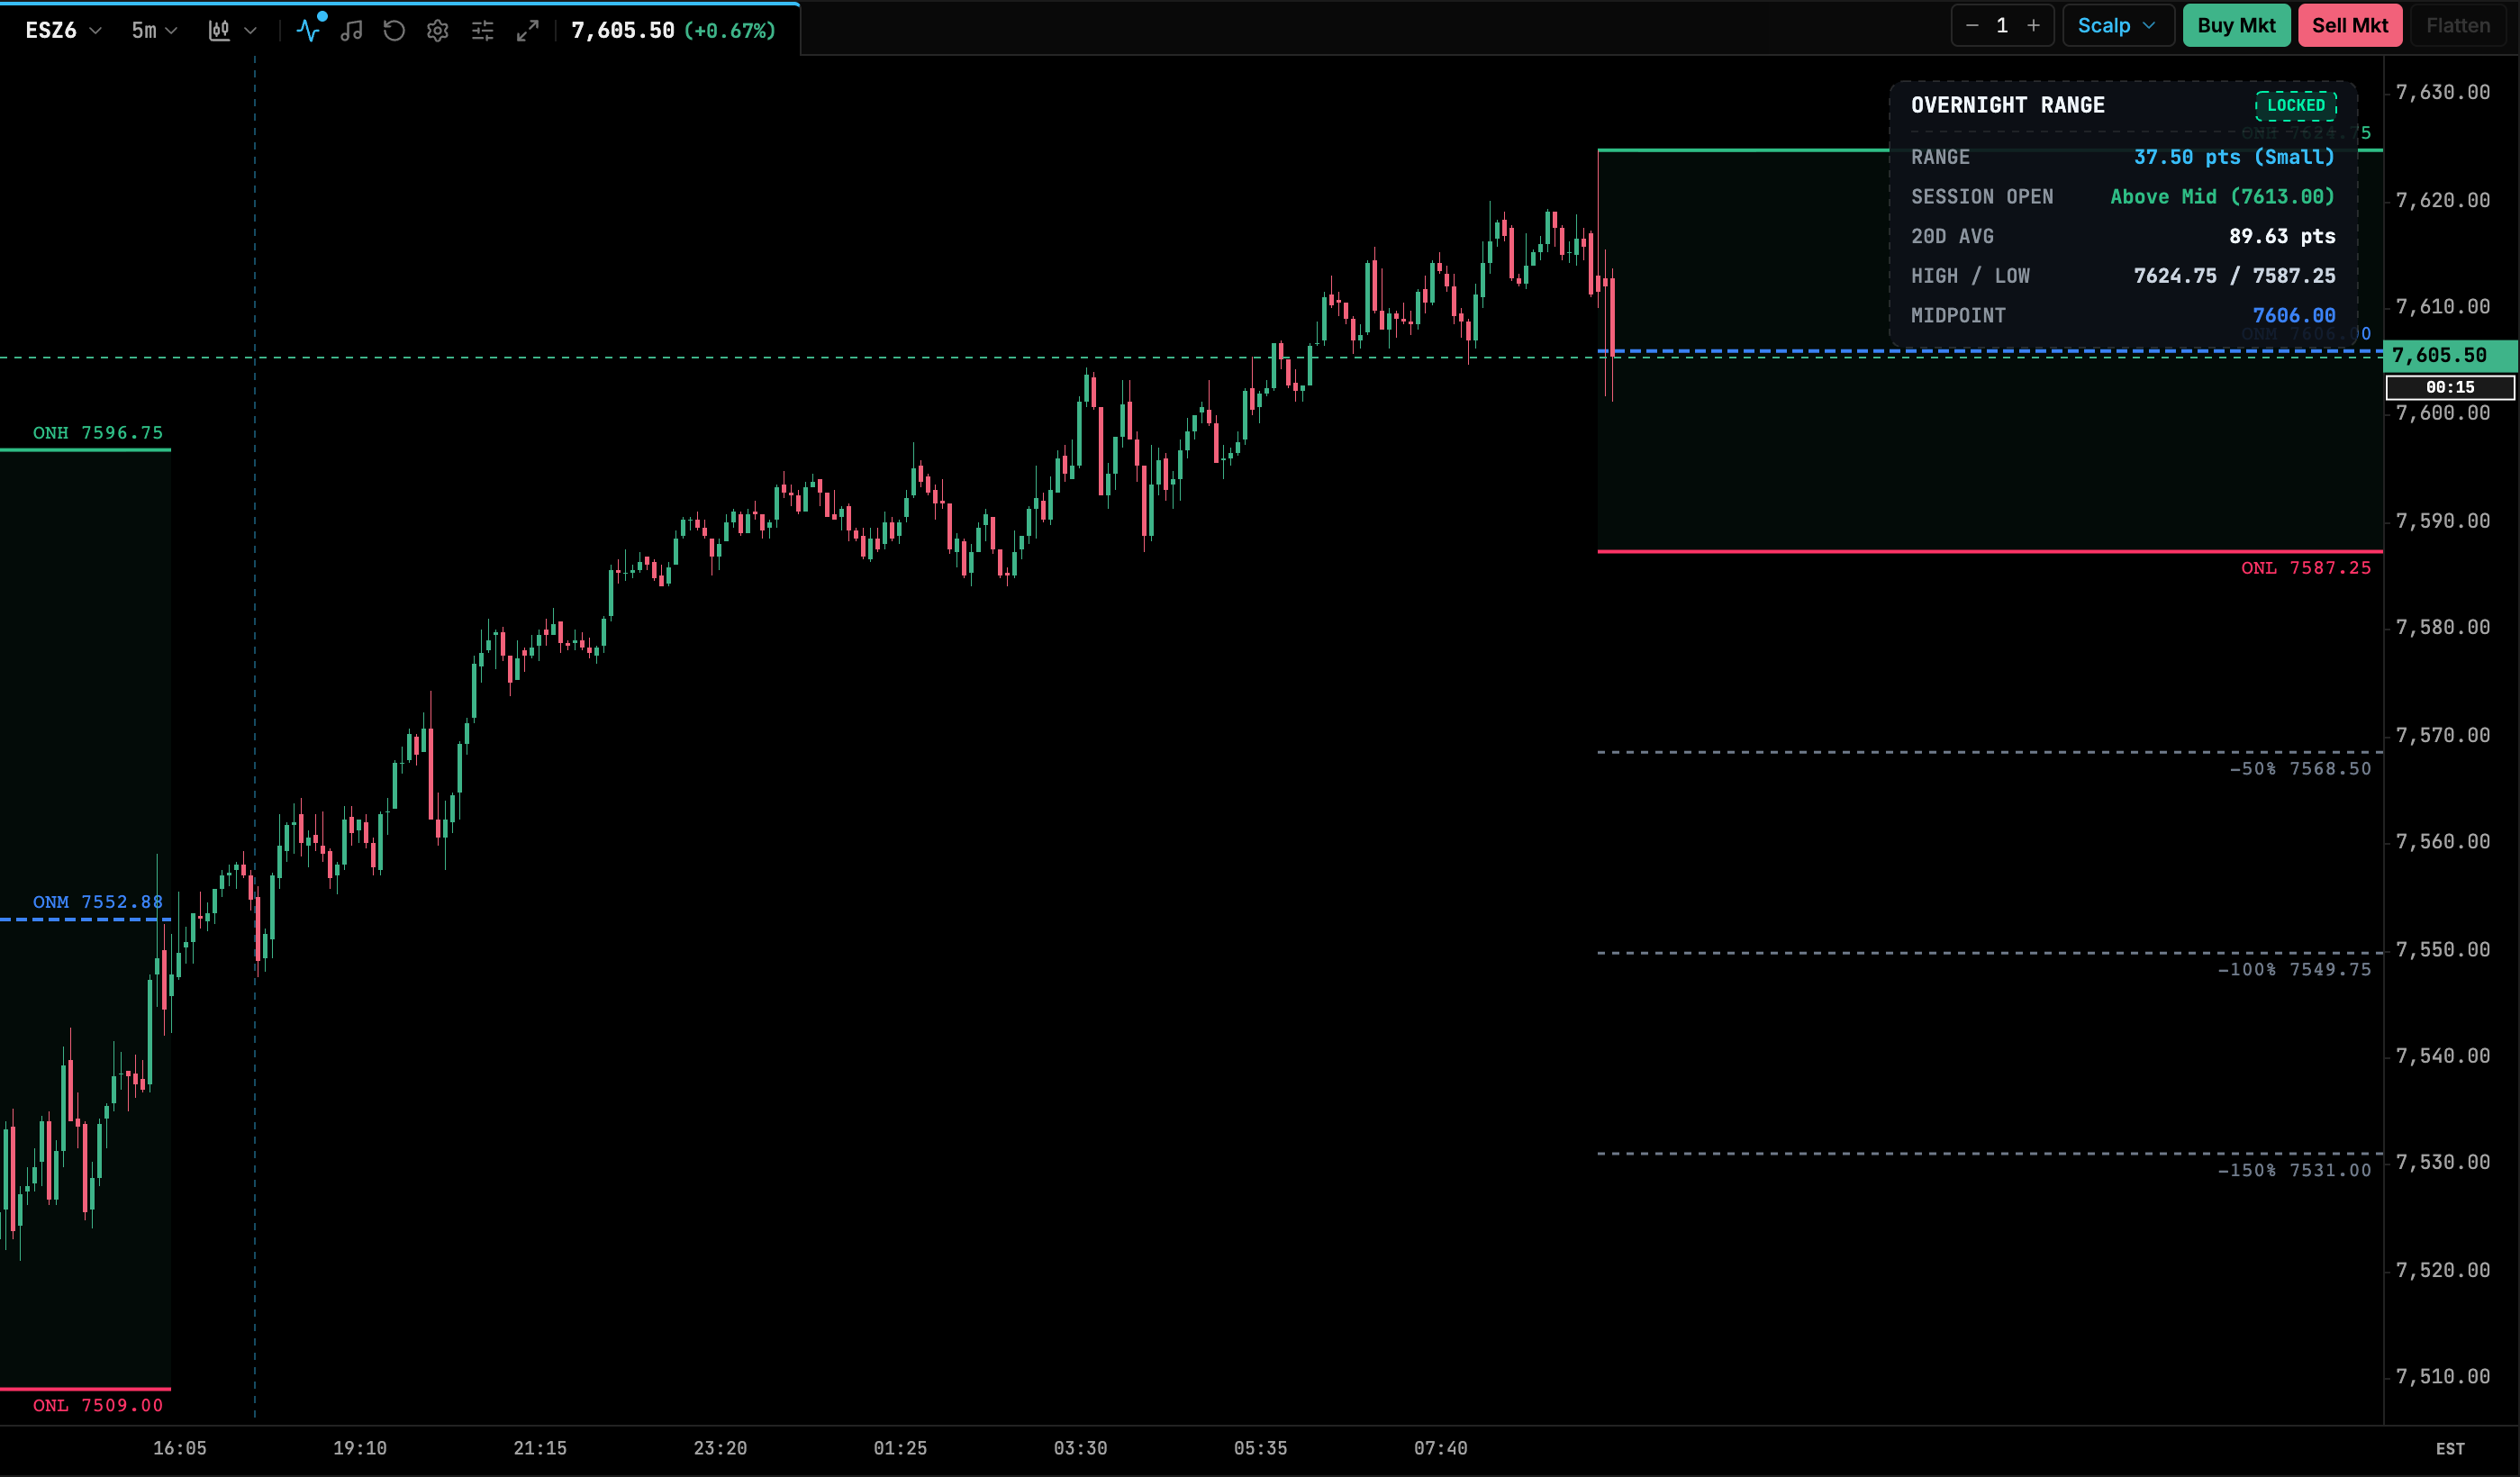
The high, midpoint and low of the overnight (pre-market) window, with optional range shading and ±50 %, ±100 % and ±150 % extensions of the range. Lines run until the daily cutoff time. A HUD at the top right shows:
- the range size, rated Small, Medium, Large or X-Large against the N-day average
- where the session opened relative to the midpoint
- the high, low and midpoint
Its status badge reads PRE-SESSION, then FORMING while the window is open, then LOCKED once it ends.
Setting the overnight window
The Session Times group has three time pickers, each in 24-hour HH:MM:
- Overnight Start (default
03:00): first minute of the overnight window. - Overnight End (default
09:30): last minute of the window. This is usually the RTH open. - Cutoff Time (default
16:00): when the day’s lines and extensions stop.
Times are read in the chart’s display time zone, which is shown at the bottom right of the chart’s time axis (for example EST). See Settings. To cover the whole Globex overnight, set a start later than the end, for example Overnight Start 18:00 and Overnight End 09:30. The window then starts the previous evening and ends on the trading day. Partly typed or cleared times are ignored until they form a valid HH:MM value, so the indicator always has a usable window.
| Setting | Default | Range / options | Notes |
|---|---|---|---|
| Session Scope | All Visible Sessions | All Visible Sessions, Current Session Only | |
| Overnight Start | 03:00 | HH:MM time |
See above. |
| Overnight End | 09:30 | HH:MM time |
|
| Cutoff Time | 16:00 | HH:MM time |
|
| Show Overnight High (ONH) / Mid (ONM) / Low (ONL) | on | on/off | One toggle each. |
| High / Mid / Low Line Color | #2EBD85 / #3B82F6 / theme bear | color | |
| Line Thickness | 2 | 1–5 (step 0.5) | |
| Line Style | Solid | Solid, Dashed, Dotted | |
| Shade Overnight Range | on | on/off | |
| Range Fill Color | #2EBD85 | color | |
| Fill Opacity (0.0 to 1.0) | 0.06 | 0–1 | |
| Show Extension Lines | on | on/off | Master toggle for extensions. |
| Show +/-50% / +/-100% / +/-150% Extension | on | on/off | One toggle each. |
| Extensions Color | rgba(148,163,184,0.75) | color | |
| Extensions Thickness | 1.5 | 1–4 | |
| Extend Active Day to Right Edge | on | on/off | |
| Draw End-of-Line Labels | on | on/off | |
| Label Font Size | 11 | 8–18 | |
| Label Vertical Offset | 4 | 0–12 | |
| Show Top-Right HUD Summary | on | on/off | |
| HUD Font Size | 11 | 9–16 | |
| HUD Background Opacity | 0.9 | 0–1 (step 0.05) | |
| Lookback Period (Days) | 20 | 1–100 | Days averaged for the HUD’s range comparison. |
Initial Balance
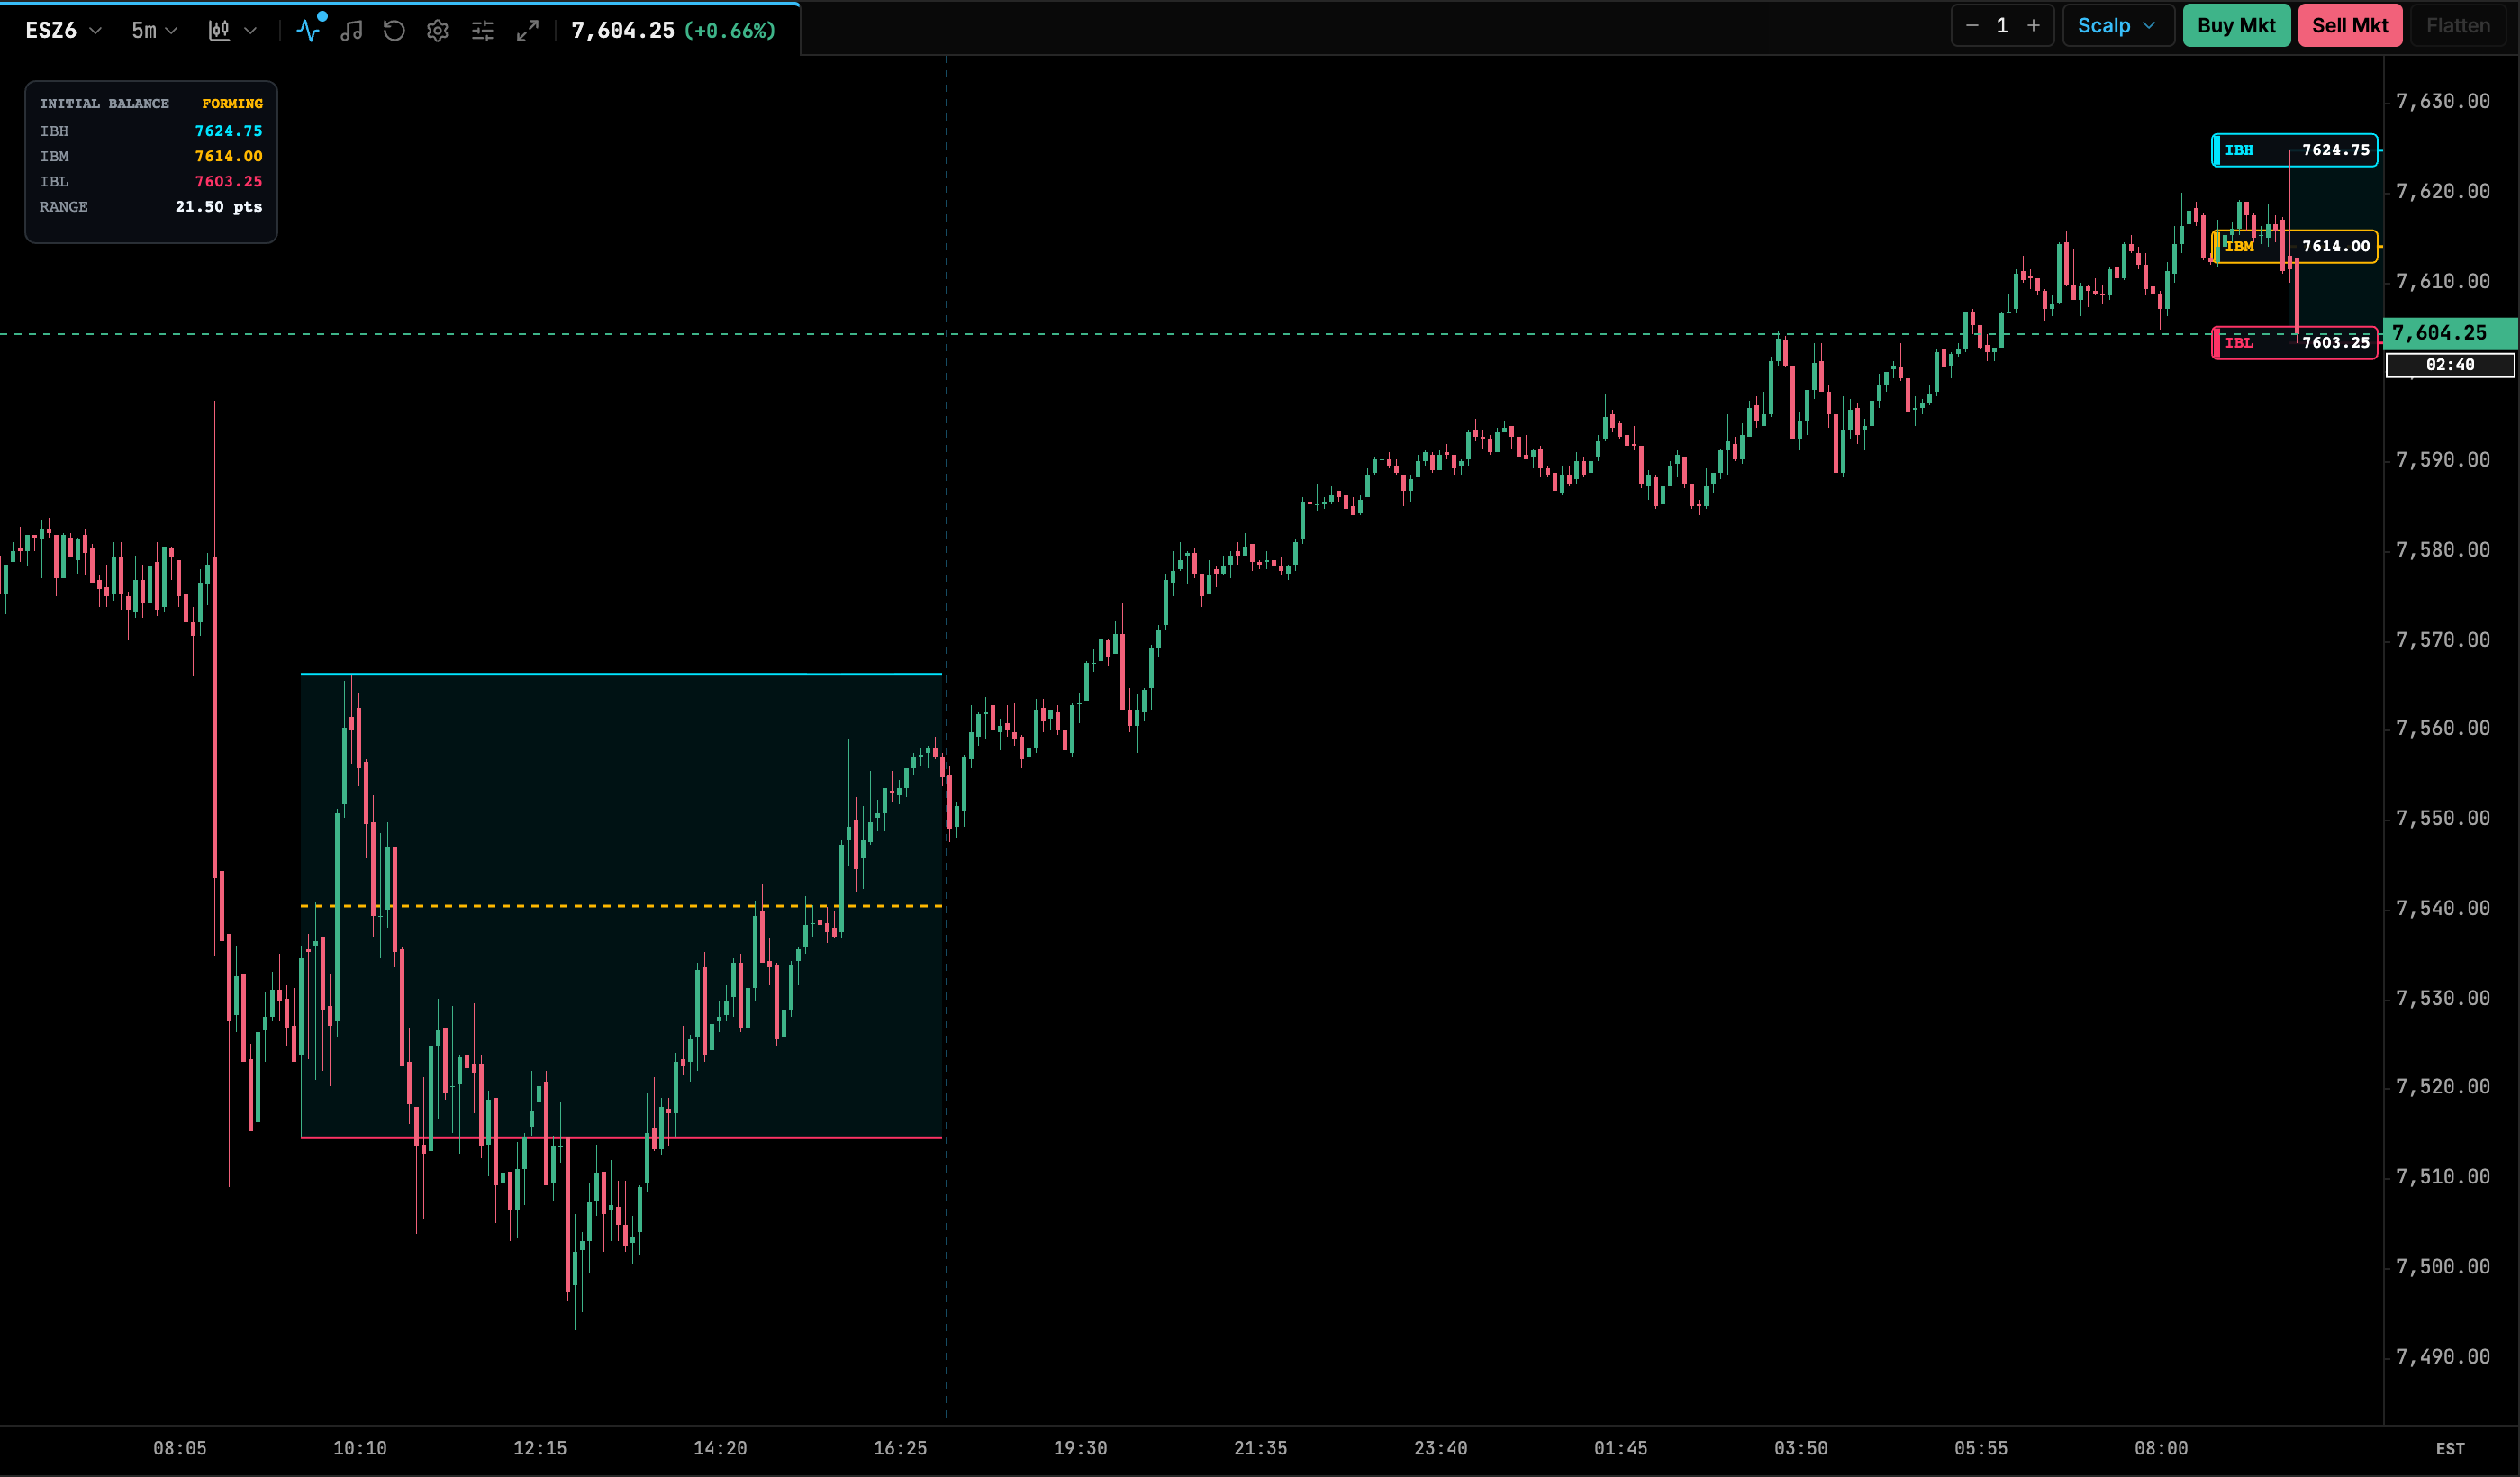
The high, low and midpoint of the first hour of the New York session (09:30–10:30 ET), with optional range shading, ±50 % and ±100 % extensions, price-axis badges and a summary HUD card. Traders use it for range and breakout setups and for extension targets. The IB window is fixed and can’t be changed.
| Setting | Default | Range / options | Notes |
|---|---|---|---|
| Session Scope | All Visible Sessions | All Visible Sessions, Current Session Only | |
| Show IB High (IBH) / Low (IBL) / Midpoint (IBM) | on | on/off | One toggle each. |
| IB High / Low / Midpoint Color | theme cyan / bear / amber | color | |
| Shade IB Range Area | on | on/off | |
| Range Fill Color | theme cyan | color | |
| Fill Opacity (0.0 to 1.0) | 0.08 | 0–1 | |
| Show IB Extensions (+50%, +100%, -50%, -100%) | off | on/off | |
| Extensions Color | rgba(0,229,255,0.45) | color | |
| Line Thickness | 1.5 | 1–4 | |
| Line Style | Solid | Solid, Dashed, Dotted | |
| Extend Active Session to Right Edge | on | on/off | |
| Show Price Axis Badges | on | on/off | |
| Show Summary HUD Card | on | on/off |
Pivot Points
Floor-trader pivot (P) plus resistance (R1–R4) and support (S1–S4) levels, computed from the prior session’s high, low and close. Choose a calculation model and how many R/S pairs to show. Traders use them as intraday support and resistance.
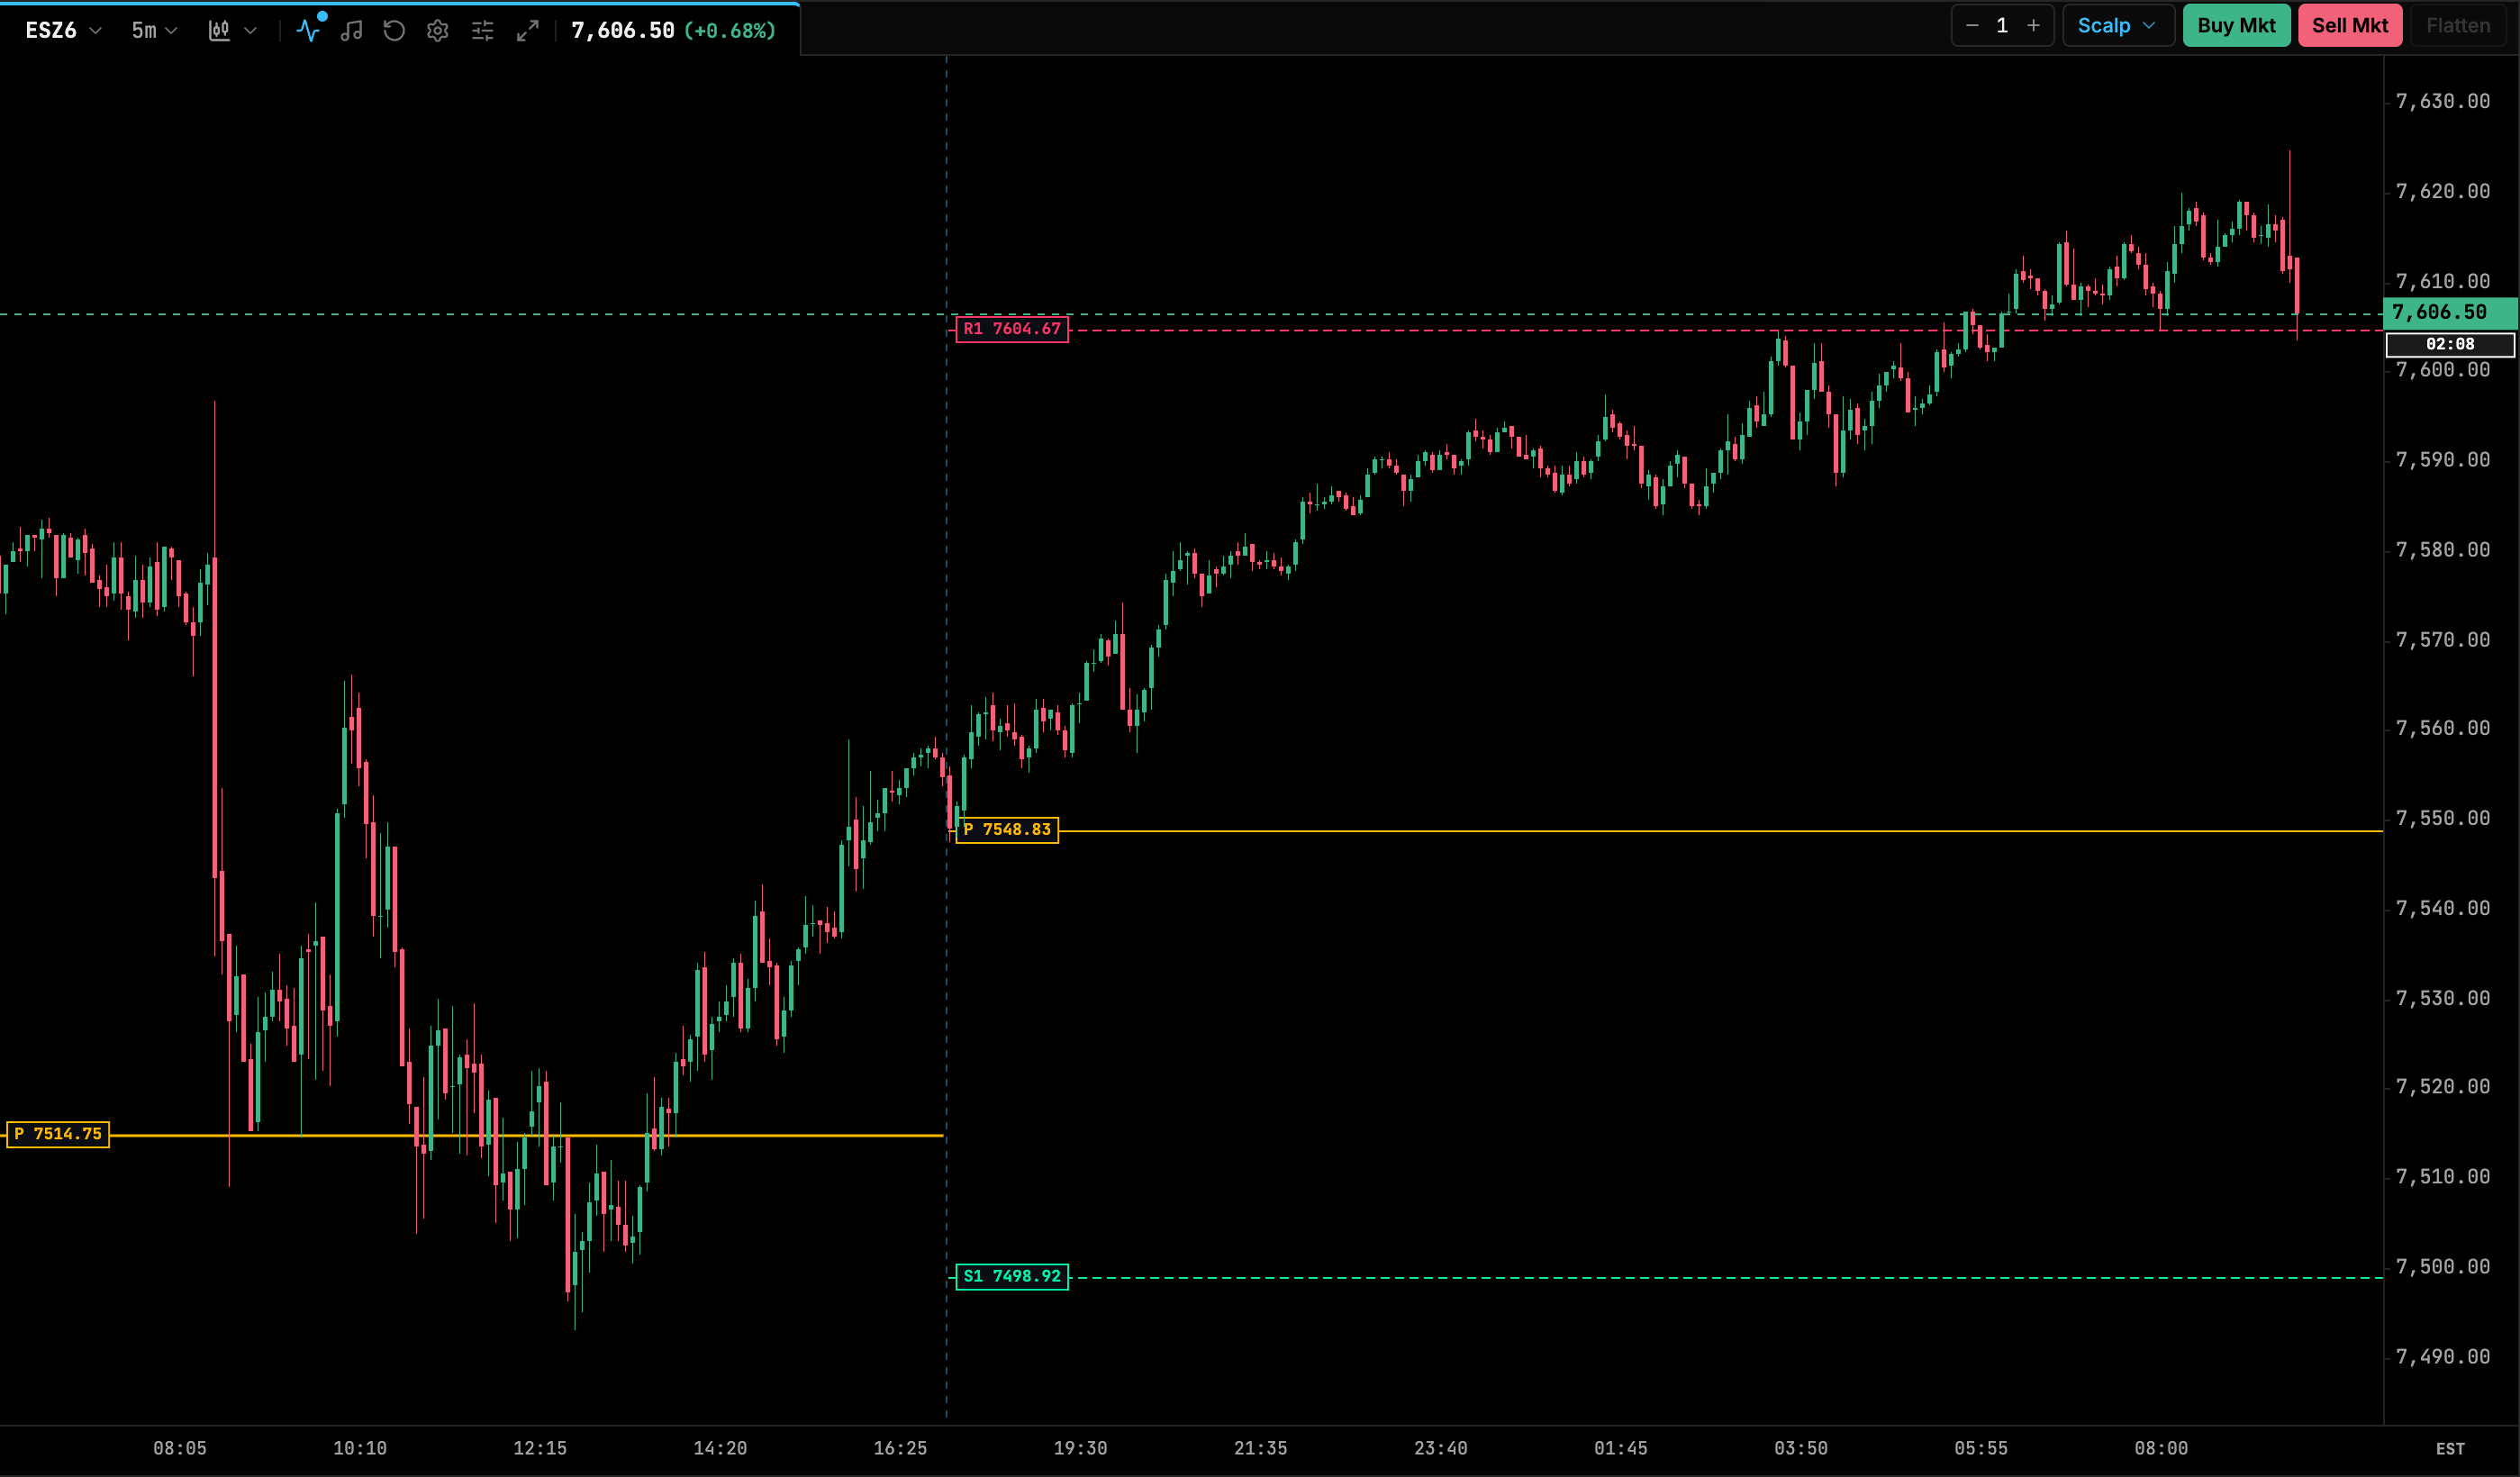
| Setting | Default | Range / options | Notes |
|---|---|---|---|
| Pivot Calculation Model | Traditional (Floor) | Traditional (Floor), Camarilla, Woodie, Fibonacci | |
| Levels To Display | 3 | 1–4 | Number of R/S pairs. |
| Pivot (P) Color | theme amber | color | |
| Resistance (R) Color | theme bear | color | |
| Support (S) Color | theme bull | color | |
| Line Thickness | 1.5 | ||
| Show Level Badges | on | on/off |
Swing Highs / Lows
Fractal pivot markers. A bar is a swing high when its high is above the highs of the Left bars before it and the Right bars after it. A swing low is the same with lows. A swing is confirmed only after the right-hand bars have closed, so markers appear a few bars late.
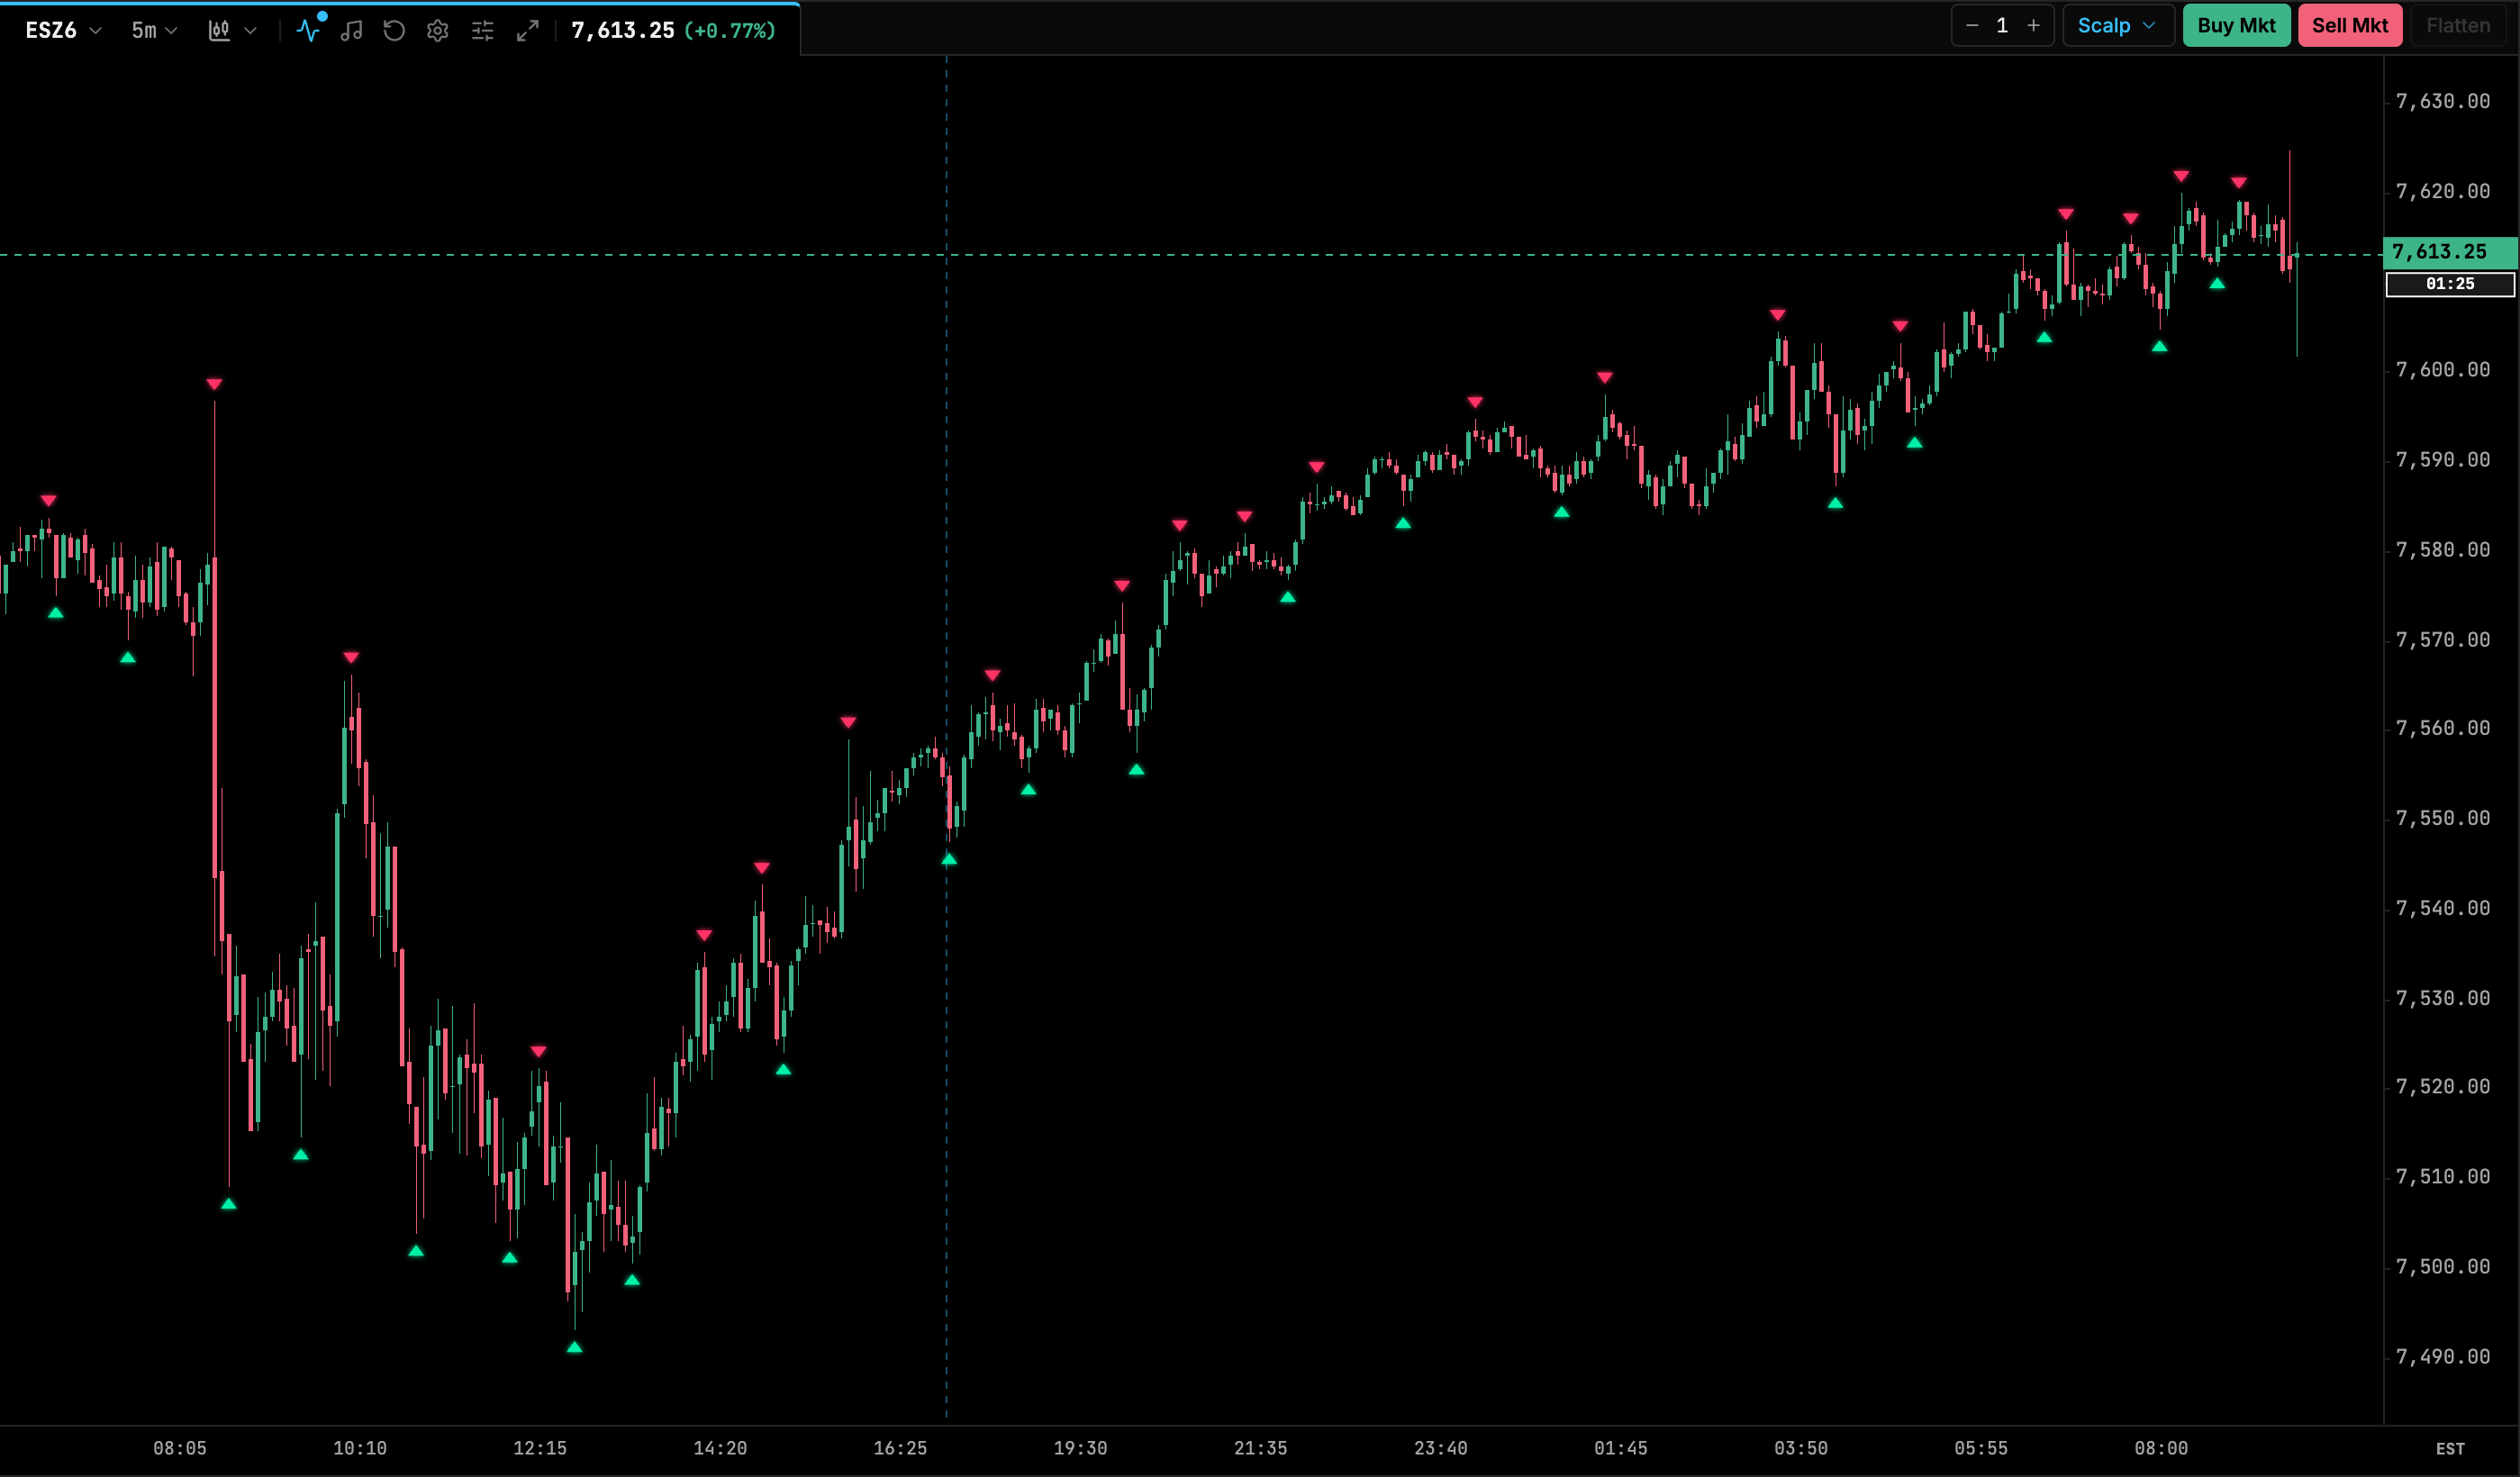
| Setting | Default | Range / options | Notes |
|---|---|---|---|
| Left Lookback Bars | 5 | 2–20 | |
| Right Lookback Bars | 5 | 2–20 | Confirmation delay. |
| Swing High Marker Color | theme bear | color | |
| Swing Low Marker Color | theme bull | color | |
| Marker Size | 6 | 4–12 |
Market Structure
Smart Money Concepts structure. Swings are labelled HH / HL / LH / LL. A break of the last swing in the trend direction is marked BOS (Break of Structure), and the first break against it is marked CHoCH (Change of Character). Traders use it for trend bias and for confirming reversals.
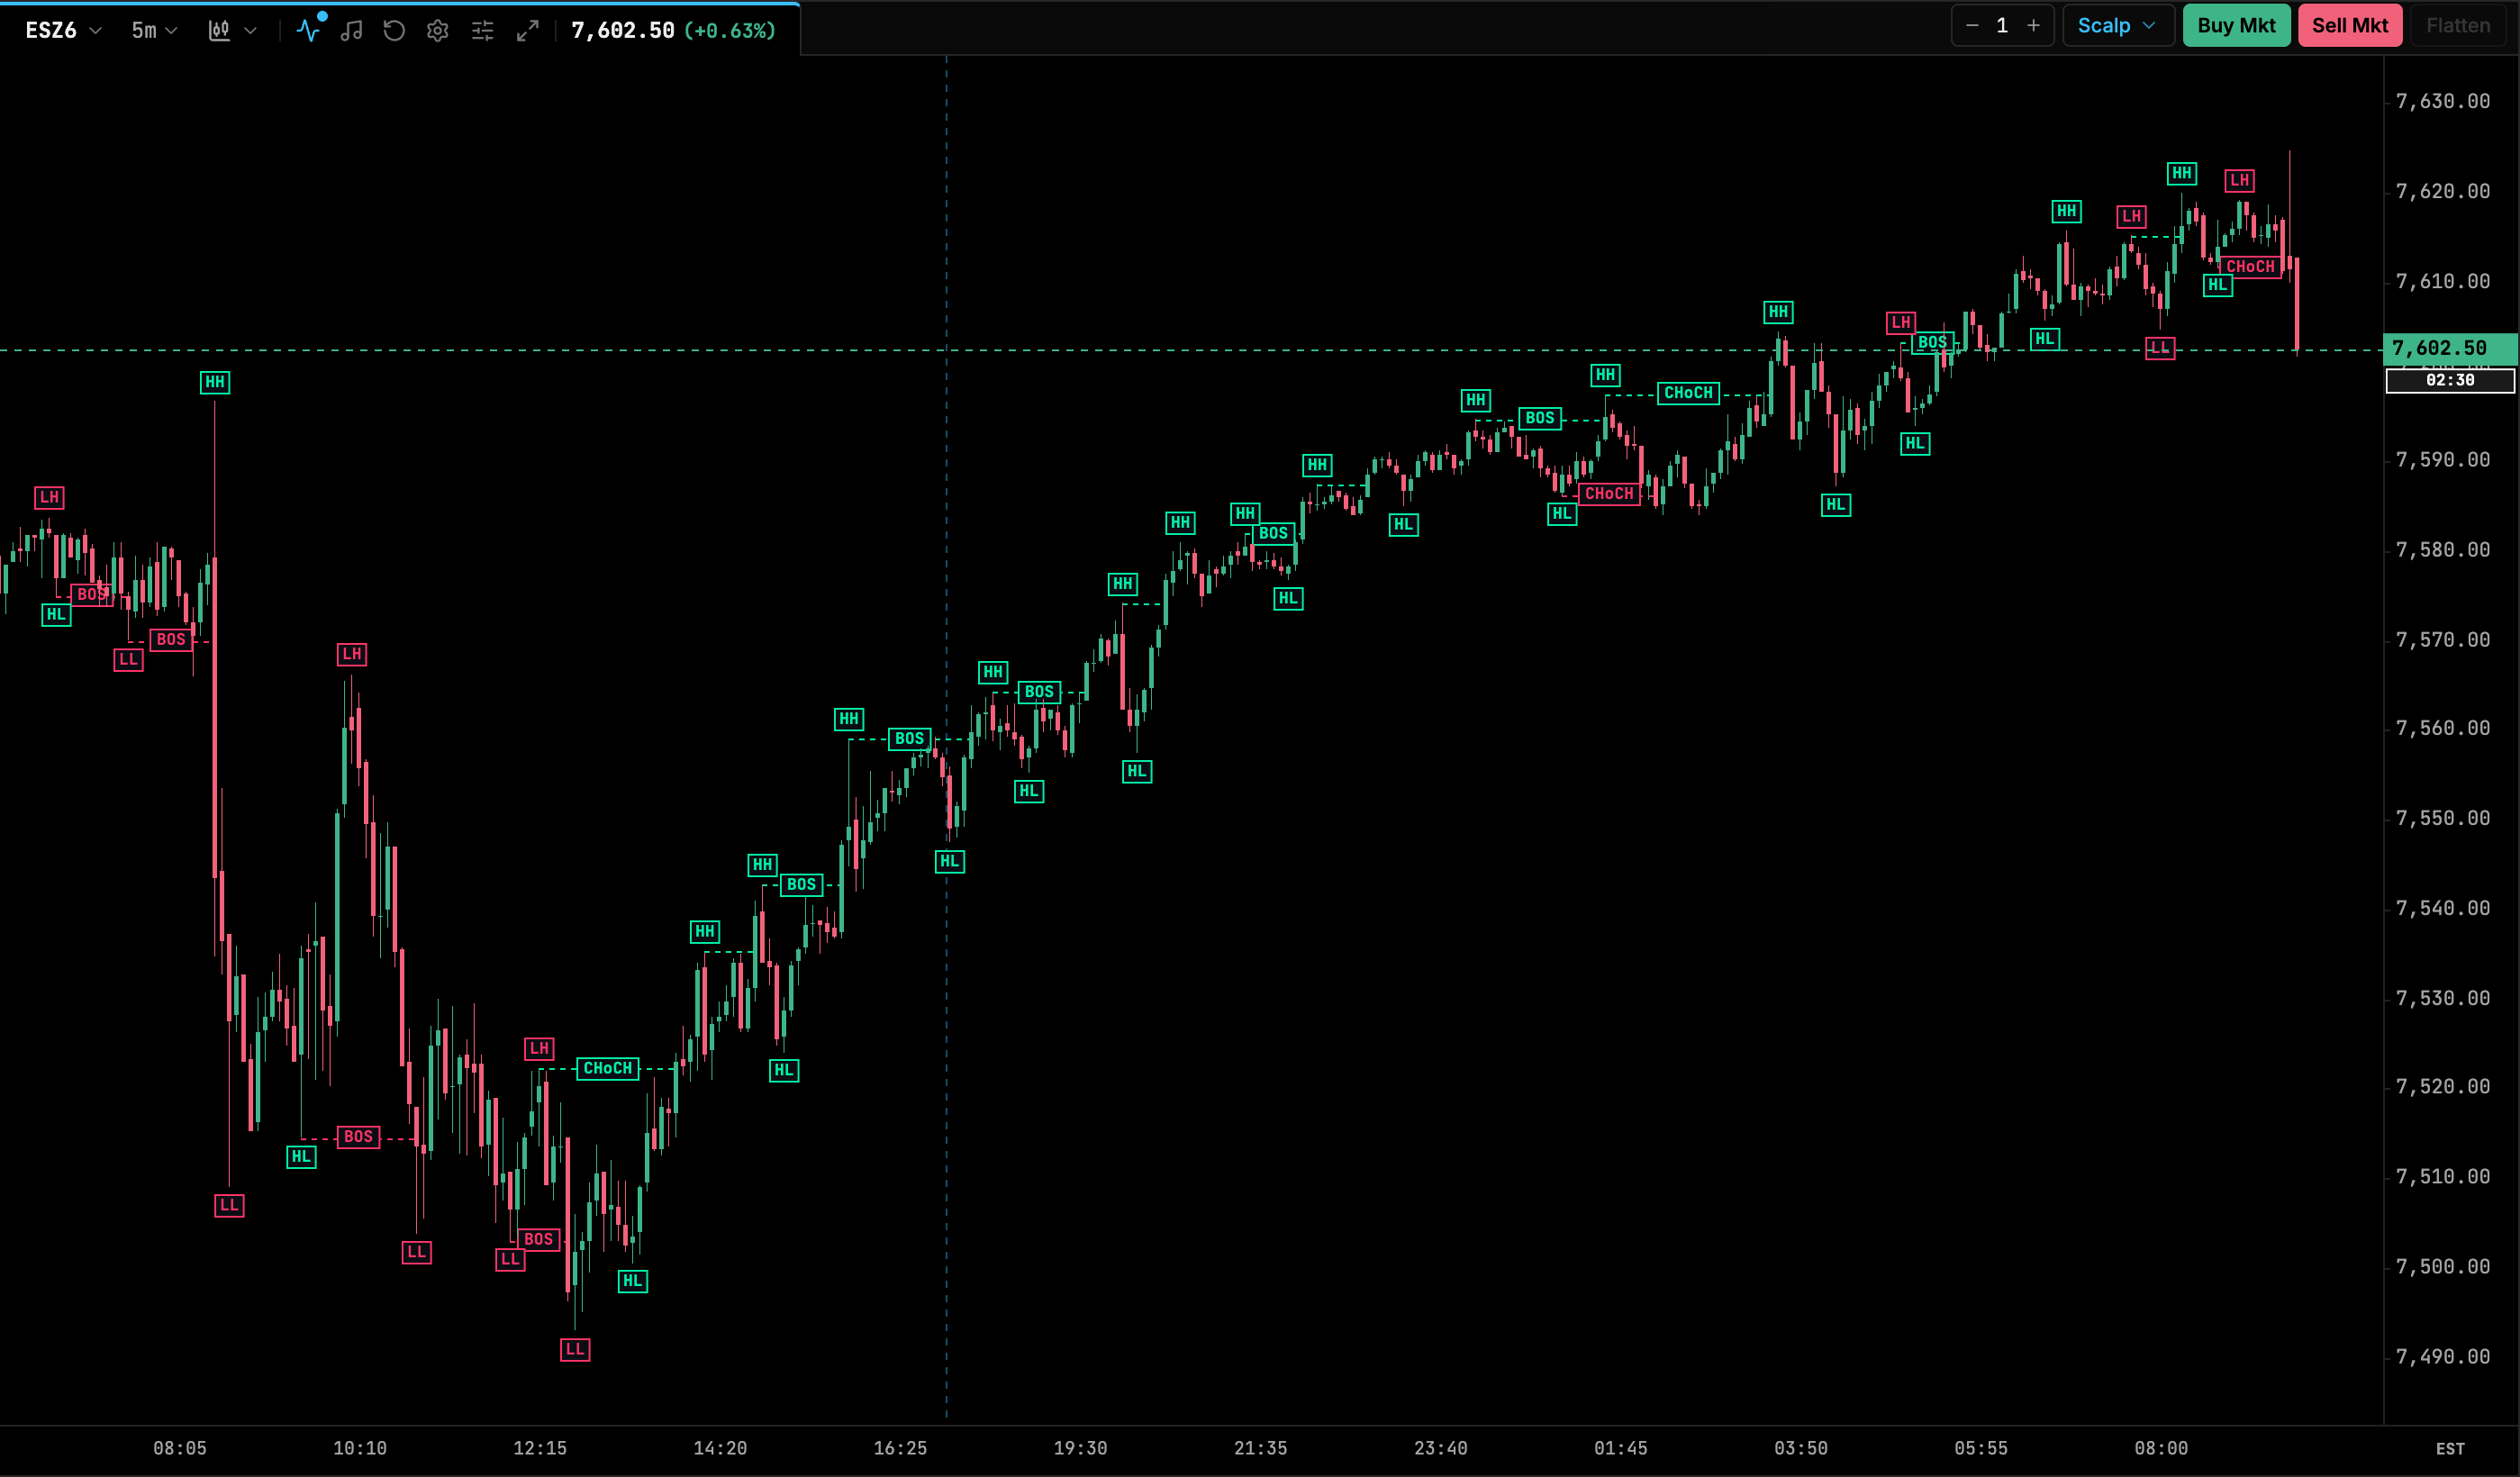
| Setting | Default | Range / options | Notes |
|---|---|---|---|
| Swing Lookback Bars | 5 | 2–20 | |
| Breakout Confirmation Mode | Candle Close | Candle Close, Intrabar Wick | What counts as a break. |
| Show Swing Labels (HH, HL, LH, LL) | on | on/off | |
| Show Break of Structure (BOS) | on | on/off | |
| Show Change of Character (CHoCH) | on | on/off | |
| Reset Structure on New Session | off | on/off | |
| Bullish / Bearish Color | theme bull / bear | color |
Fair Value Gaps
Three-candle imbalances: gaps between candle 1’s wick and candle 3’s wick that candle 2 left untraded. Each gap is drawn as a zone extended to the right. The zone shrinks as later wicks trade into it (mitigation) and is removed once fully filled. Traders use FVGs as retracement entry zones and as targets.
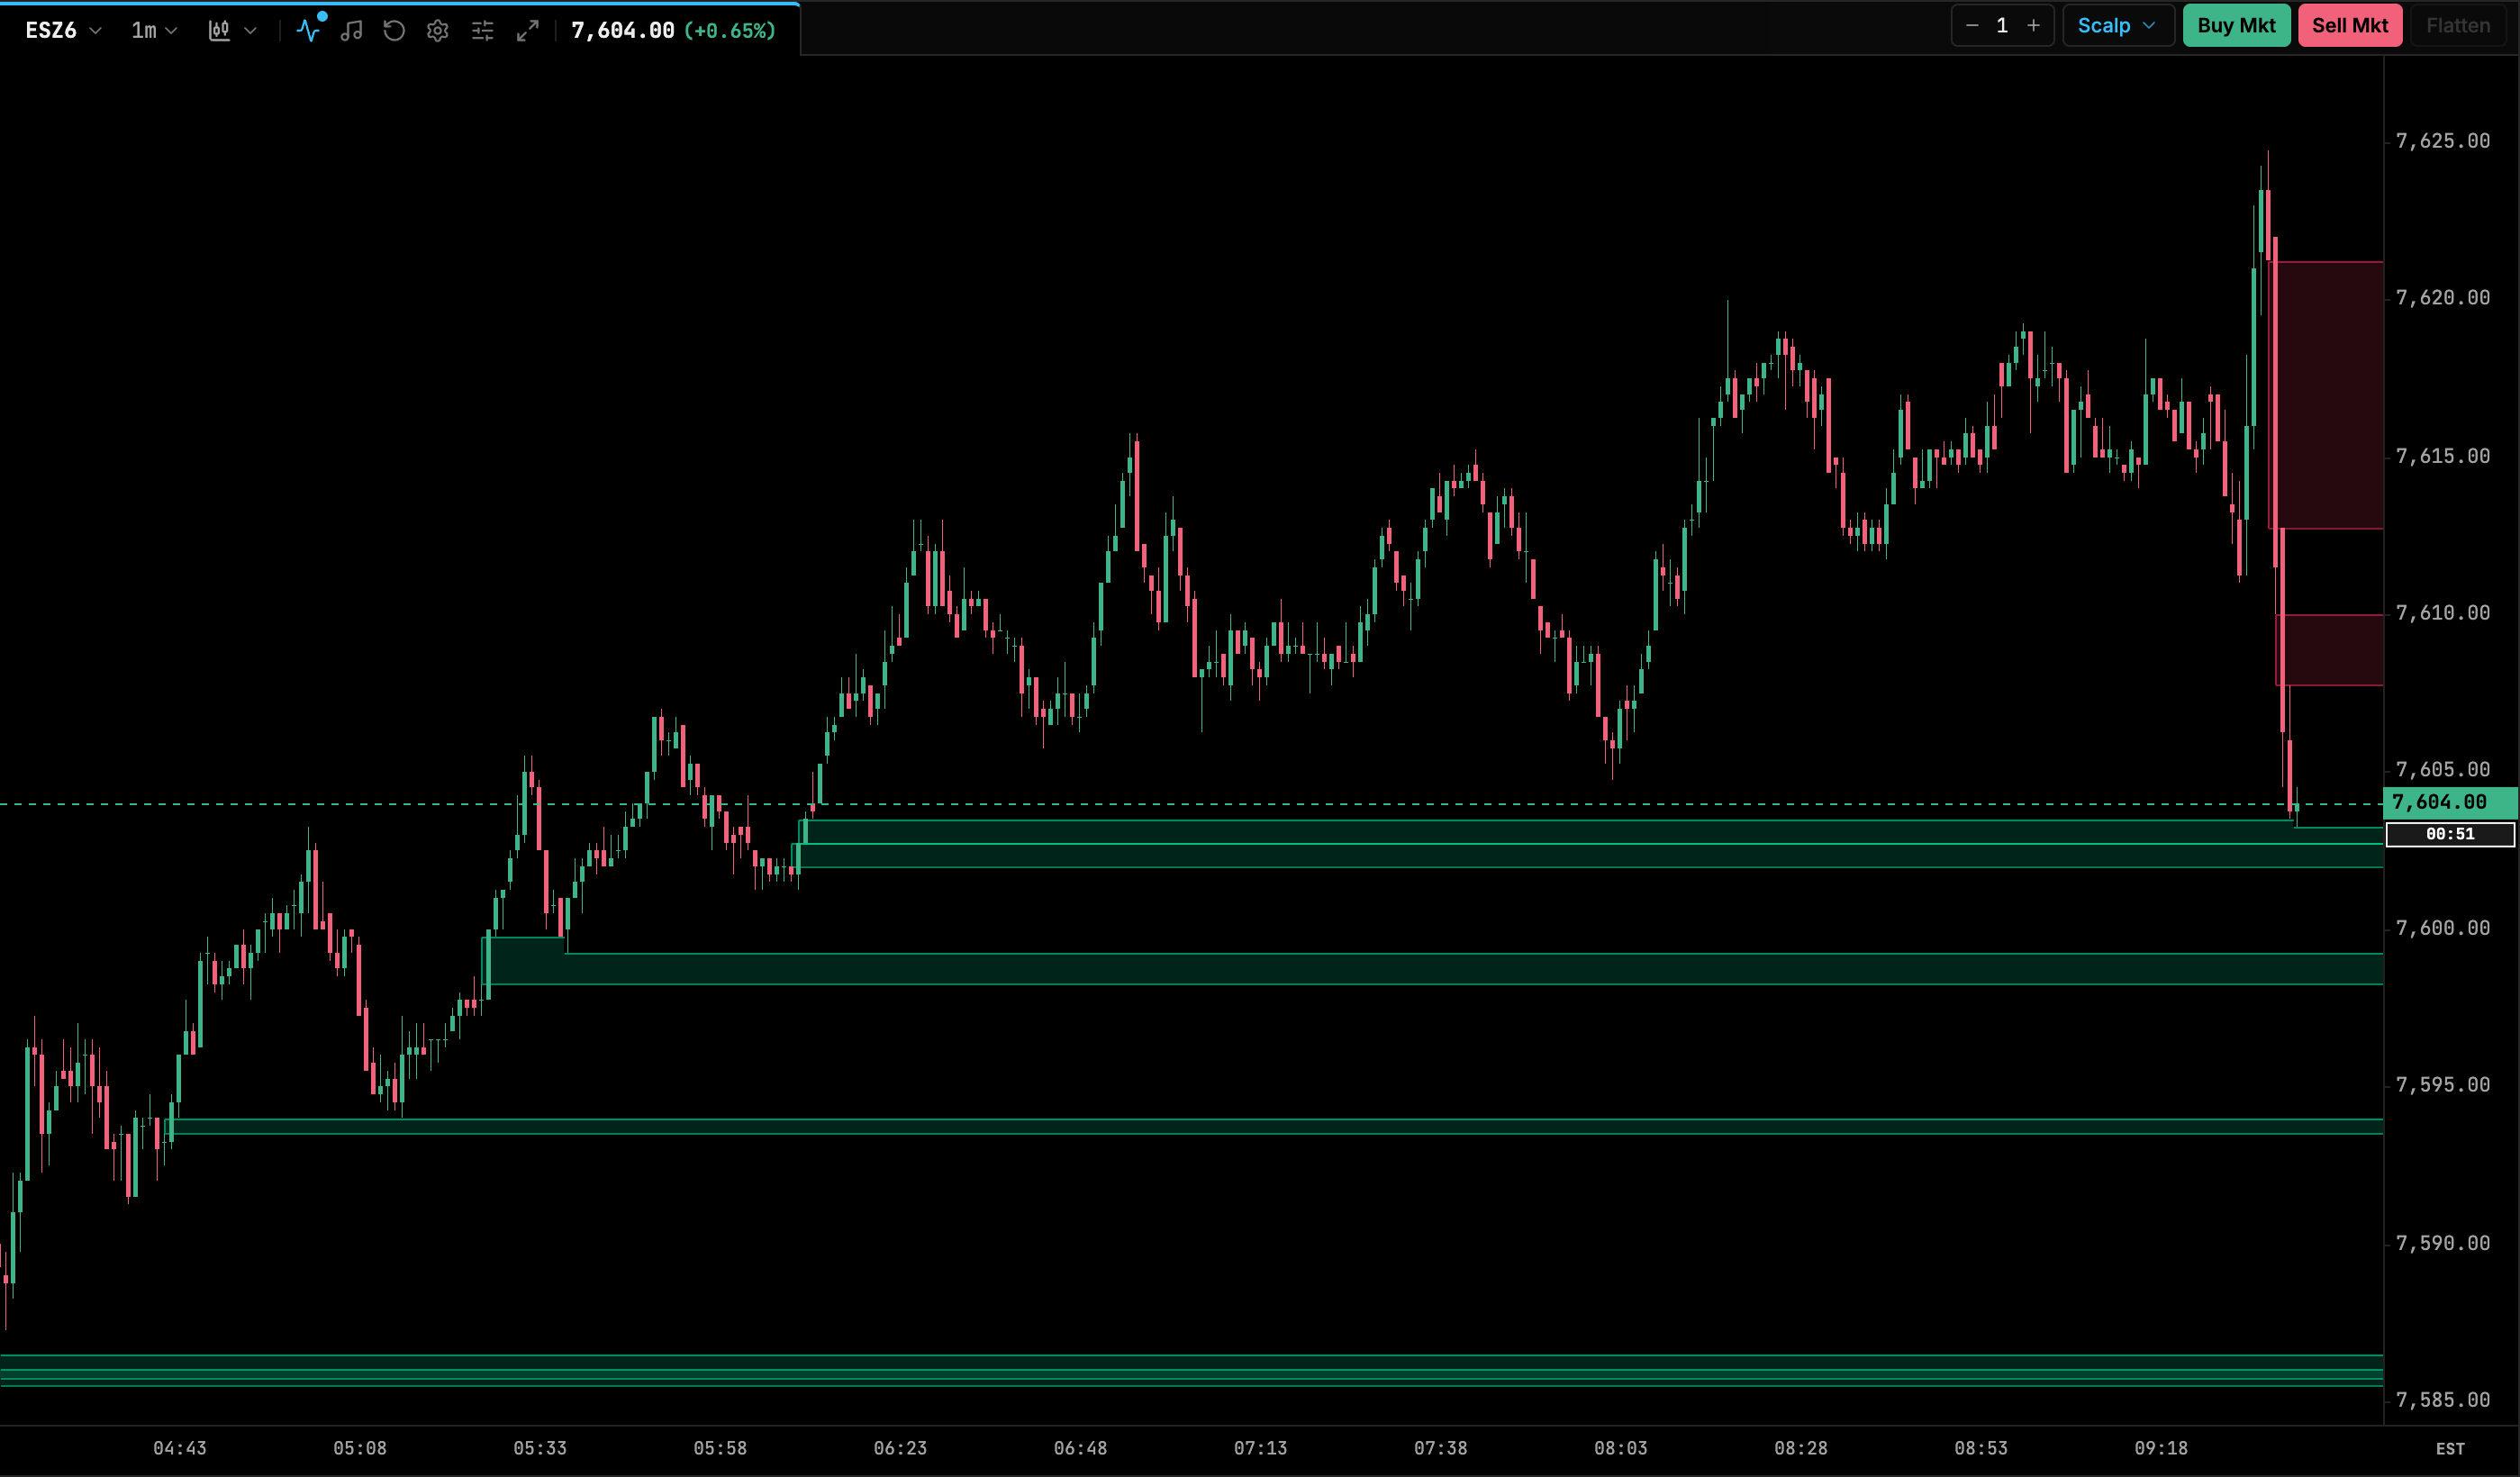
| Setting | Default | Range / options | Notes |
|---|---|---|---|
| Minimum Gap (Ticks) | 1 | 1–200 | Smaller gaps are ignored. |
| Show Bullish Gaps | on | on/off | |
| Show Bearish Gaps | on | on/off | |
| Max Open Gaps Shown | 20 | 1–200 | Most recent unfilled gaps. |
| Bullish / Bearish Color | theme bull / bear | color | |
| Fill Opacity | 0.15 | 0.02–0.8 | |
| Show Border | on | on/off |
Reversal Levels
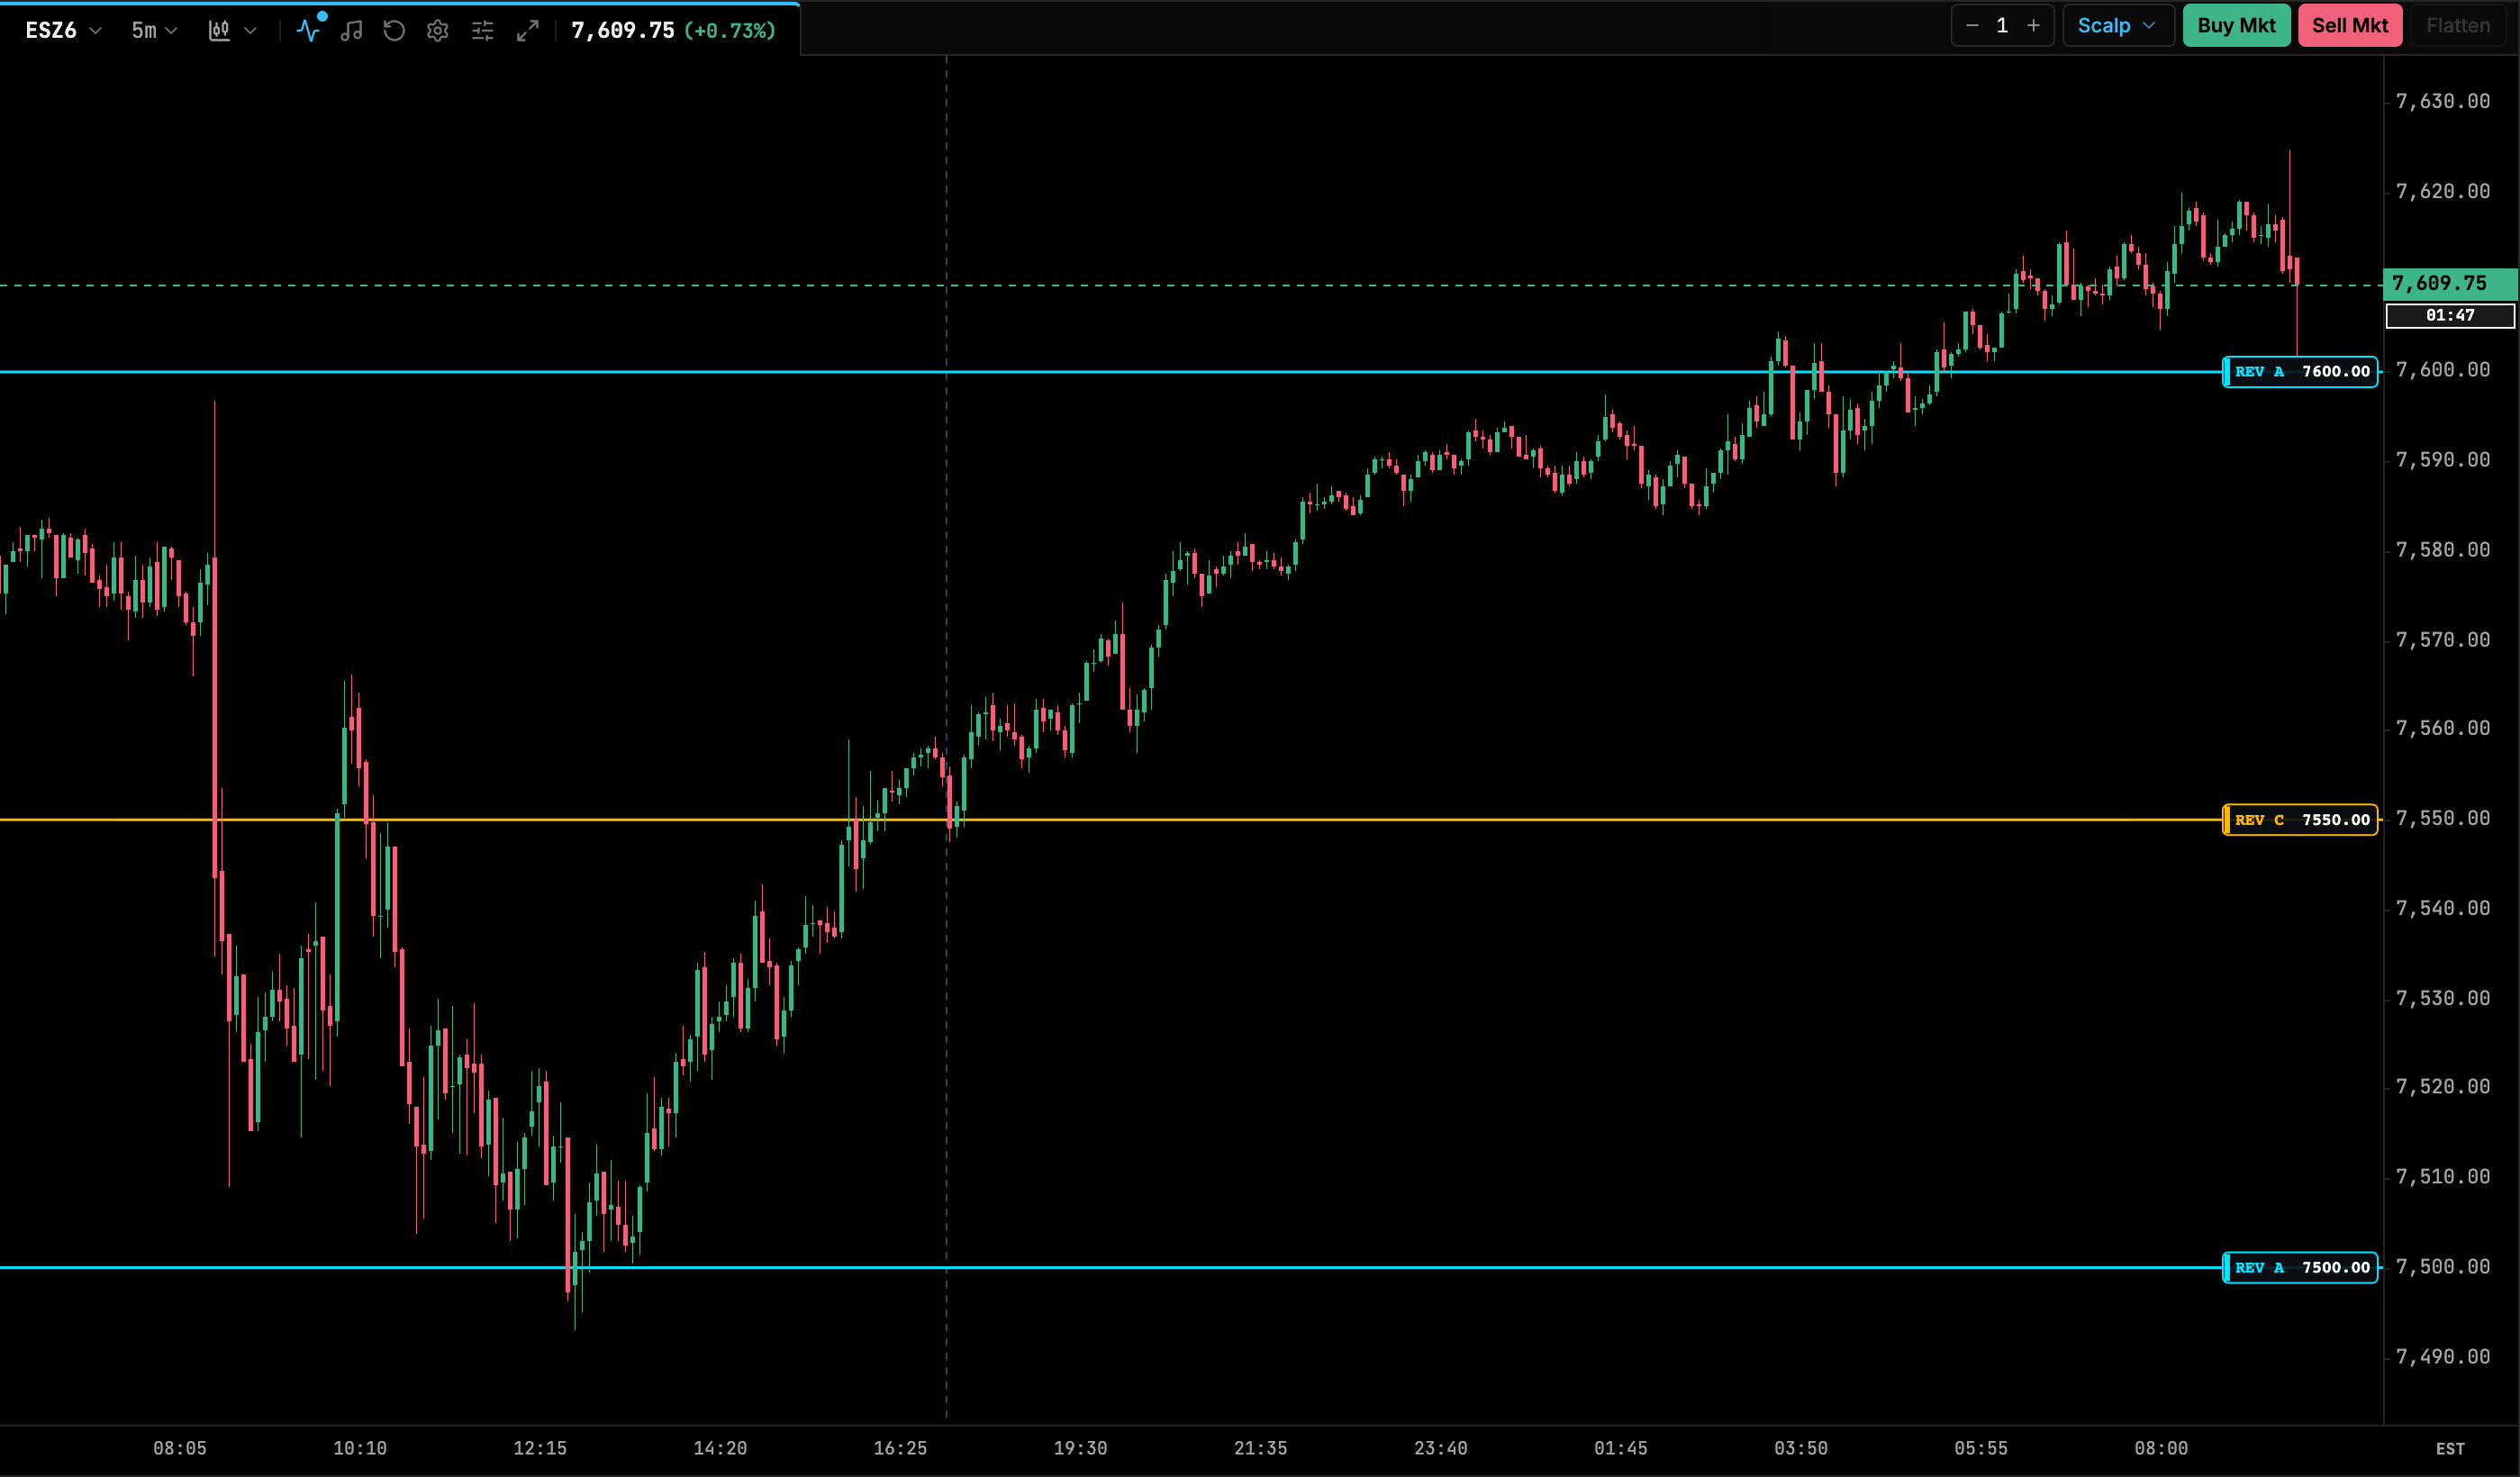
Levels that repeat at fixed offsets inside every block of N points. With the default 100-point block they fall at xx00 (A), xx50 (C), and optionally xx26 (B) and xx77 (D). Each level can have an asymmetric zone defined by top and bottom offsets inside the block. Zones may wrap across a block boundary; for example, Zone A runs from xx92 up to xx12 around each xx00. Designed for round-number reversals in index futures. Badges on the right axis are spaced so they don’t overlap.
| Setting | Default | Range / options | Notes |
|---|---|---|---|
| Block Interval | 100 | 1–10000 | Points per repeating block. |
| Show Right-Axis Badges | on | on/off | |
| Plot Primary Lines (A & C) | on | on/off | |
| Level A Offset / Color / Line Style / Width | 0 / theme cyan / Solid / 1.5 | 0–99 / color / Solid, Dashed, Dotted / 0.5–5 | |
| Draw A Zones | off | on/off | Zone A Top Ending 12, Bottom Ending 92, Opacity 15 %. |
| Level C Offset / Color / Line Style / Width | 50 / theme amber / Solid / 1.5 | ||
| Draw C Zones | off | on/off | Zone C Top Ending 60, Bottom Ending 40, Opacity 15 %. |
| Plot Secondary Lines (B & D) | off | on/off | |
| Level B Offset / Color / Line Style / Width | 26 / theme purple / Dashed / 1.5 | ||
| Draw B Zones | off | on/off | Zone B Top Ending 36, Bottom Ending 16, Opacity 15 %. |
| Level D Offset / Color / Line Style / Width | 77 / theme bear / Dashed / 1.5 | ||
| Draw D Zones | off | on/off | Zone D Top Ending 87, Bottom Ending 67, Opacity 15 %. |
Zone top and bottom endings are offsets of 0–99 within the block. Zone opacity is 1–100 %.