Drawing Tools
The drawing toolbar runs down the left edge of each chart window. Pick a tool, then click (or click and drag) on the chart to place it.

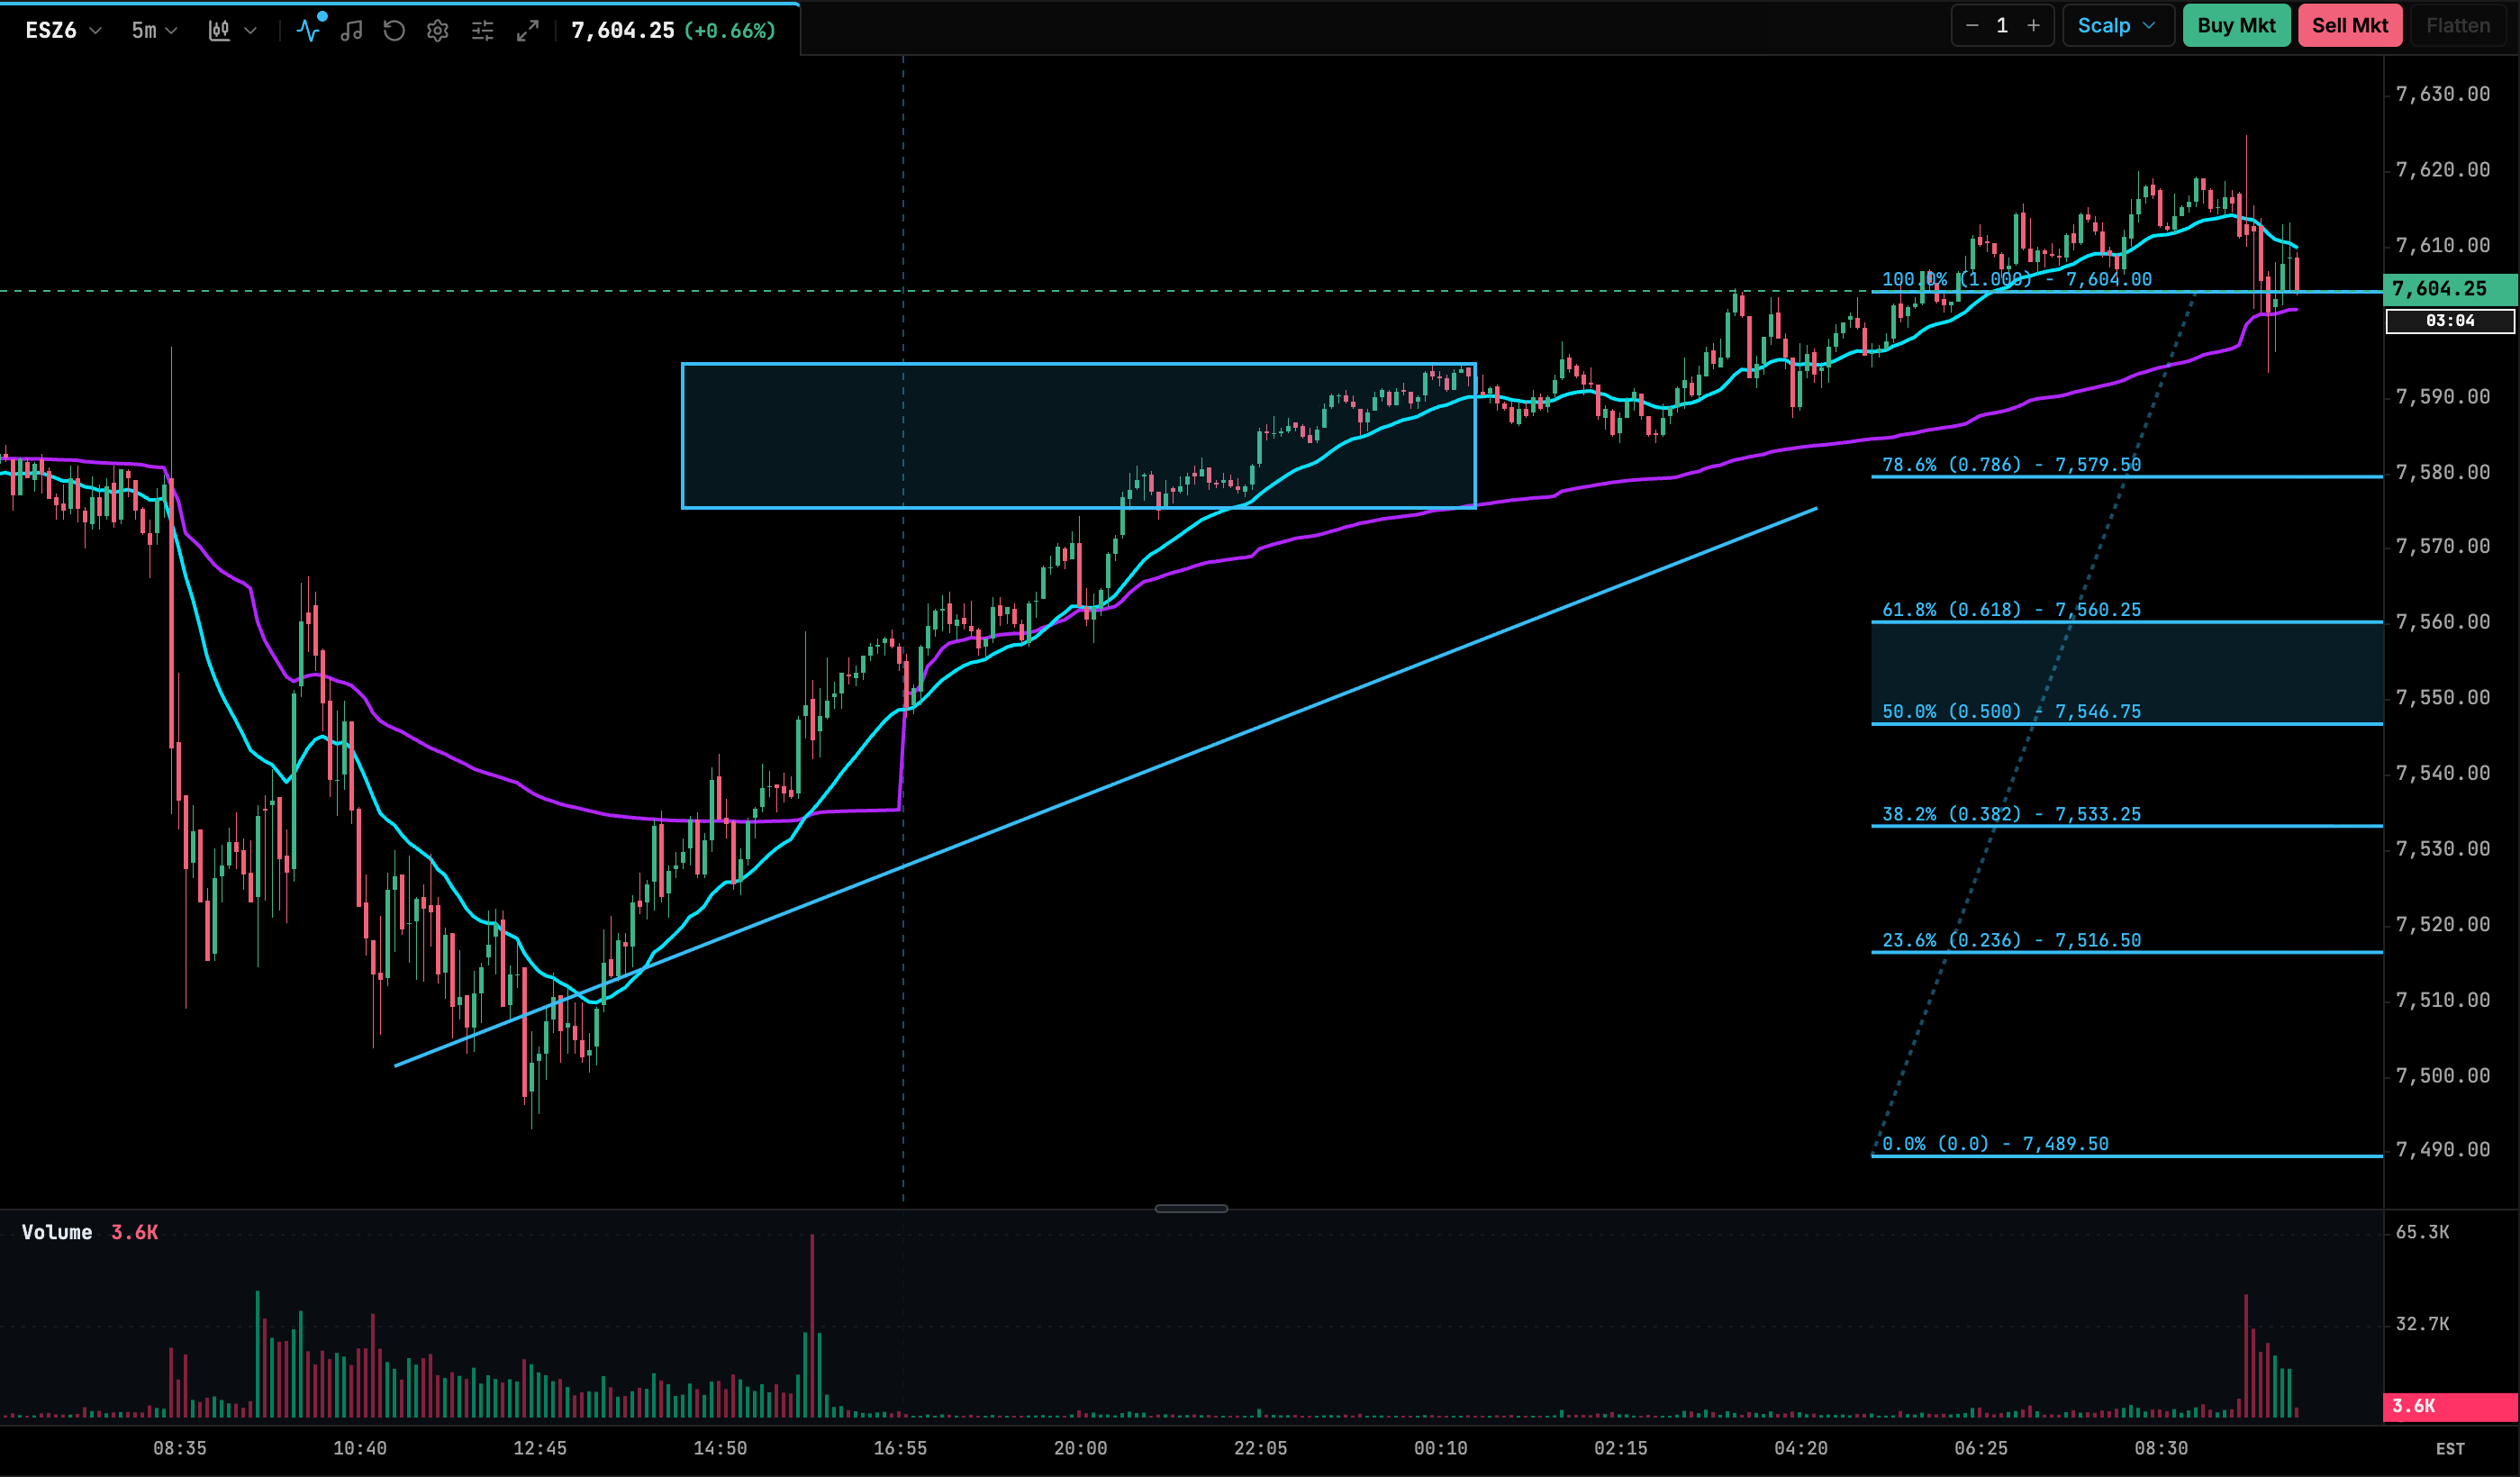
Tools and hotkeys
Tools are listed in toolbar order.
| Tool | Hotkey | Use |
|---|---|---|
| Select / Move | V | Select, move and resize drawings |
| Trendline | T | Line between two points |
| Extended Ray | R | Line from a point through a second point, extended to the right |
| Trend Channel | Shift+R | Parallel channel |
| Horizontal Line | H | Full-width price level |
| Horizontal Segment | Shift+H | Price level between two times |
| Vertical Line | L | Time marker |
| Rectangle (Zone) | B | Price / time zone |
| Ellipse | E | Ellipse |
| Cup | U | Cup (rounded base) shape |
| Range Box | G | Box that measures the range between two points |
| Fibonacci Retracement | F | Retracement levels between a swing high and low |
| Measure / Ruler | M | Distance in price, ticks and time |
| Measured Move | Shift+M | Projects a prior swing from a new point |
| Range Profile | Shift+P | Volume profile of the selected time range |
| Anchored VWAP | Shift+V | VWAP anchored at a chosen bar |
| Long Position | Shift+L | Long risk/reward planner (entry, target, stop) |
| Short Position | Shift+S | Short risk/reward planner |
| Text Annotation | N | Free text on the chart |
Other keys:
| Key | Action |
|---|---|
| C | Crosshair |
| Delete / Backspace | Delete the selected drawing |
| Esc | Cancel the drawing in progress, or deselect |
The Hand (pan) tool has no hotkey.
Toolbar options
The buttons at the bottom of the toolbar apply to new drawings and to the whole window:
| Control | Description |
|---|---|
| Default Drawing Color | Color used for new drawings (default: Cyan #00E5FF). The palette comes from the active theme |
| Continuous Drawing | ON: the tool stays selected after each drawing. OFF (default behavior): the cursor reverts to Select after one drawing |
| Trash | Clears all drawings in this window (its tooltip shows how many there are) |
Edit a drawing
- Select the drawing with the Select tool (V) or by clicking it.
- Drag the drawing to move it, or drag a handle to reshape it.
- Use the floating menu that appears above it to change the style.
- Press Delete, or click the delete button in the floating menu, to remove it.
The floating menu offers:
| Option | Applies to |
|---|---|
| Color swatches | All drawings |
| Line width (1, 2, 3 px) and Solid / Dashed | Line-based drawings |
| Global: sync the drawing to every chart of the same instrument | All drawings |
| Bands: show or hide the ±1σ and ±2σ deviation bands | Anchored VWAP |
| Qty: 1, 2, 5 or 10 contracts for the P&L readout | Long / Short Position |
| Display mode (Vol, B/A, Δ), POC, VA, Lbl, ΔTrend, profile width, opacity and value area % | Range Profile |
| Delete (Del) and Deselect (Esc) | All drawings |
Text annotations
Double-click a text drawing to edit it. Press Enter to save or Esc to cancel.