Volatility Indicators
Volatility indicators show how much price is moving, which helps with stop placement, position sizing and spotting compression before an expansion. ATR draws in its own sub-pane. The three channel indicators overlay the price chart with a shaded band. All four are calculated from bar data, so they work on every bar type and in Market Replay. See the Indicators Overview.
Average True Range
The Wilder-smoothed average of true range. True range is the largest of high − low, the distance from the prior close to the high, and the distance from the prior close to the low. ATR is measured in price units, so on ES a reading of 4 means a typical bar spans about 4 points. Use it to size stops and targets to current conditions.
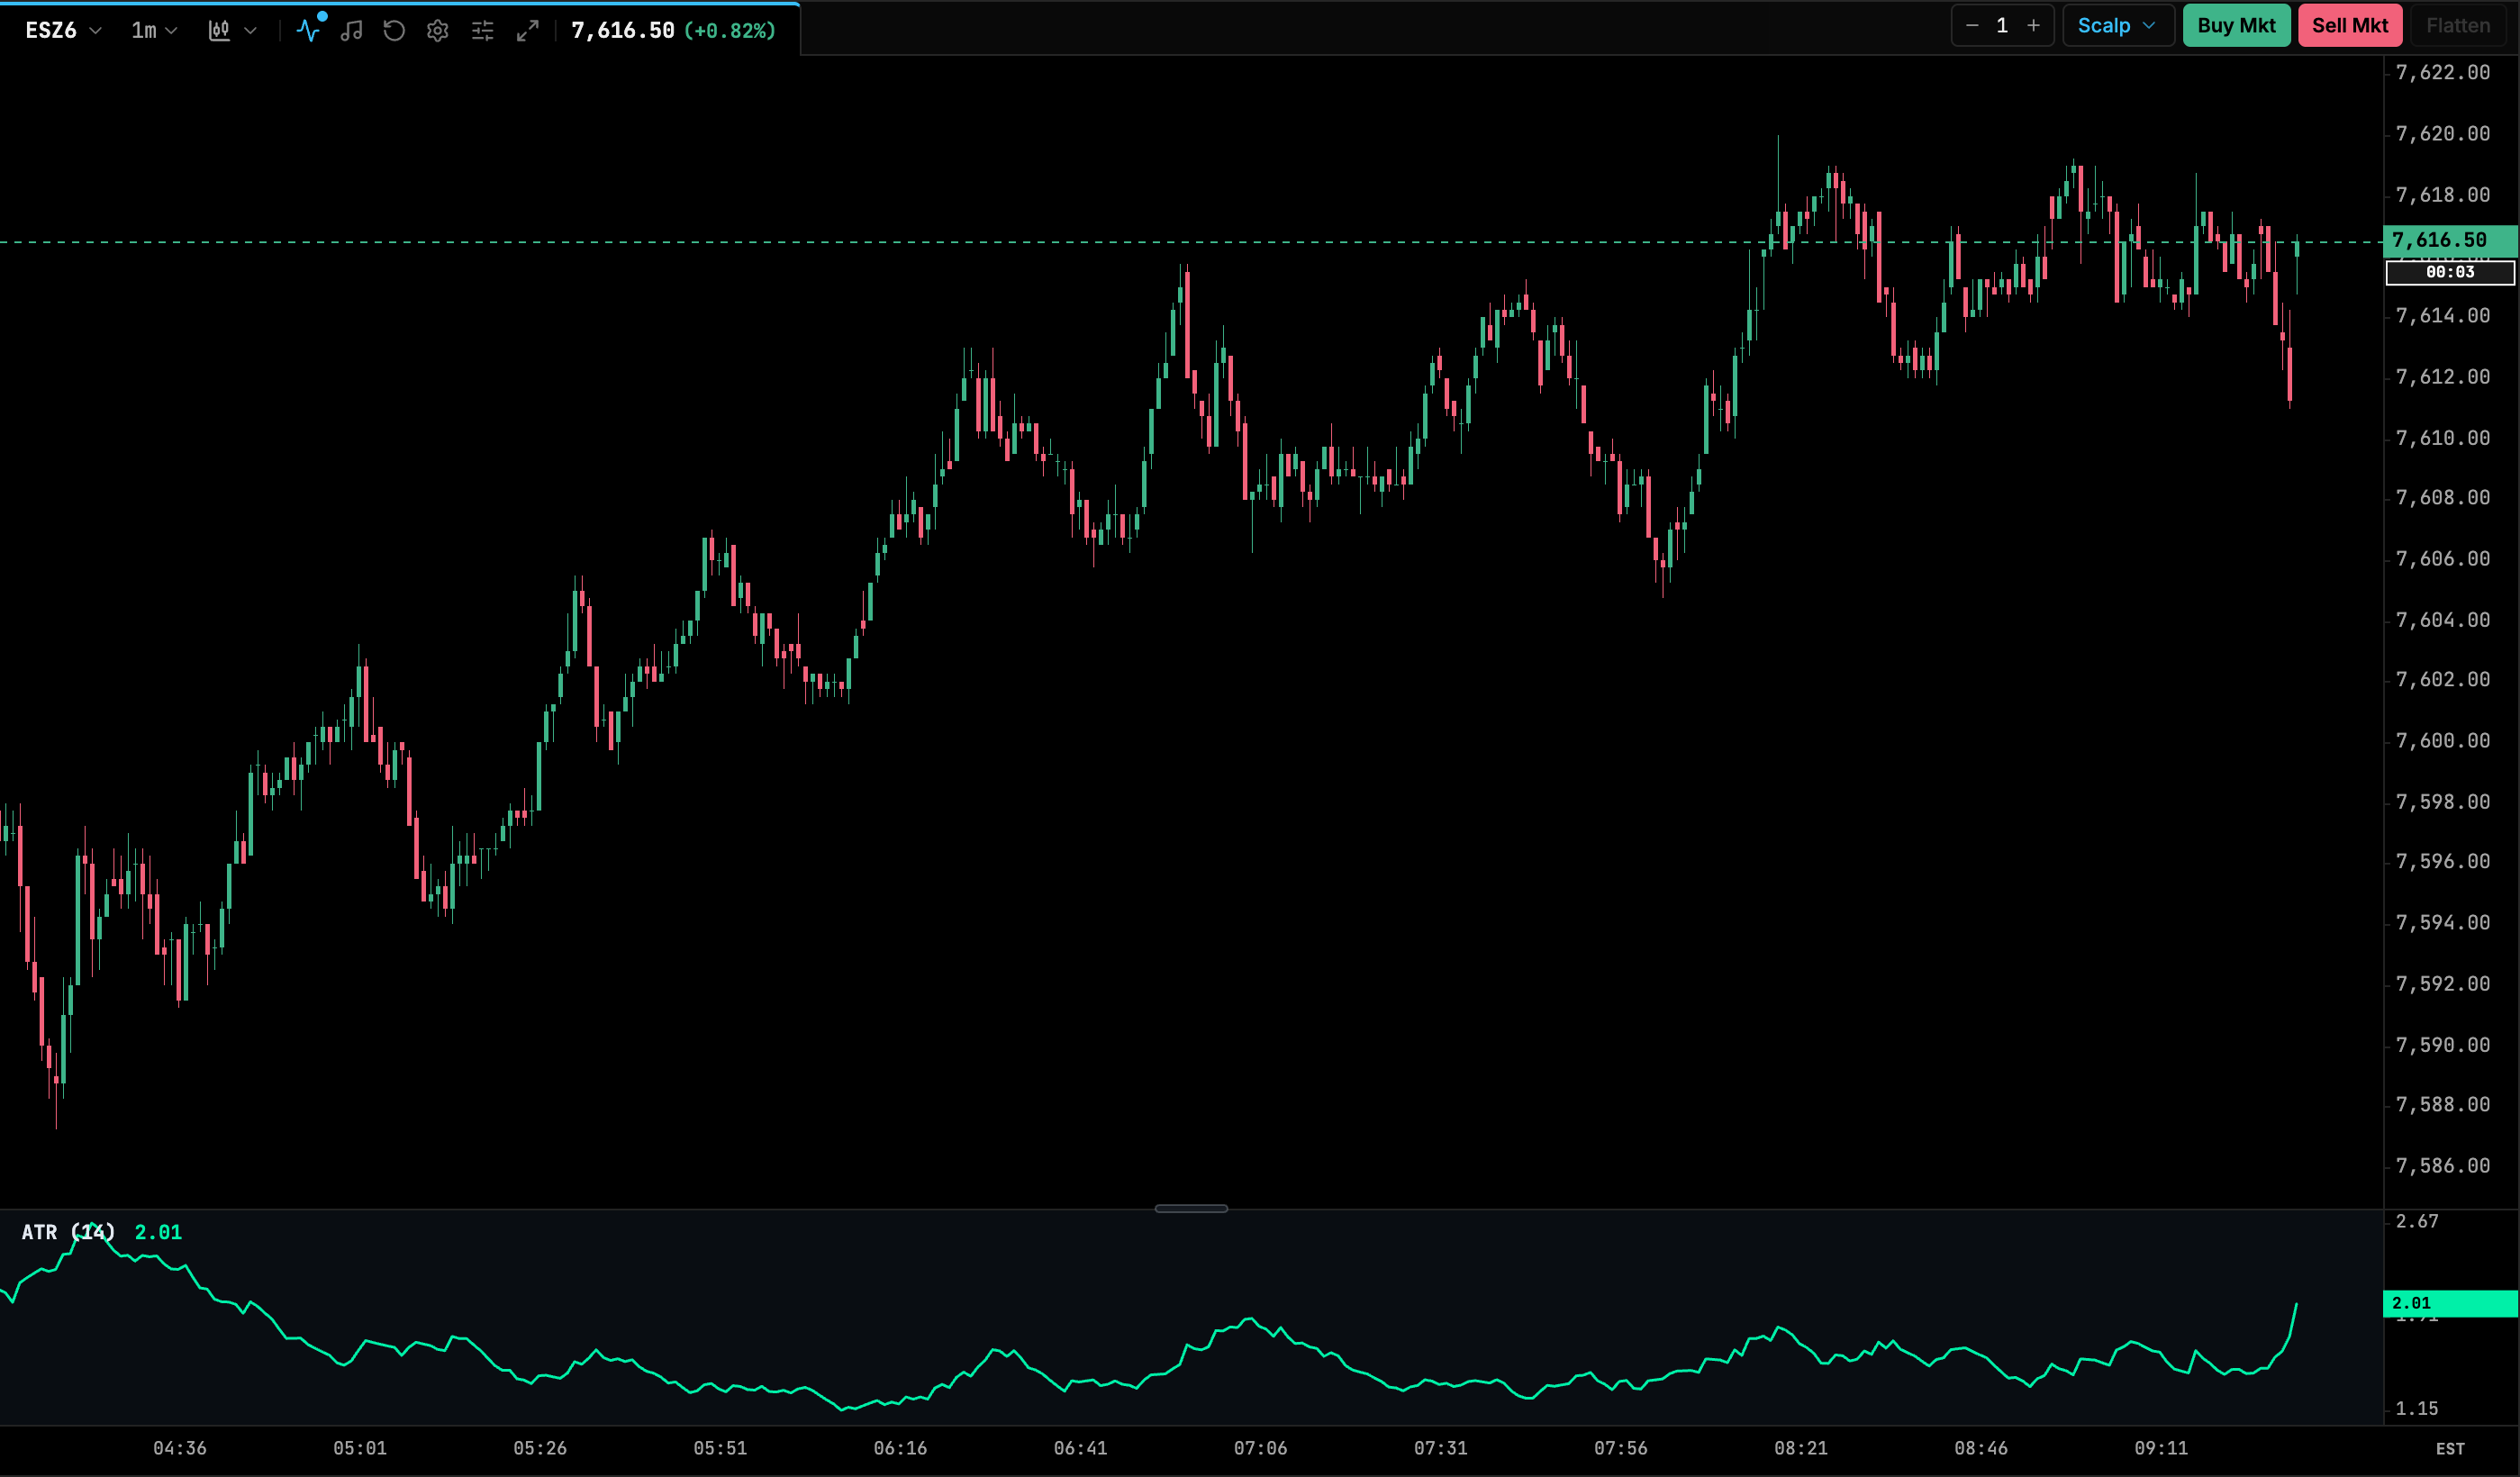
| Setting | Default | Range / options | Notes |
|---|---|---|---|
| Length / Period | 14 |
2–100 | |
| ATR Line Color | #00F0A8 |
color | |
| Line Thickness | 1.5 |
1–4 (step 0.5) |
Bollinger Bands
A simple moving average of the close (the basis, drawn dashed) with bands a set number of standard deviations above and below it. The bands widen as volatility expands and pinch together during quiet periods (the “squeeze”). The area between the bands is filled.
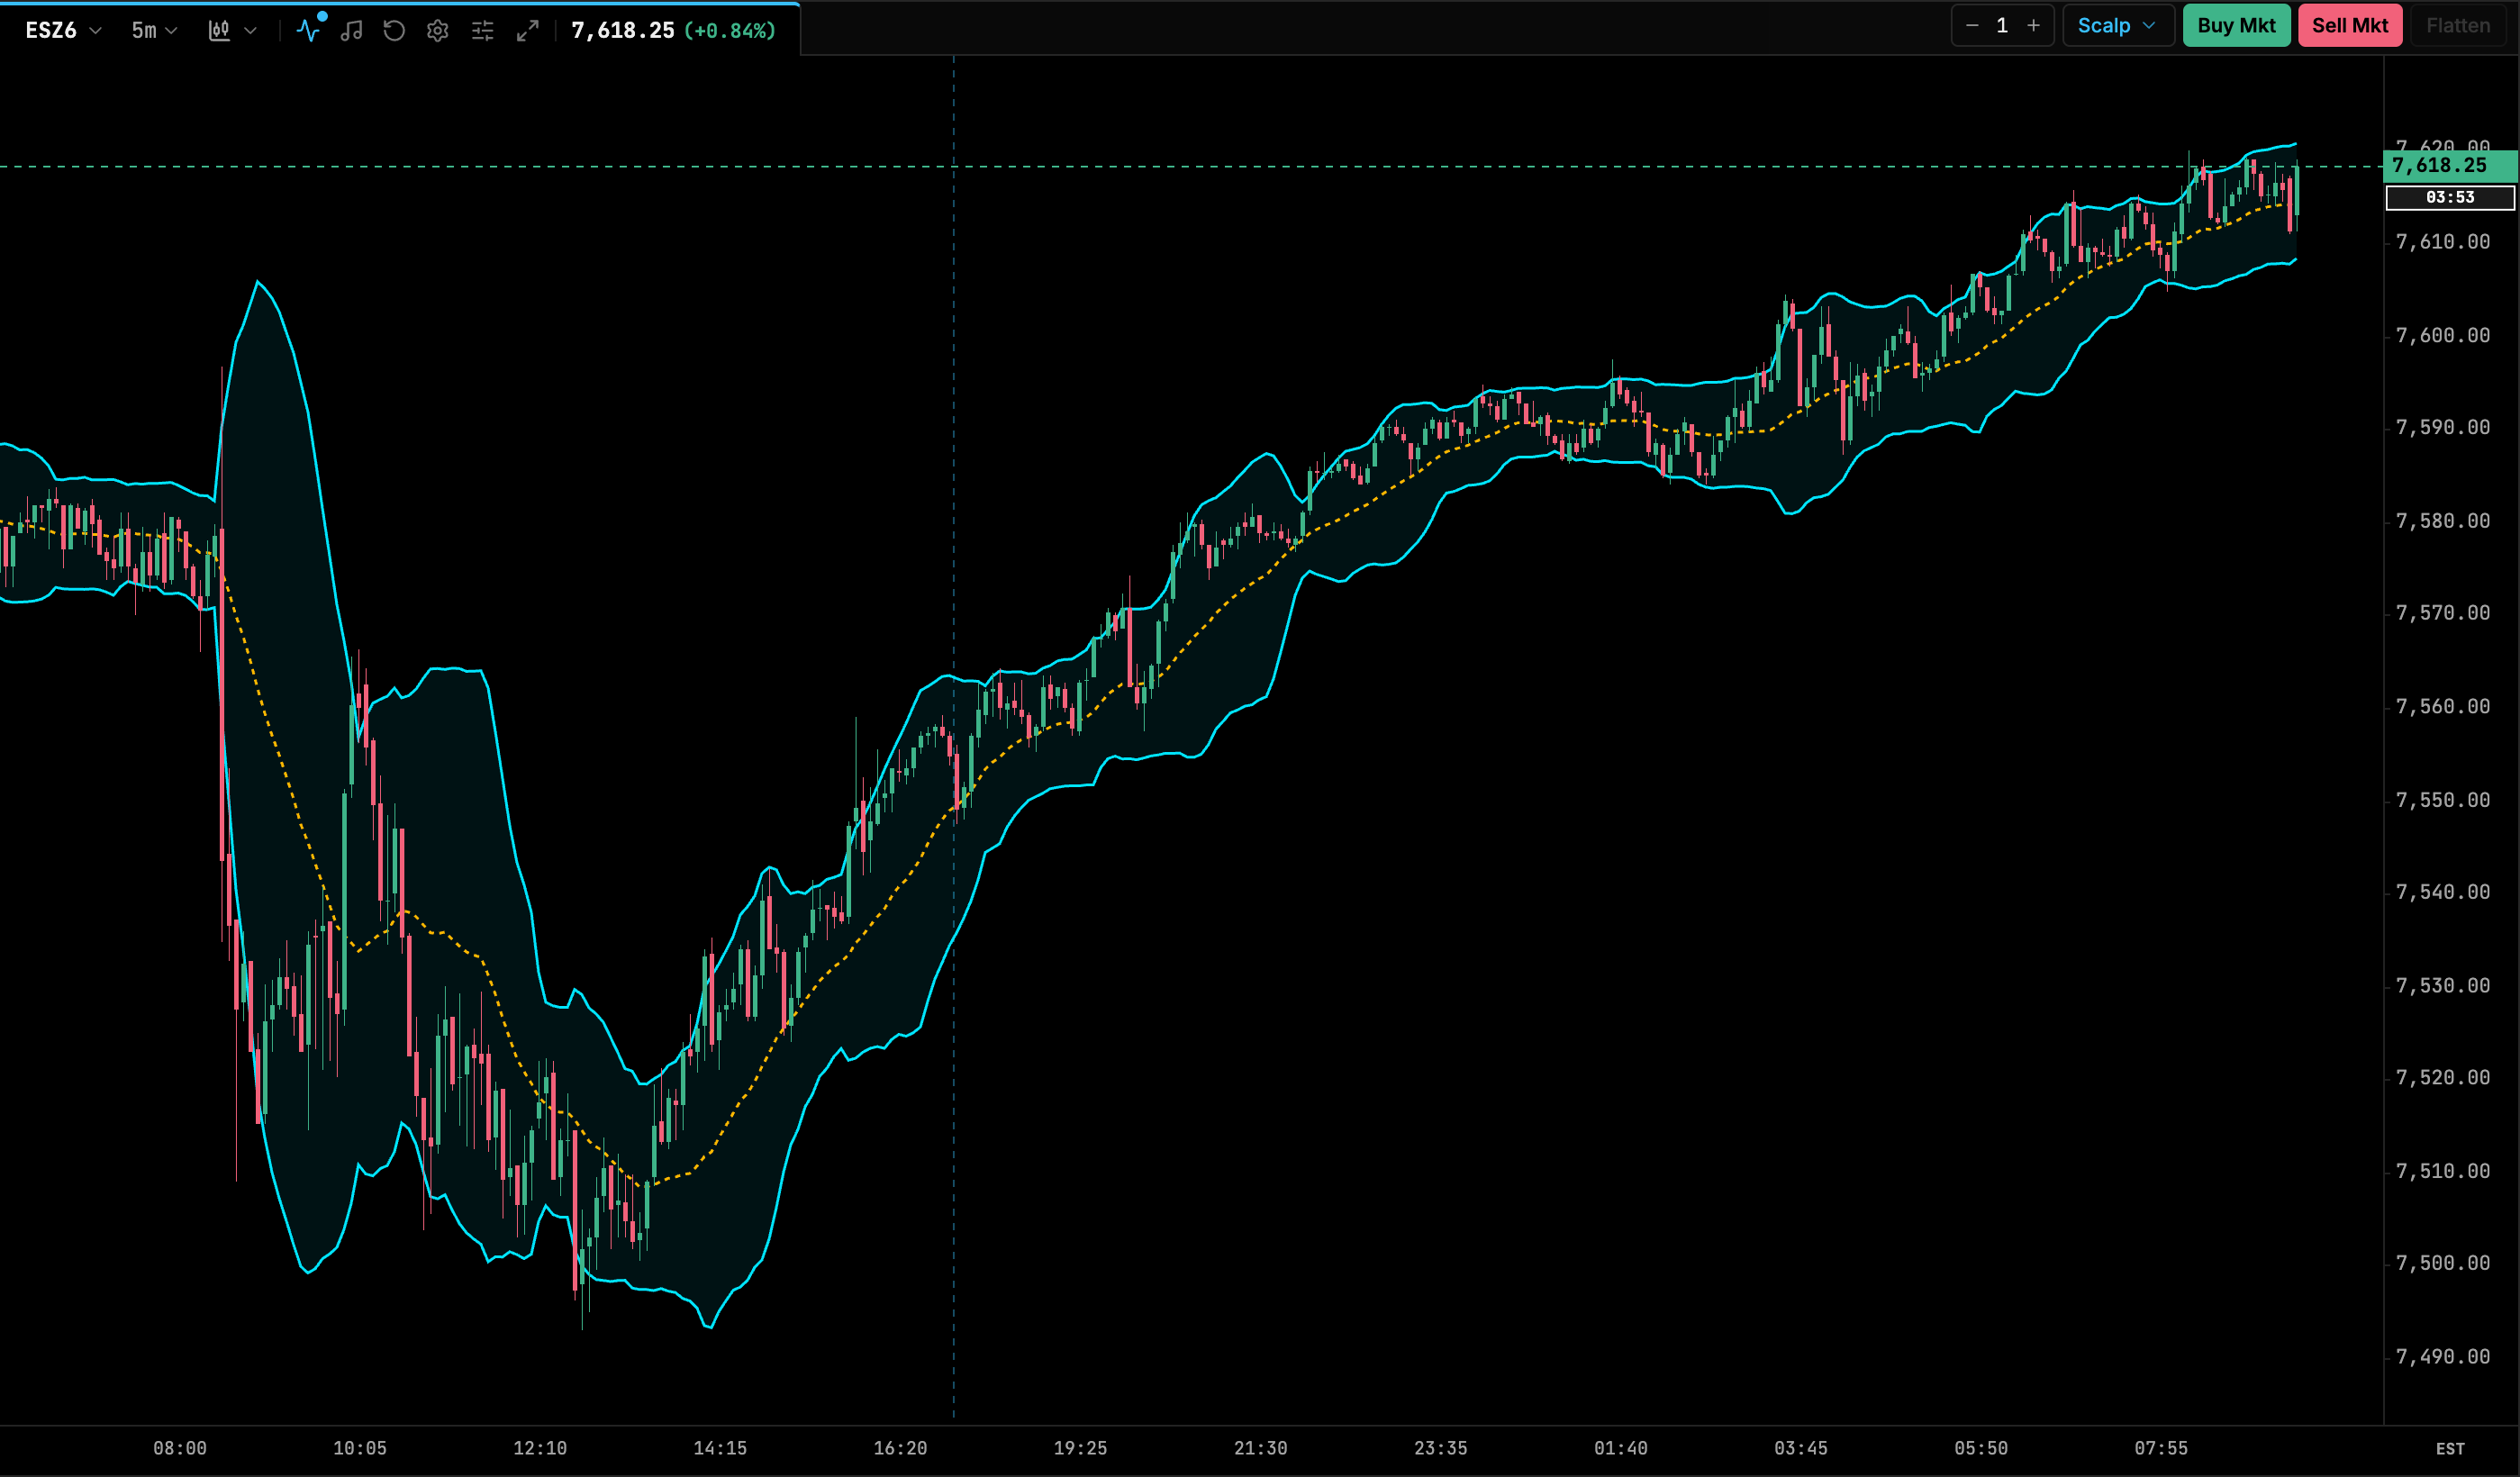
| Setting | Default | Range / options | Notes |
|---|---|---|---|
| Length / Period | 20 |
2–200 | SMA and standard-deviation lookback. |
| StdDev Multiplier | 2 |
0.5–5 (step 0.1) | Band distance from the basis. |
| Basis Line Color | #FFB800 |
color | |
| Bands Color | #00E5FF |
color | |
| Channel Cloud Fill | rgba(0, 229, 255, 0.08) |
color | Fill between the bands. |
| Line Thickness | 1.5 |
1–4 (step 0.5) |
Keltner Channels
An EMA of the close (drawn dashed) with bands set at a multiple of ATR above and below. Because the bands are based on ATR rather than standard deviation, they are smoother than Bollinger Bands. Bollinger Bands contracting inside the Keltner Channels is a common squeeze signal.
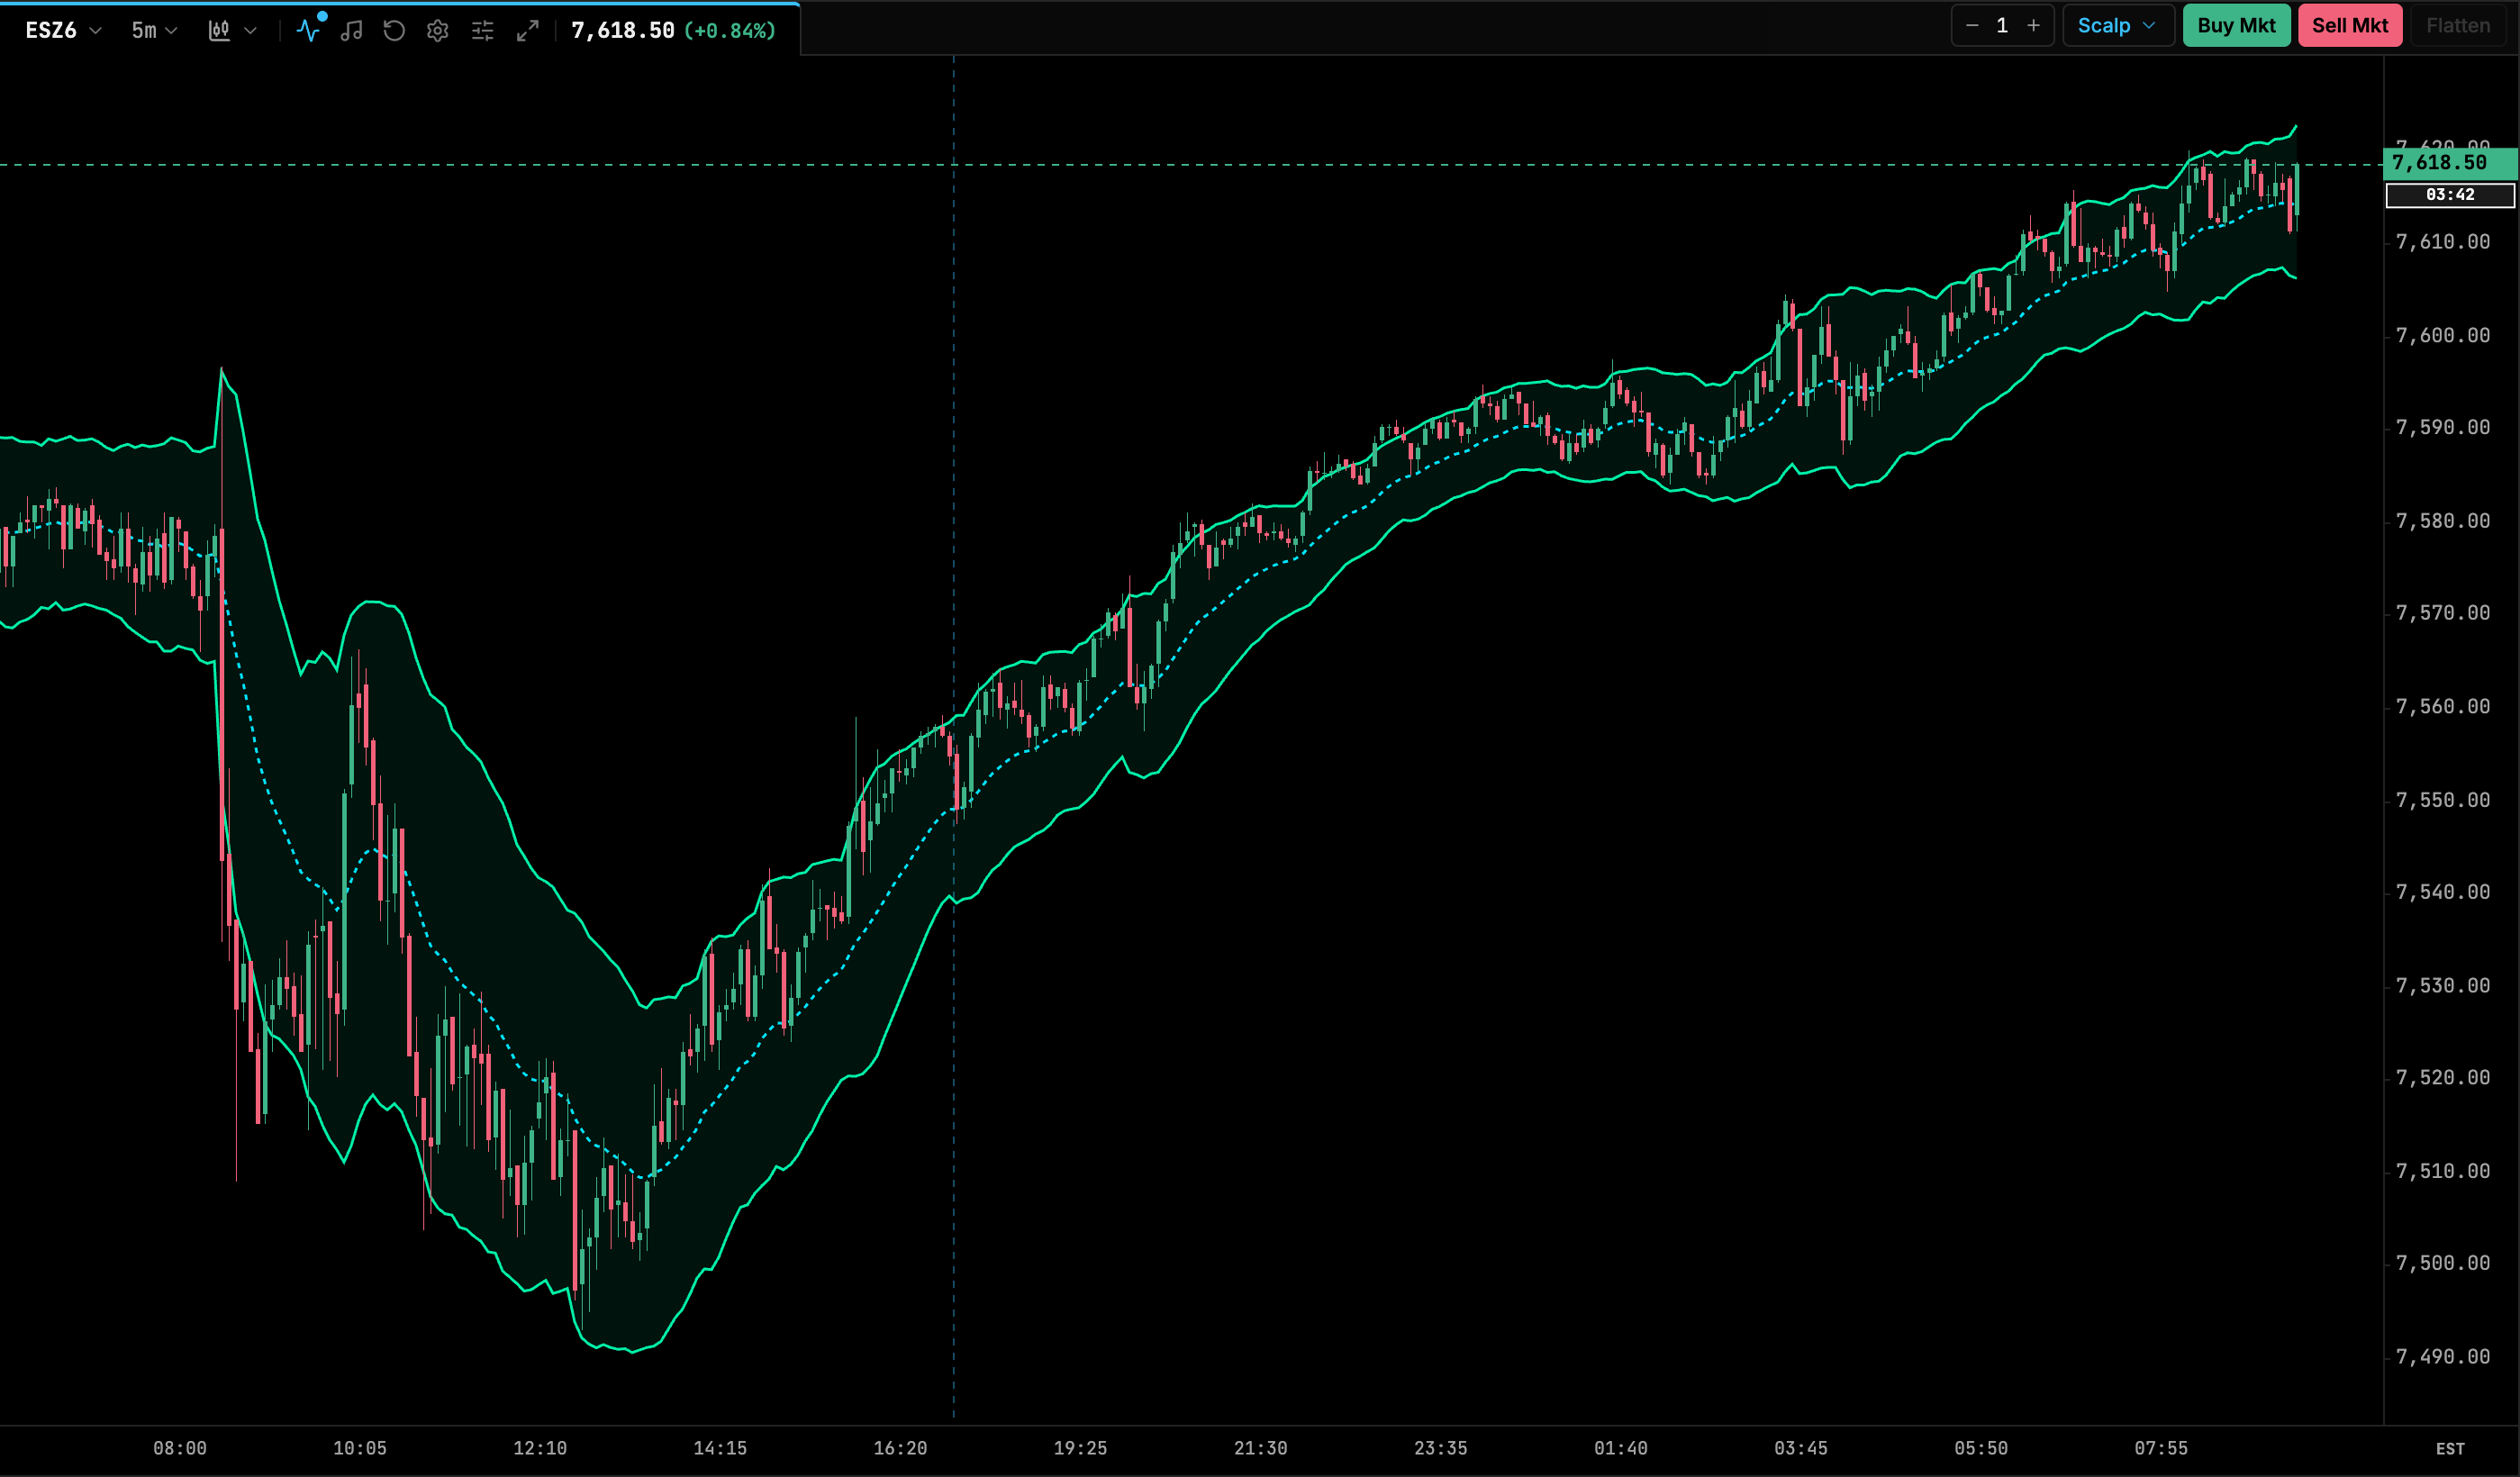
| Setting | Default | Range / options | Notes |
|---|---|---|---|
| EMA Period | 20 |
2–200 | Center line length. |
| ATR Period | 10 |
1–100 | |
| ATR Multiplier | 2 |
0.5–5 (step 0.1) | Band distance from the center. |
| Center EMA Color | #00E5FF |
color | |
| Bands Color | #00F0A8 |
color | |
| Channel Cloud Fill | rgba(0, 240, 168, 0.08) |
color | |
| Line Thickness | 1.5 |
1–4 (step 0.5) |
Donchian Channels
The upper band is the highest high of the last N bars and the lower band is the lowest low. The dashed median sits halfway between them. A close through a band marks an N-bar breakout, the basis of classic turtle-style breakout systems.
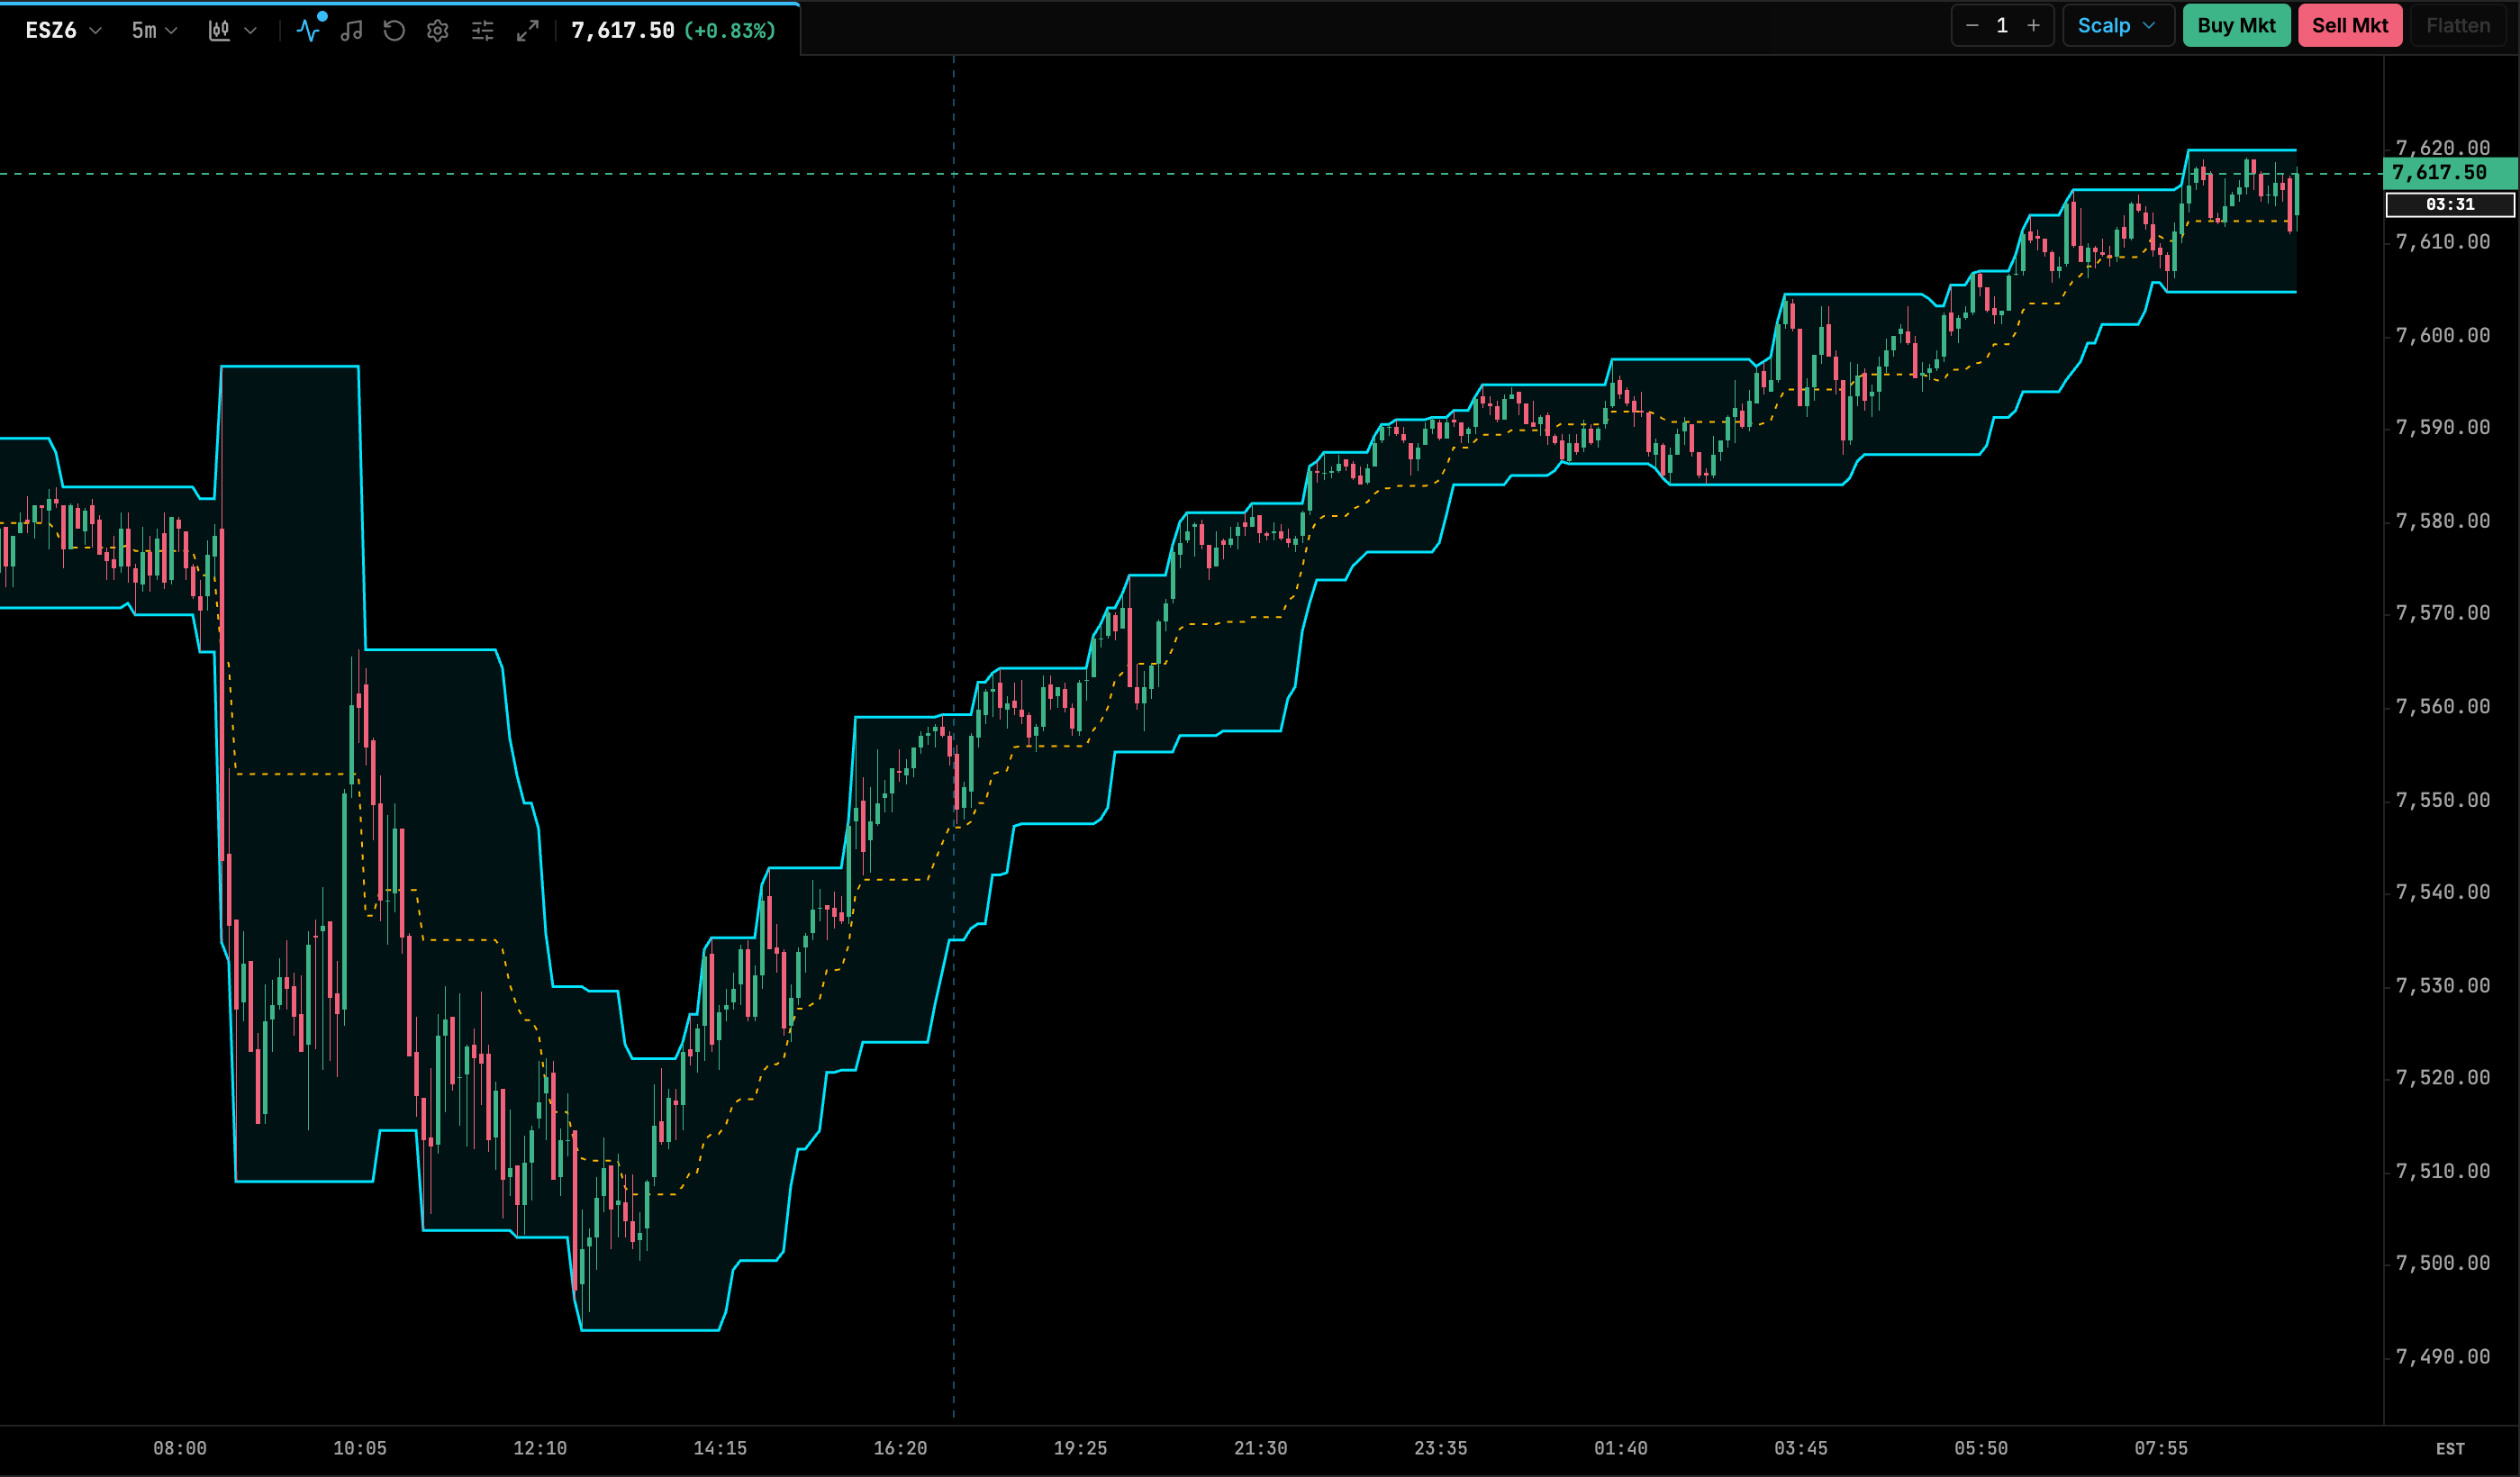
| Setting | Default | Range / options | Notes |
|---|---|---|---|
| Length / Period | 20 |
2–200 | Lookback for the highest high and lowest low. |
| Median Basis Line Color | #FFB800 |
color | |
| Bands Color | #00E5FF |
color | |
| Channel Cloud Fill | rgba(0, 229, 255, 0.08) |
color | |
| Line Thickness | 1.5 |
1–4 (step 0.5) |