Market Depth (L2)
These indicators draw resting limit orders (the order book) rather than trades. To add one, open Indicators in the chart panel header and search by name. See Indicators overview.
Data requirements
- Level 2 depth from a live connection. The book comes from your Rithmic connection through the local gateway. With no depth feed, these indicators have nothing to draw.
- History starts when you subscribe. The heatmap and LiveDOM keep the book history recorded while the app is running. They can’t show depth from before that.
- Not available in Market Replay. Replay plays back trades only, with no order book, so all five indicators on this page are skipped during Market Replay. While replay is active, the Indicators modal marks them No depth in Replay, and the replay transport bar lists any that are enabled. They draw again when you leave replay.
Liquidity Heatmap
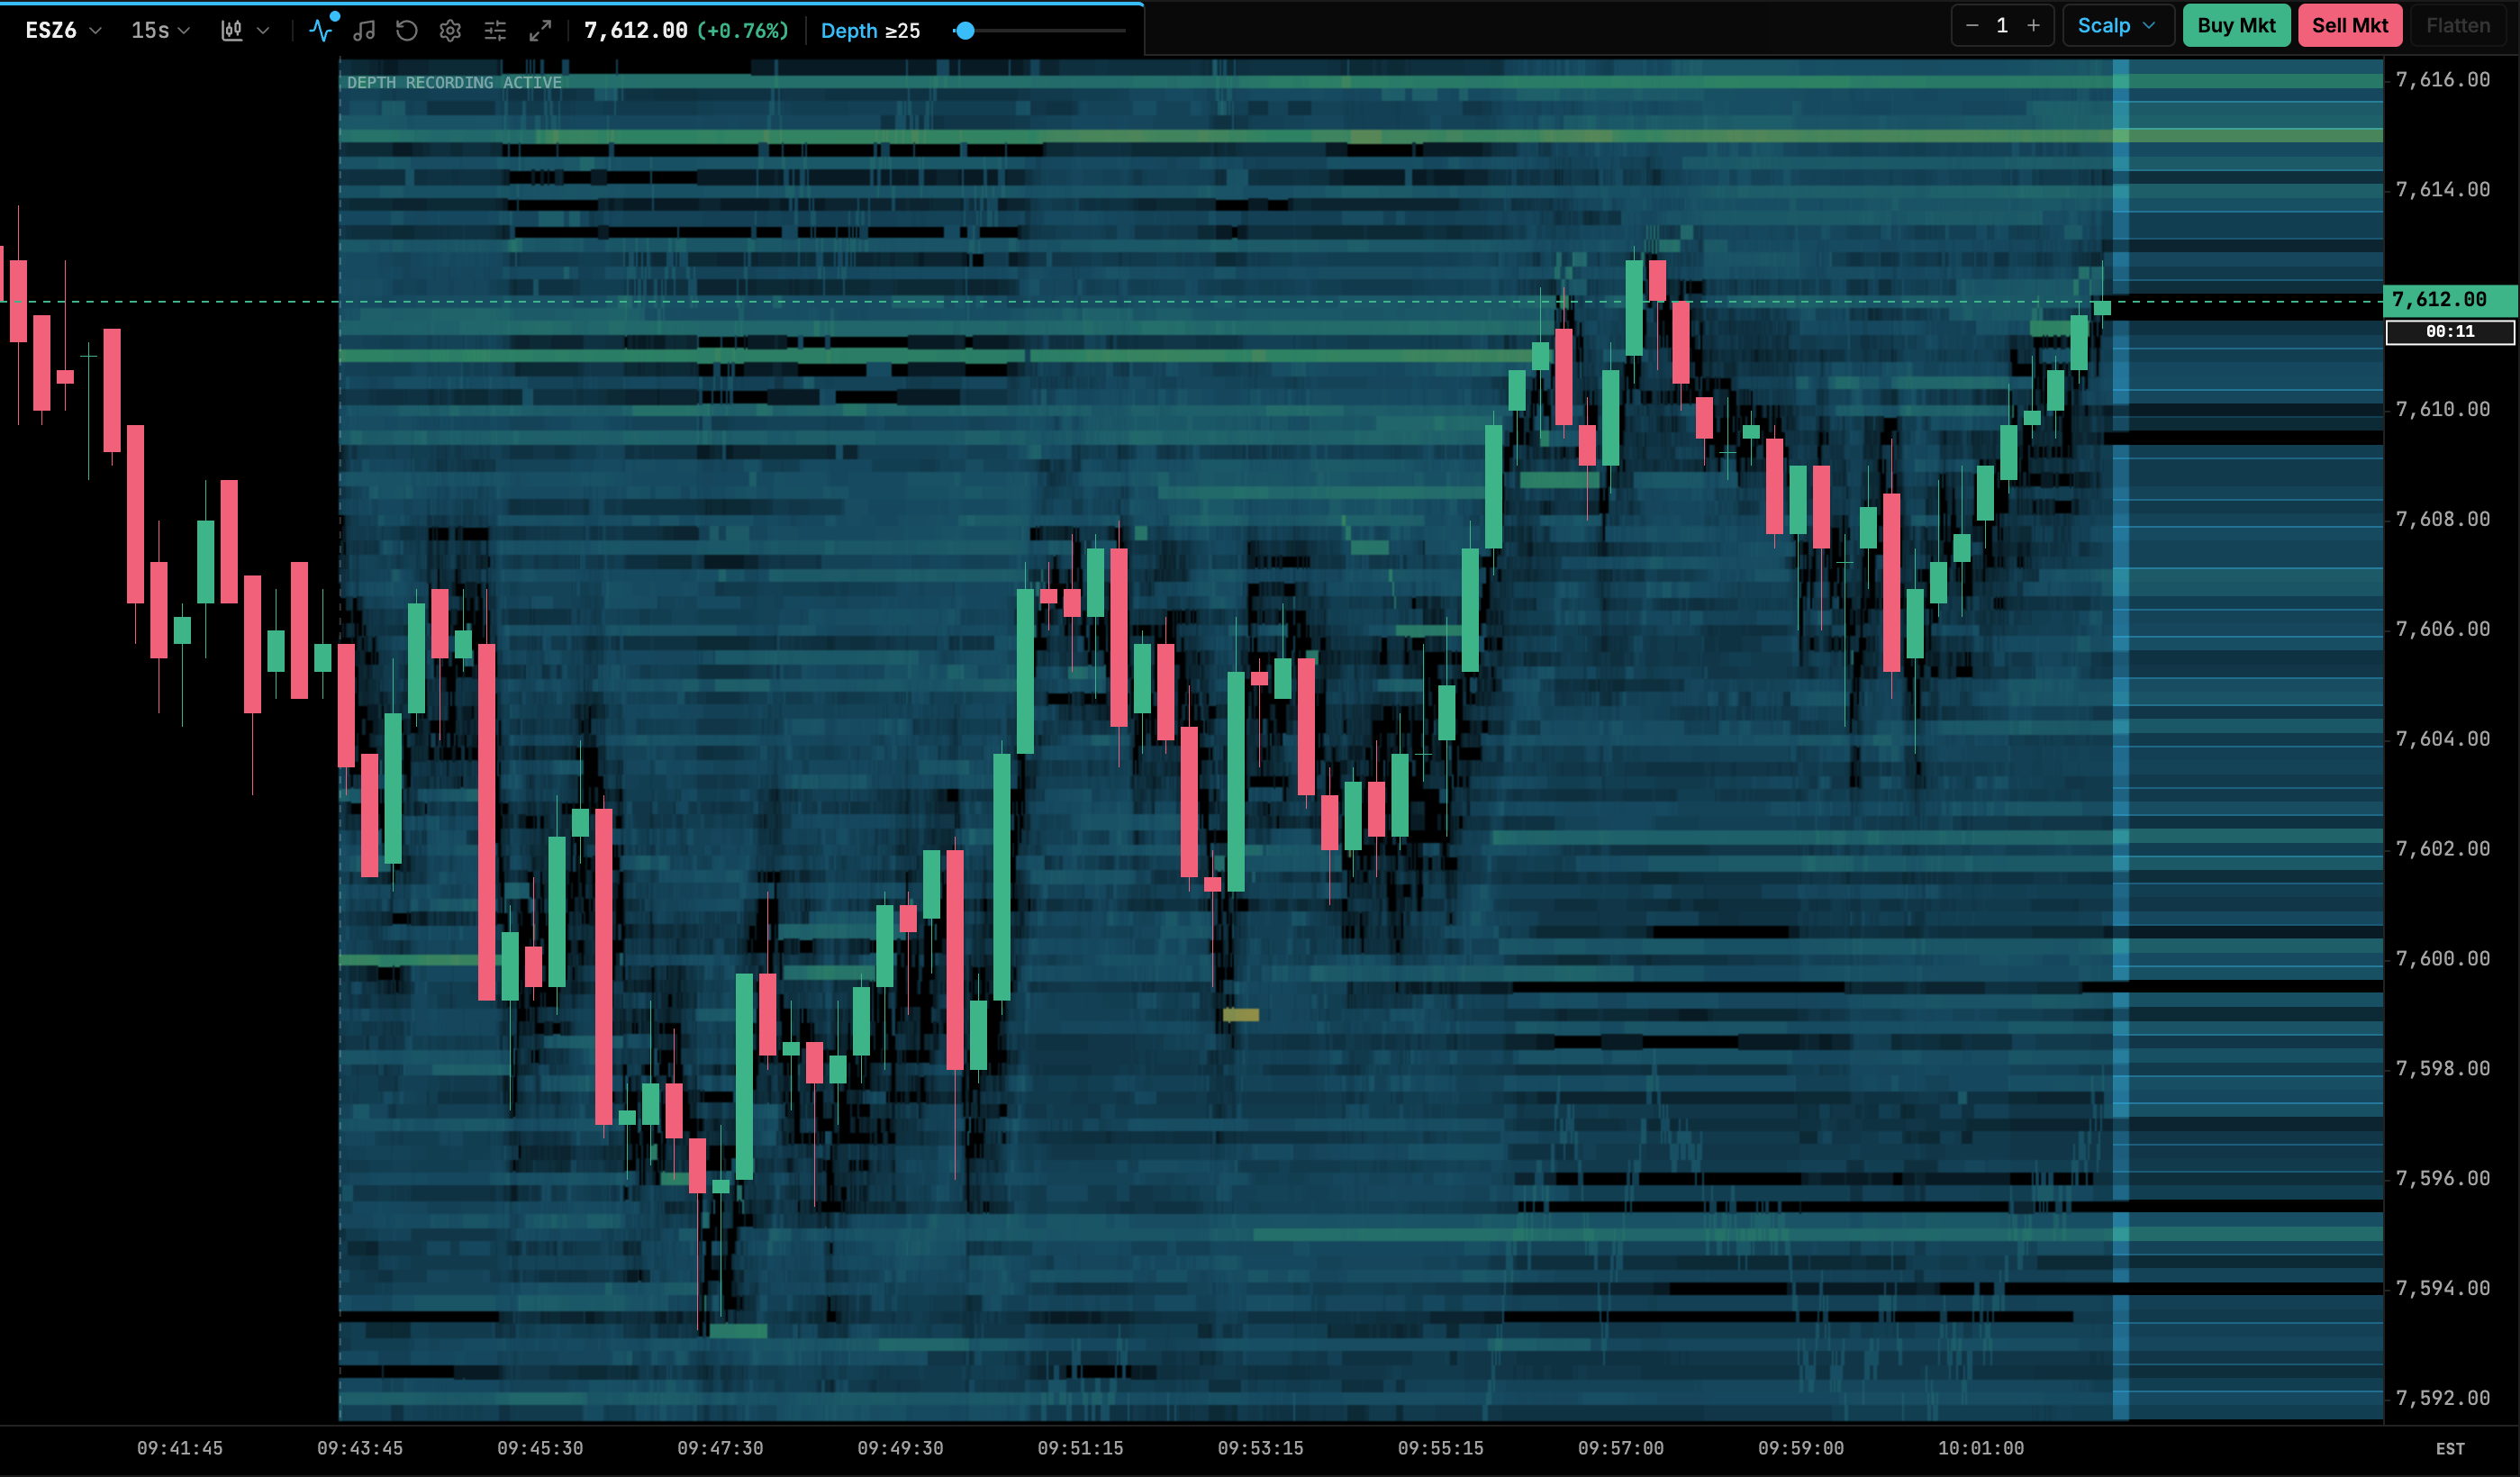
A heatmap of resting order size at every price over time, drawn across the chart. Brighter cells mean more resting size. Horizontal bands show liquidity walls, and bands that end suddenly show liquidity being pulled. With Project Real-Time Depth on, the current book is also drawn in the right margin. Layouts saved with the old id heatmap load this indicator.
When a heatmap is on the panel, a Depth slider appears in the panel header. Drag it to set Min Volume Cutoff without opening settings. The far-left position shows ALL, which is 0. The maximum adjusts to the largest size seen.
| Setting | Default | Range / options | Notes |
|---|---|---|---|
| Min Volume Cutoff | 25 | 0–2000 (step 5) | Sizes below this are not drawn. Also set by the header Depth slider. |
| Contrast Multiplier | 2.2 | 1–5 | Higher values make mid-sized levels stand out more. |
| Heatmap Opacity | 0.85 | 0.1–1 | |
| Color Palette | Theme Adaptive (Recommended) | Theme Adaptive, Thermal / Inferno, Cyber Neon, Monochrome | |
| Project Real-Time Depth | on | on/off | Draws the current book in the right margin. |
Market Depth
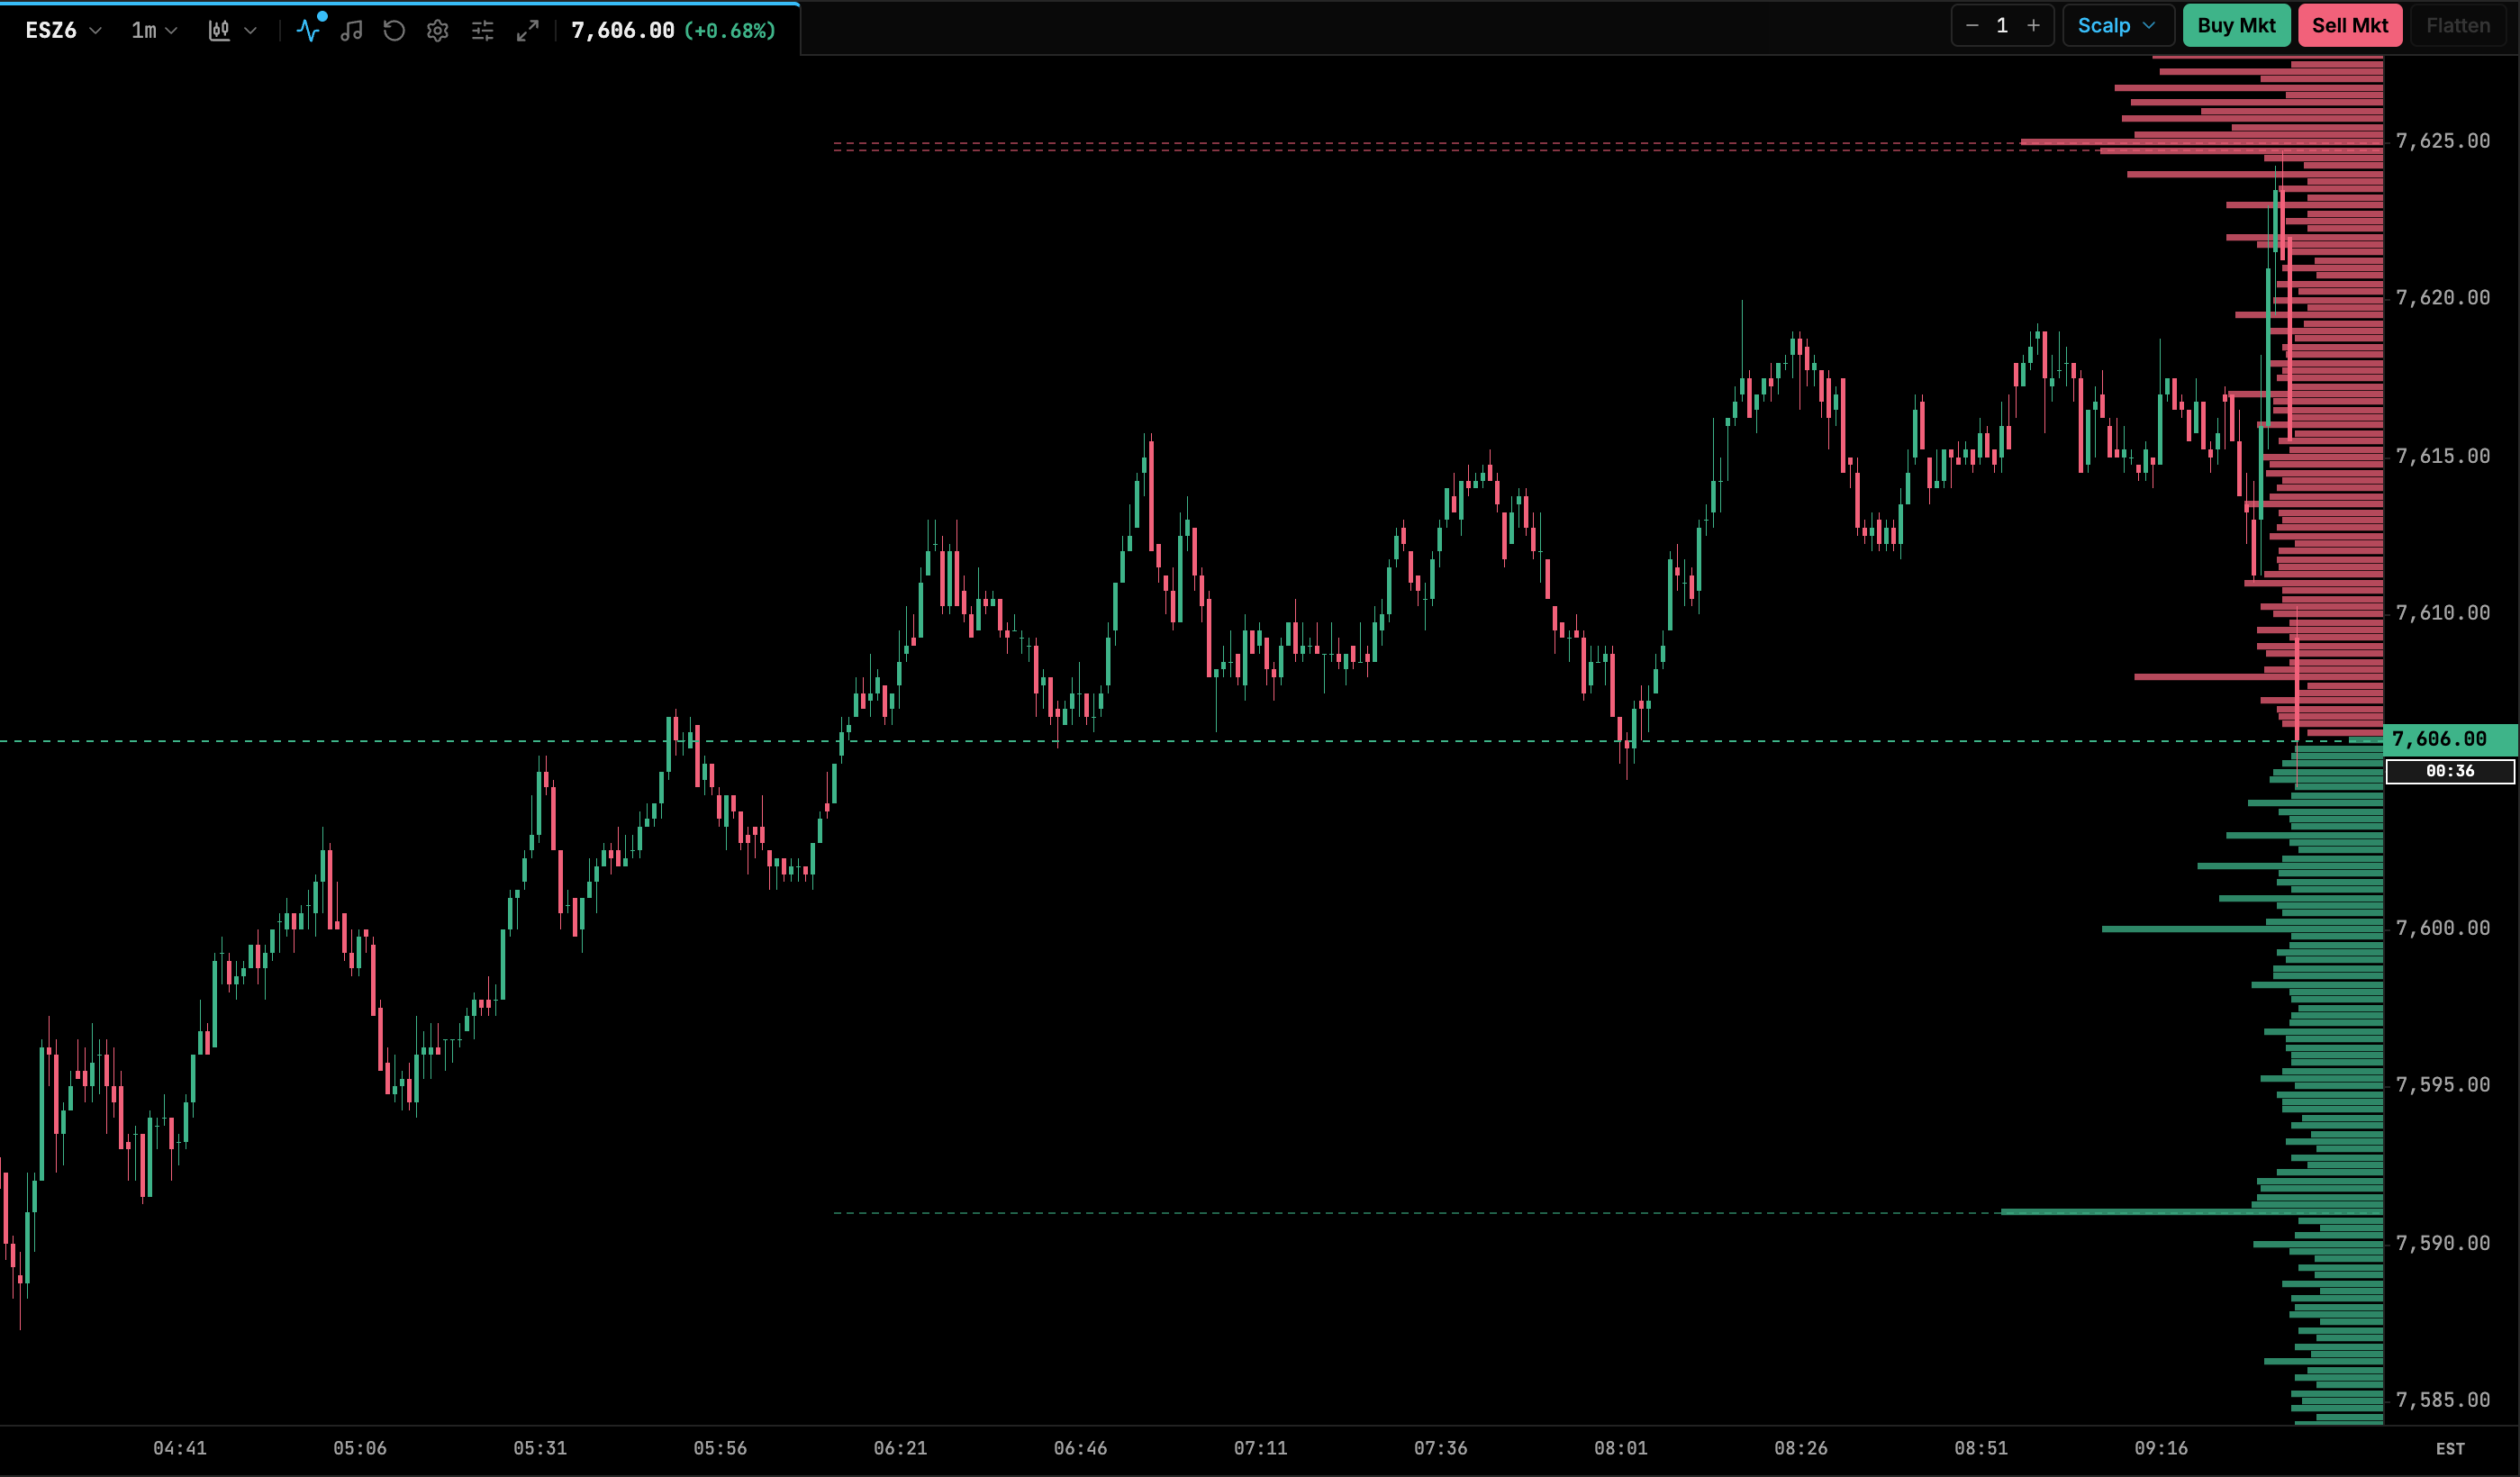
Horizontal depth bars for the current book at the right of the chart: bids below price and asks above. Any level larger than Wall Multiplier × average depth is treated as a wall, and a ray is drawn from the right edge out to the left across the chart.
| Setting | Default | Range / options | Notes |
|---|---|---|---|
| Max Width Ratio | 0.16 | 0.05–0.35 | Widest bar as a fraction of chart width. |
| Show Liquidity Rays | on | on/off | |
| Wall Multiplier Threshold | 2.5 | 1.5–5 | |
| Ray Projection Span | 0.65 | 0.2–1 | Ray length (leftward from the right edge) as a fraction of chart width. |
| Bid / Ask Depth Color (Optional) | empty (theme) | color |
LiveDOM
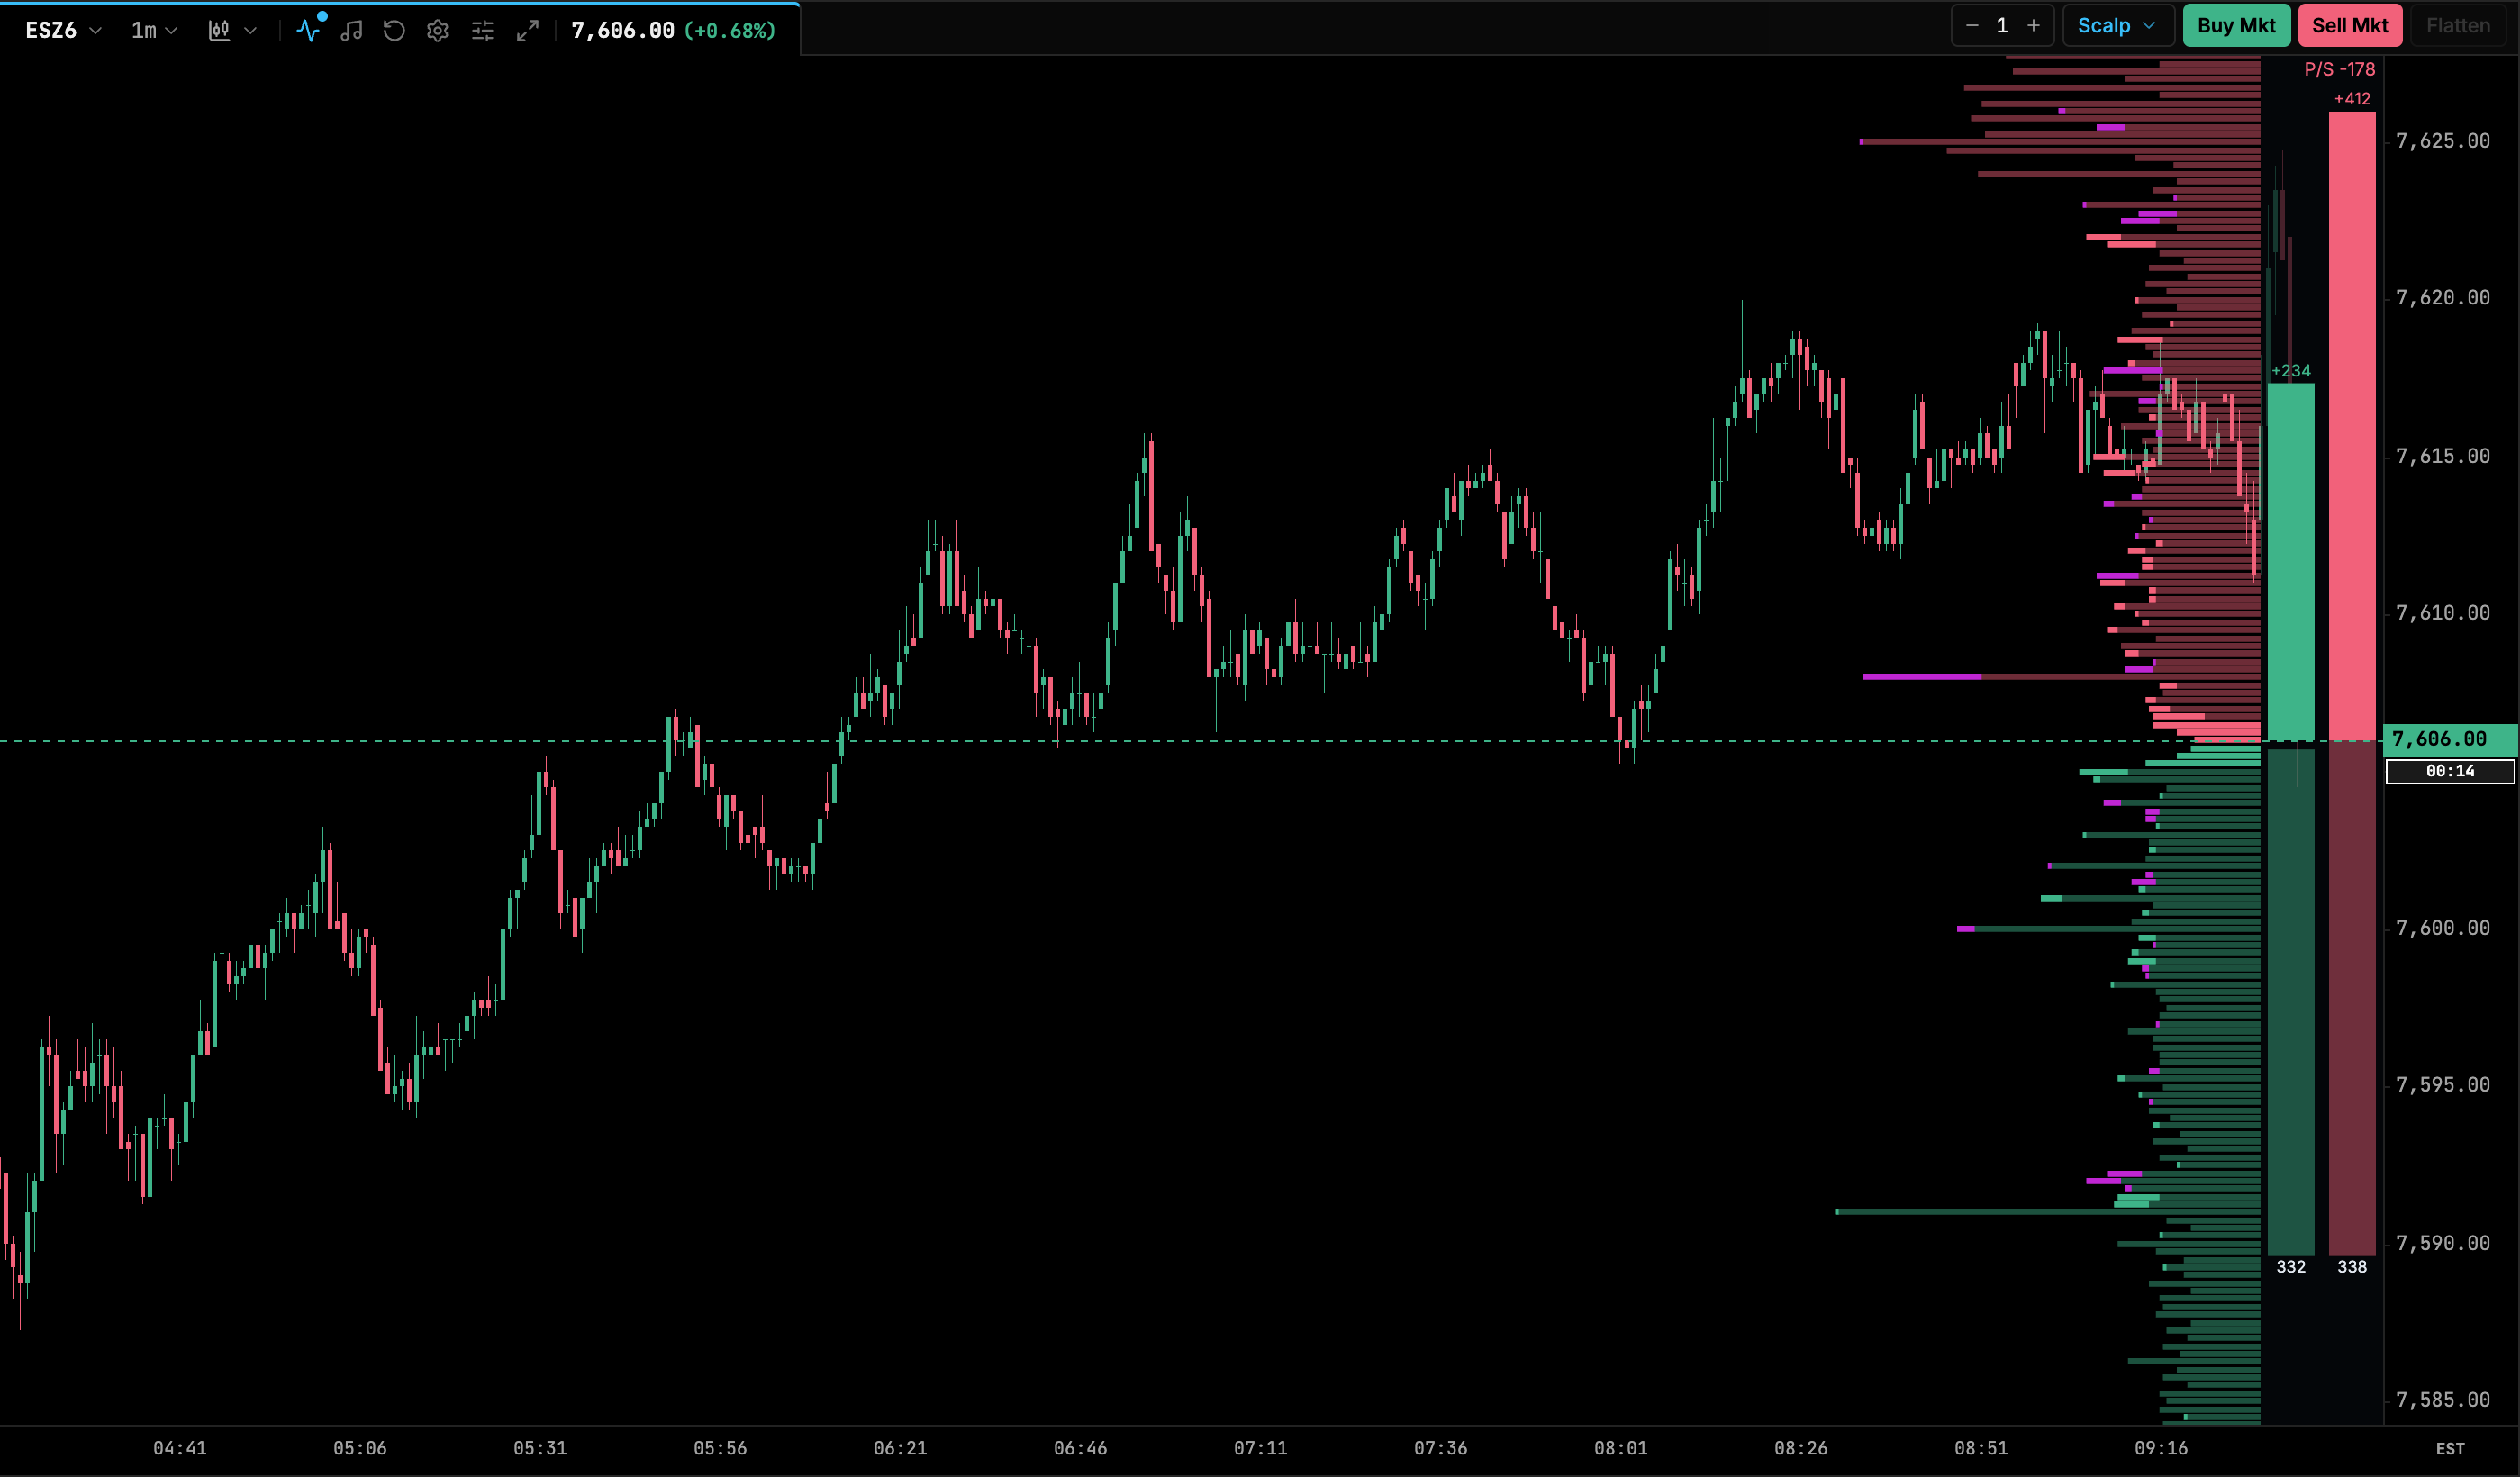
A live order book drawn at the right edge, with pulling and stacking. Each price shows its resting size. On top of that, liquidity added since the last reset point is drawn solid (stacking) and liquidity removed is drawn as a hollow purple outline (pulling). Two columns on the far right show Buyers | Sellers totals for the top levels, with a P/S (pulling/stacking) pressure readout.
LiveDOM prefers the gateway’s depth-flow stream from Rithmic. If no depth-flow data arrives within about 2 seconds, it works out changes by comparing successive book snapshots instead. It keeps about 16 minutes of history in 250 ms buckets.
| Setting | Default | Range / options | Notes |
|---|---|---|---|
| Width Ratio | 0.18 | 0.05–0.5 | Fraction of chart width. |
| Scale | Visible max | Visible max, Fixed size, Square root | |
| Fixed Max Size | 200 | 1–100000 | Used when Scale = Fixed size. |
| Show Added (Stacking) | on | on/off | |
| Show Removed (Pulling) | on | on/off | |
| Show Max Volume | off | on/off | |
| Reset | Every N bars | Every N bars, Rolling N seconds, Session | When the pulling/stacking counts restart. |
| Reset Bars | 1 | 1–500 | |
| Reset Seconds | 30 | 1–900 | |
| Min Size Filter | 0 | 0–10000 | |
| Totals | Buyers | Sellers | Buyers | Sellers, Off | |
| Totals Levels | 10 | 1–50 | Number of levels summed on each side. |
| Show P/S Pressure | on | on/off | |
| Show Size Labels | on | on/off | |
| Bid / Ask Color (Optional) | empty (theme) | color | |
| Removed Outline (Optional) | empty (theme) | color |
Pulling & Stacking Delta
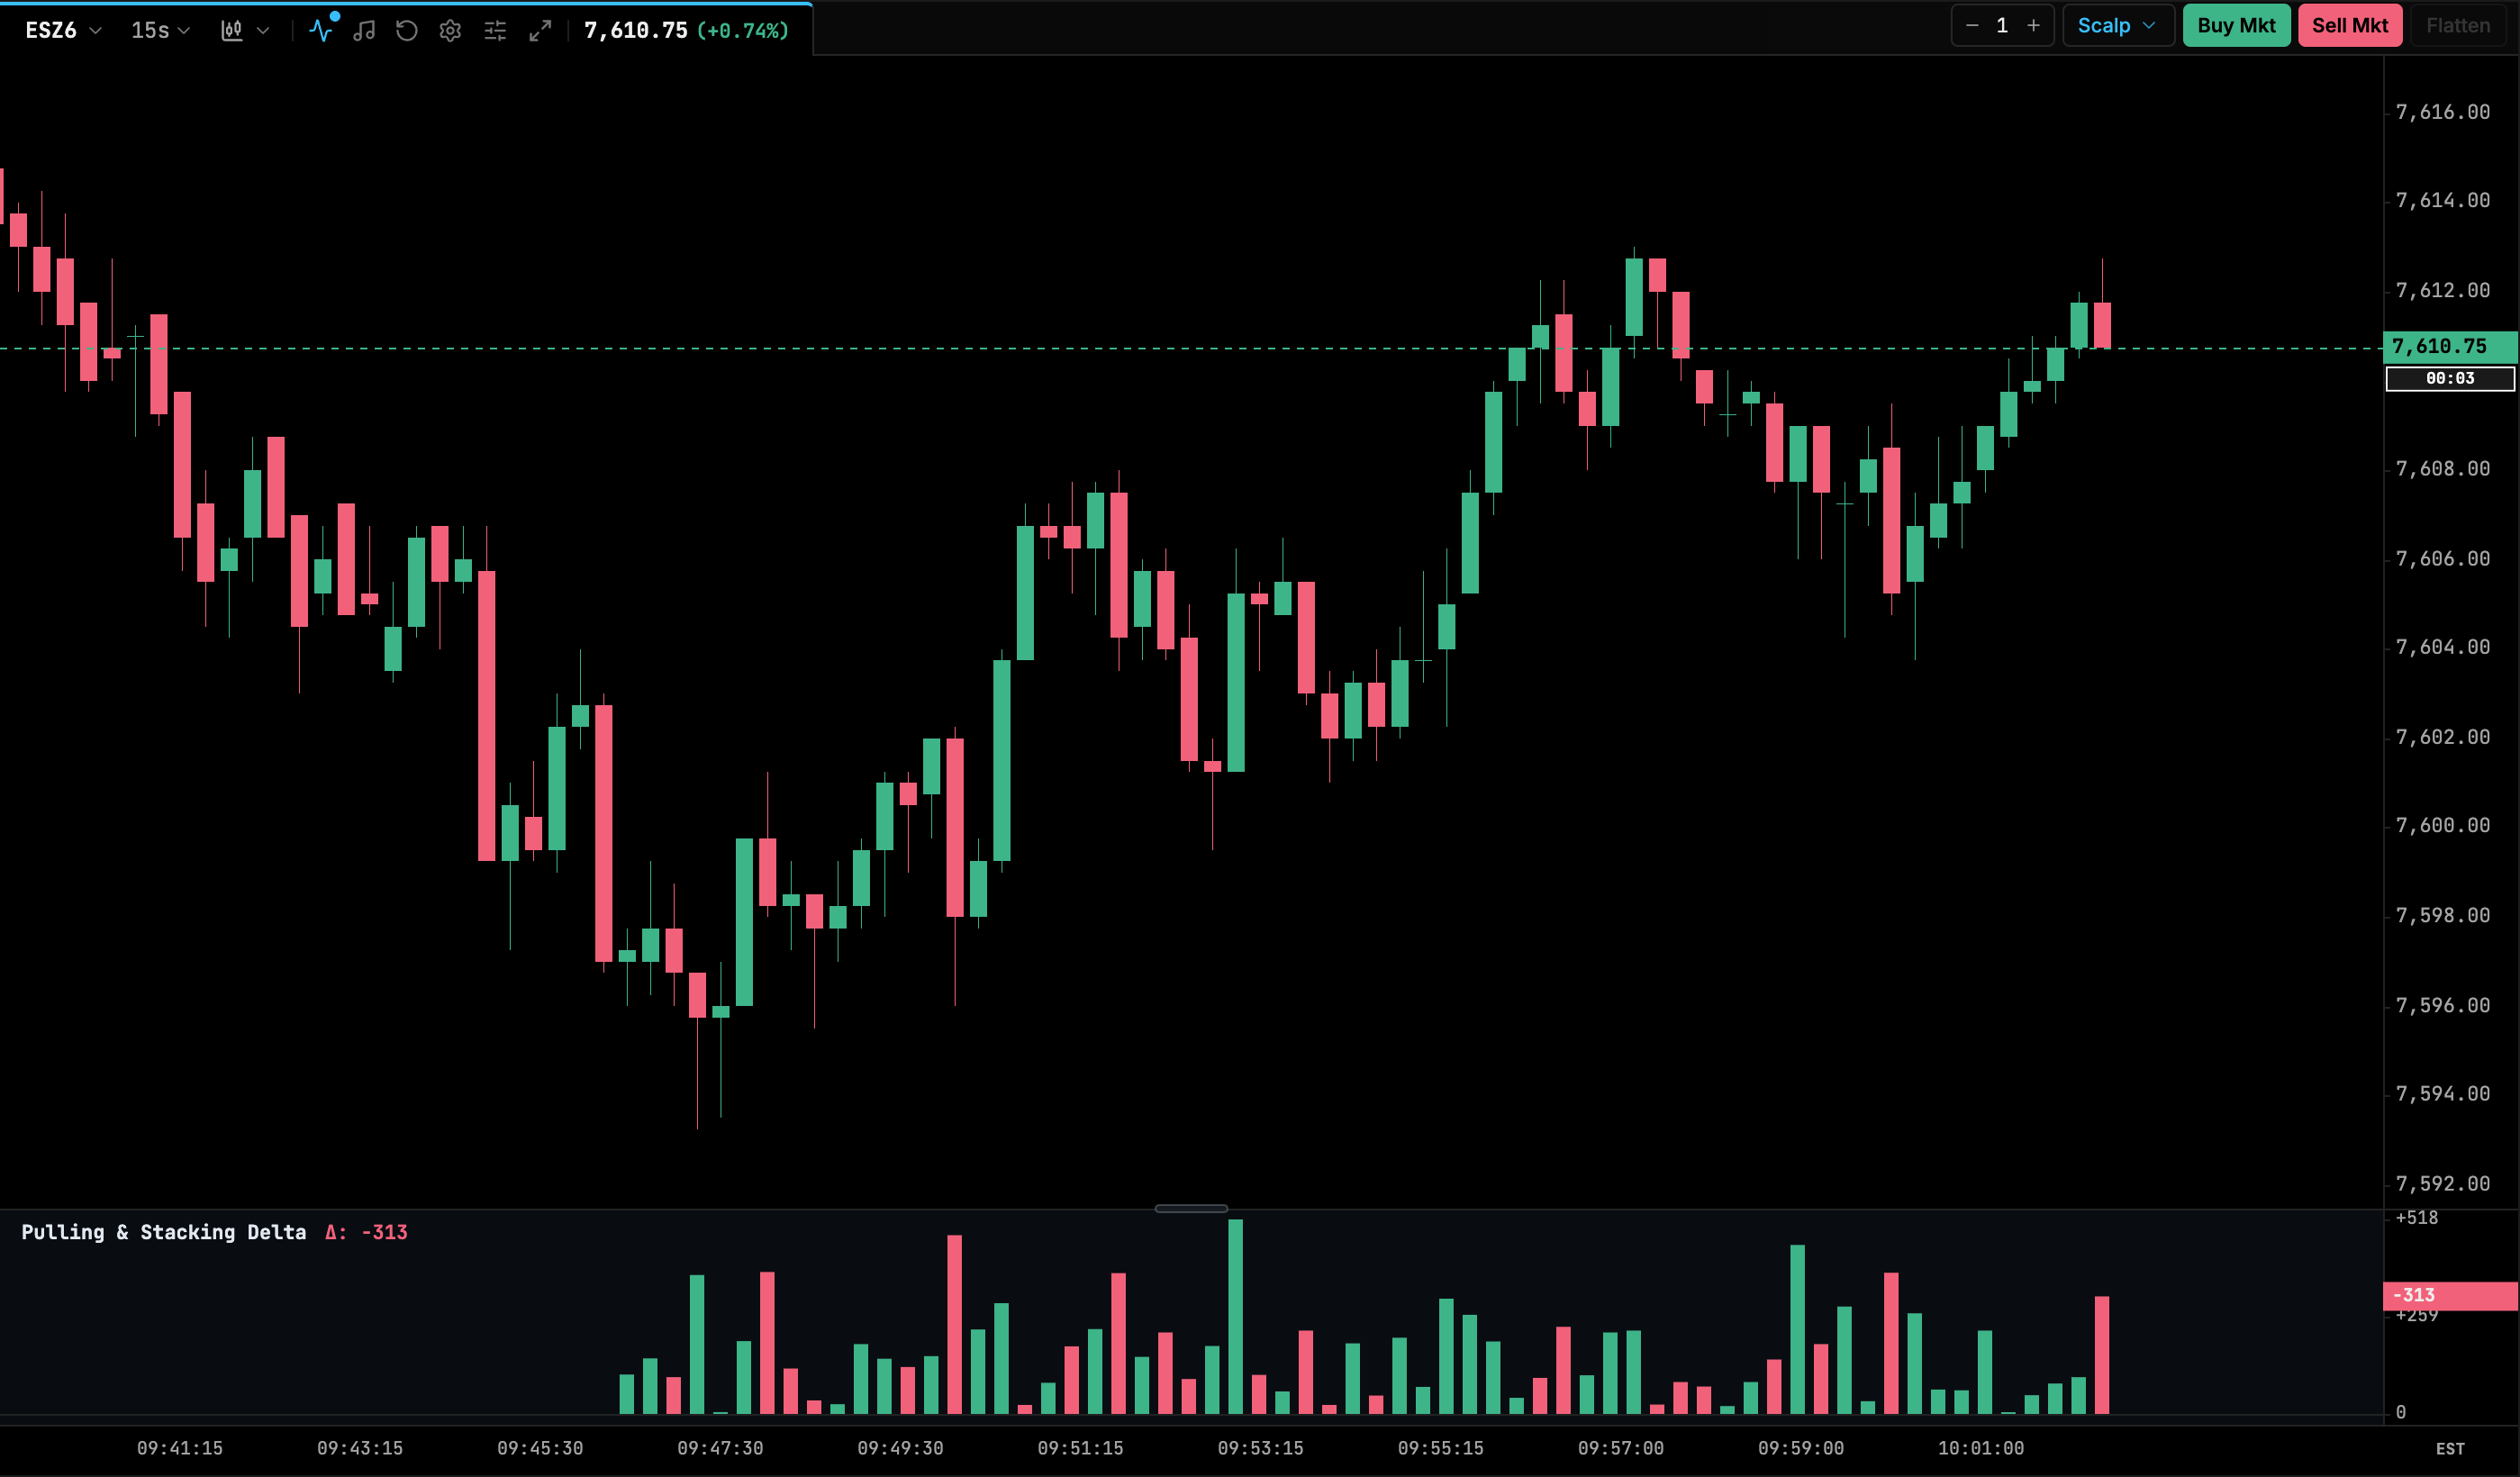
The LiveDOM pulling/stacking flow as a sub-pane with one value per bar:
(bid stacked − bid pulled) − (ask stacked − ask pulled)
Positive values mean bids are building or asks are being pulled (supportive). Negative values mean the reverse. Split draws the buyers’ net and sellers’ net separately. It uses the same live depth flow as LiveDOM.
| Setting | Default | Range / options | Notes |
|---|---|---|---|
| Display | Net delta | Net delta, Split (buyers net | sellers net) | |
| Show Baseline | on | on/off | |
| Bullish / Bearish Color (Optional) | empty (theme) | color |
Order Book Imbalance
The skew between resting bid size and resting ask size across the top N price levels, normalized to the range 0 to 1. Distance Decay (λ) can weight levels near the inside market more heavily. The output is smoothed, and threshold zones mark strong imbalance. A threshold of 0.5 is roughly 3:1. An optional signal EMA helps show turns.
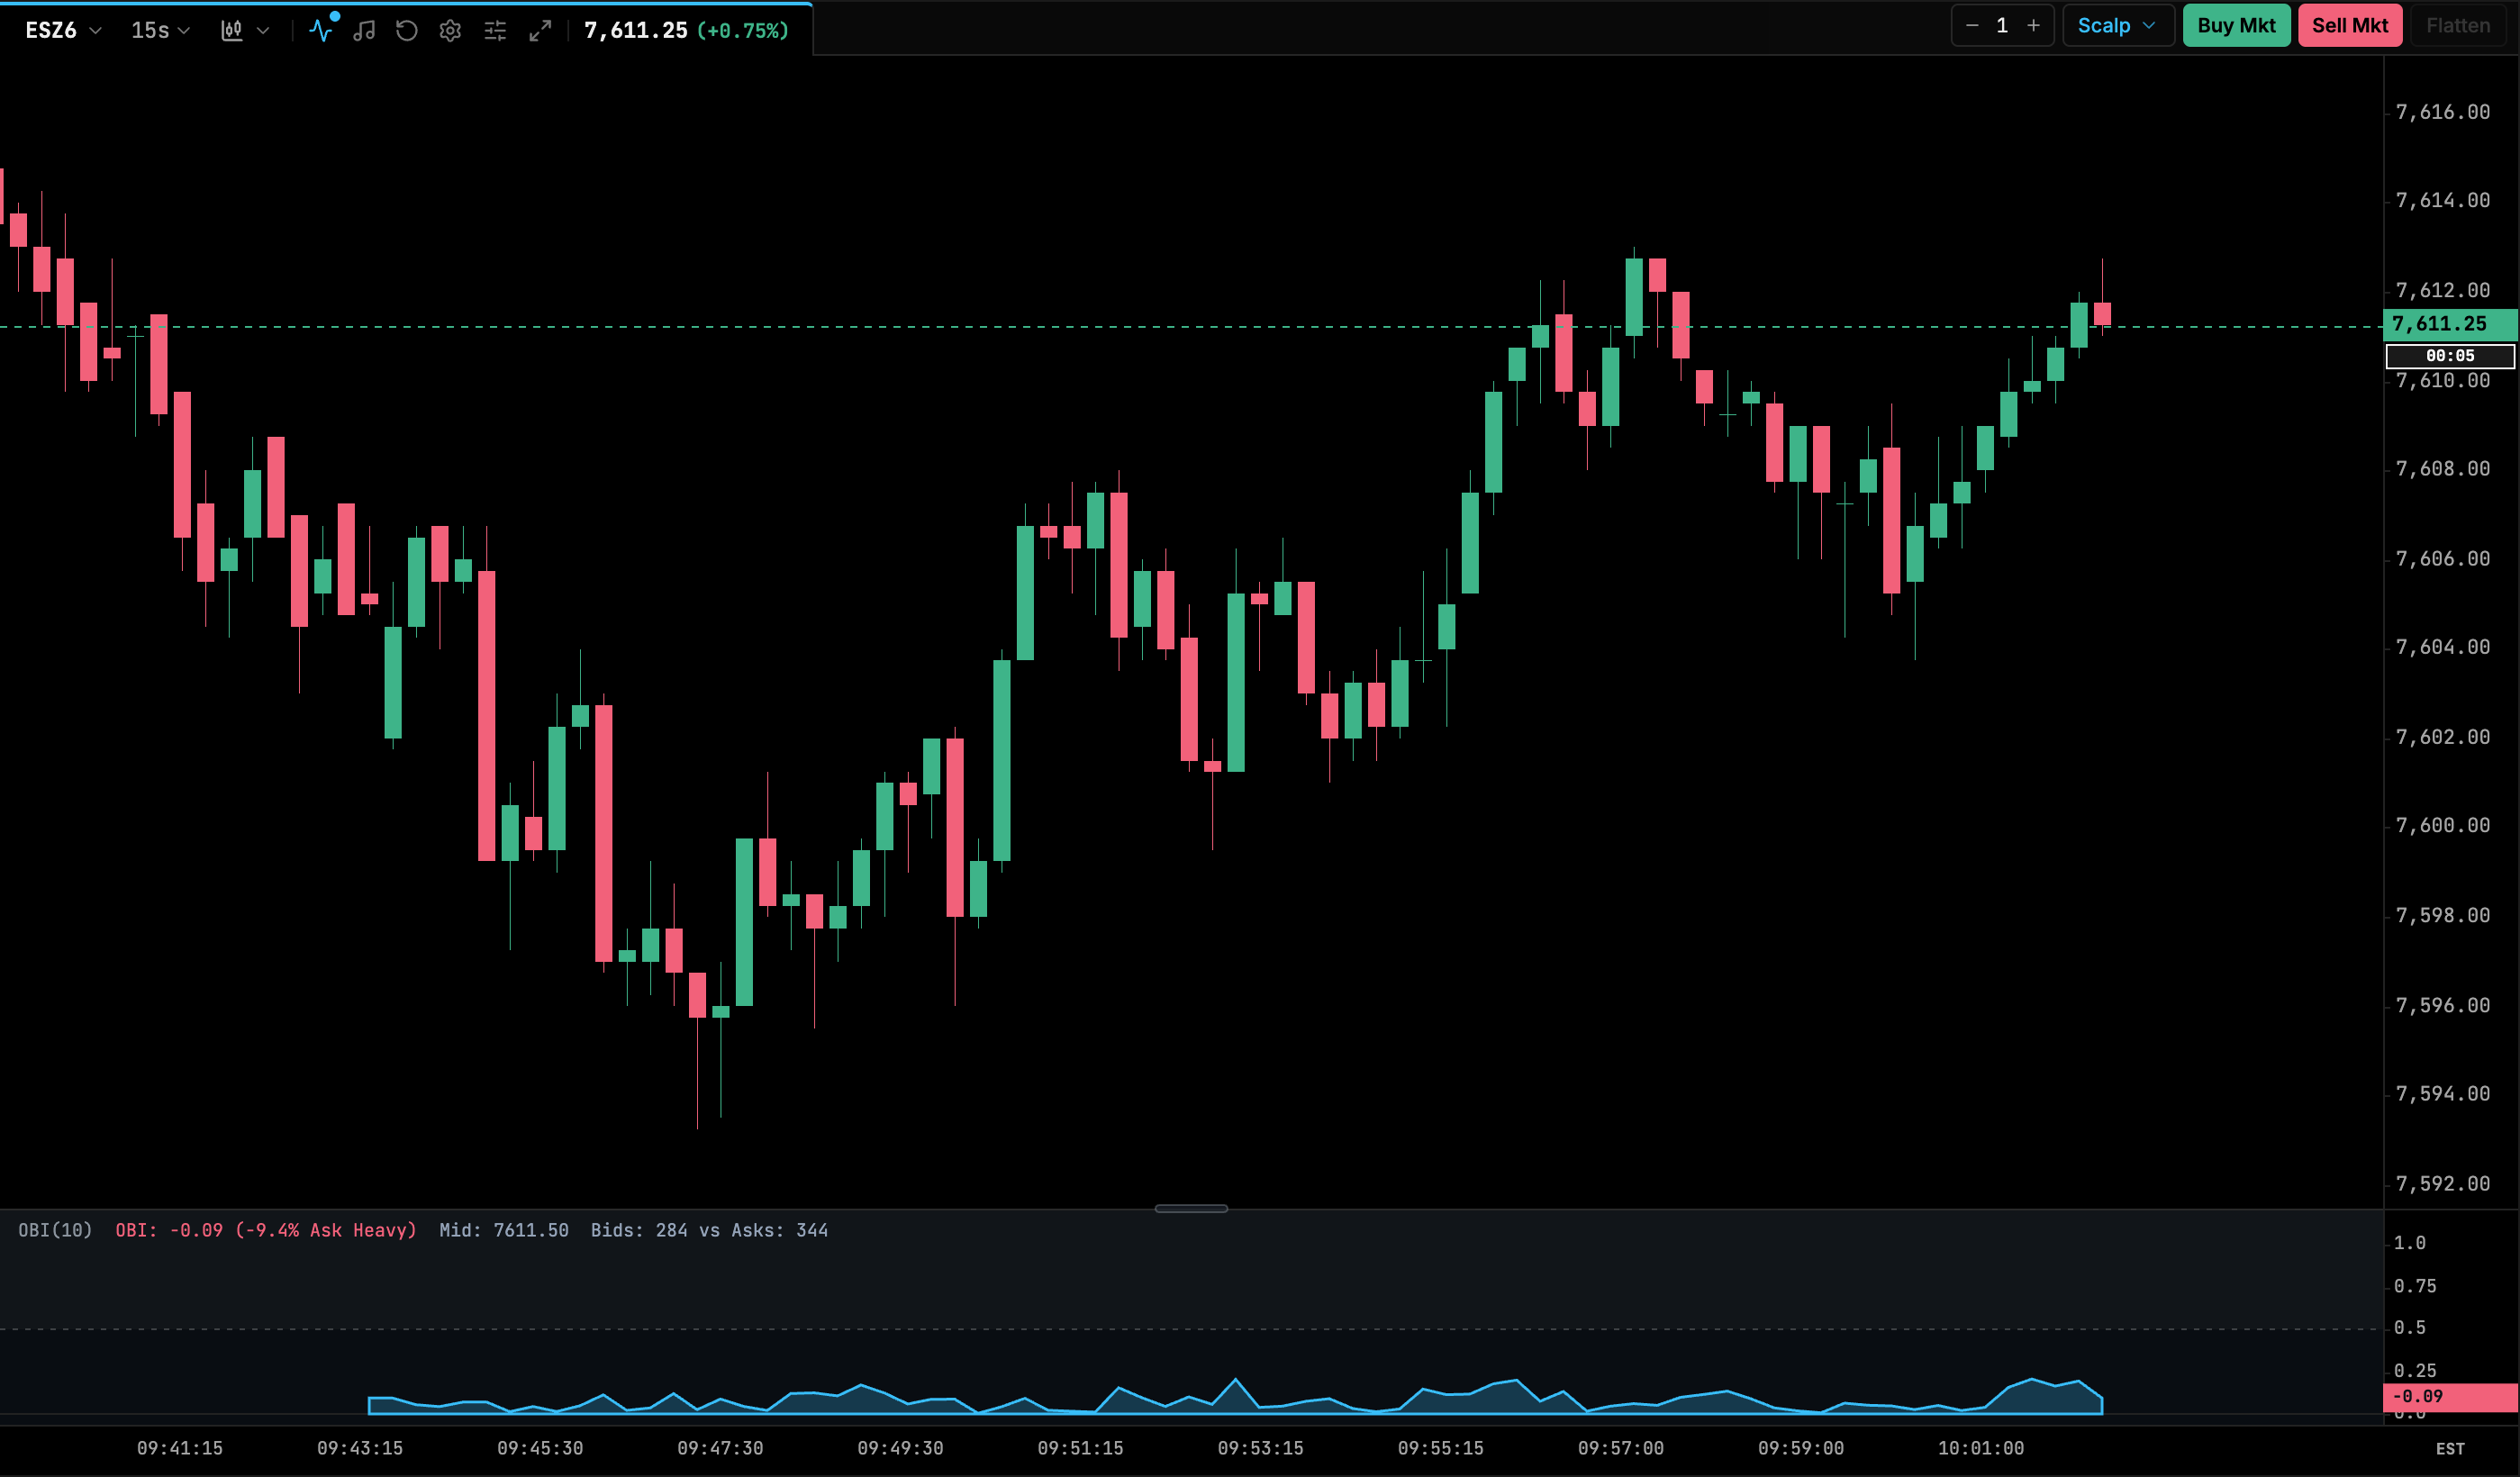
| Setting | Default | Range / options | Notes |
|---|---|---|---|
| Depth Levels | 10 | 1–50 | Price levels per side. |
| Distance Decay (λ) | 0 | 0–1 | 0 = all levels weighted equally. |
| Visualization Style | Histogram | Histogram, Area, Line | |
| Smoothing Filter (α) | 0.35 | 0.05–1 | Lower is smoother. |
| Show Zero Line | on | on/off | |
| Show Thresholds | on | on/off | |
| Imbalance Threshold | 0.5 | 0.1–0.9 | 0.5 ≈ 3:1. |
| Show Signal Line | off | on/off | |
| Signal Period | 9 | 2–50 | EMA length. |
| Bullish / Bearish / Neutral Color Override | empty (theme) | color | |
| Signal Line Color | theme amber | color |