Oscillators
Oscillators measure momentum and stretched conditions. Each one draws in its own sub-pane below the price chart. All seven are calculated from bar data (MFI also uses bar volume), so they work on every bar type and in Market Replay. To add one, open the Indicators dialog. See the Indicators Overview.
Relative Strength Index
Wilder’s RSI compares average gains with average losses over the period, using Wilder smoothing, and plots the result on a 0–100 scale. Readings above the overbought level suggest a stretched rally and readings below the oversold level suggest a stretched decline. Divergences between RSI and price can warn that momentum is fading.
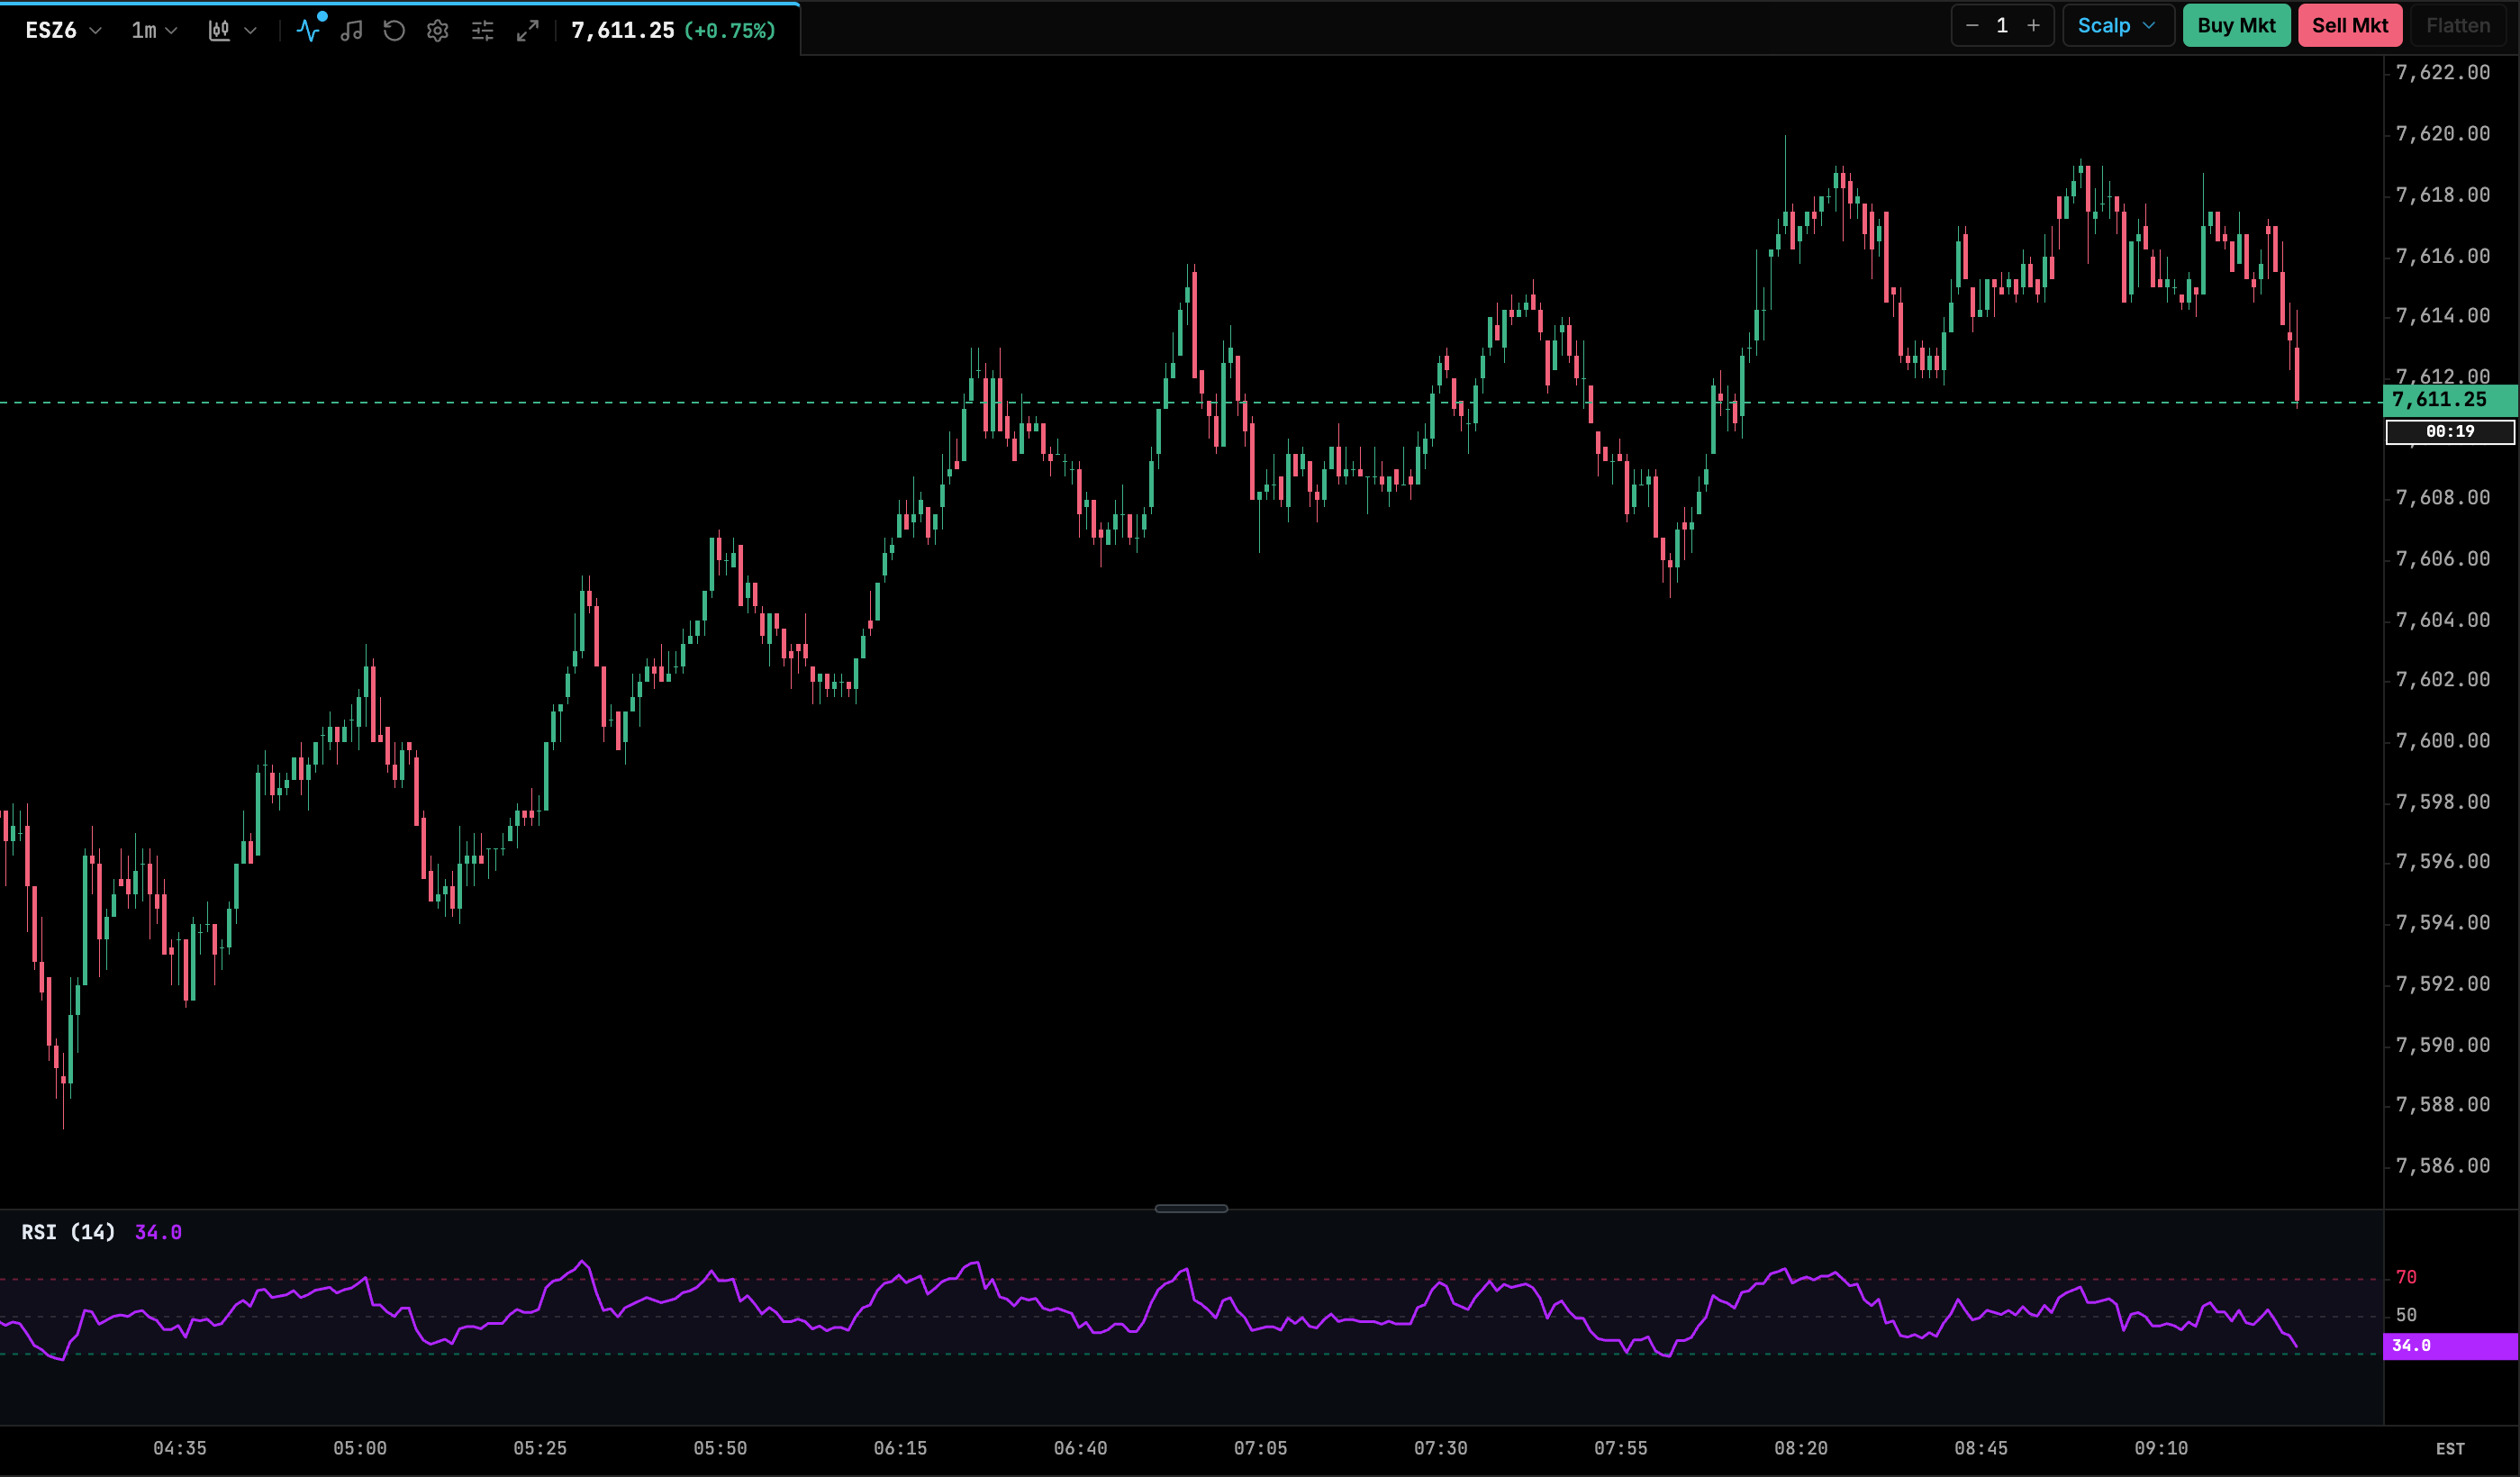
| Setting | Default | Range / options | Notes |
|---|---|---|---|
| Length / Period | 14 |
2–100 | |
| Overbought Level | 70 |
50–95 (step 5) | Upper level line. |
| Oversold Level | 30 |
5–50 (step 5) | Lower level line. |
| RSI Line Color | #B026FF |
color | |
| Line Thickness | 1.5 |
1–4 (step 0.5) |
MACD
Moving Average Convergence Divergence. The MACD line is the fast EMA of the close minus the slow EMA. The signal line is an EMA of the MACD line, and the histogram is MACD minus signal. Histogram bars are colored by sign. Common reads are signal-line crossovers, zero-line crosses and the histogram shrinking as momentum fades.
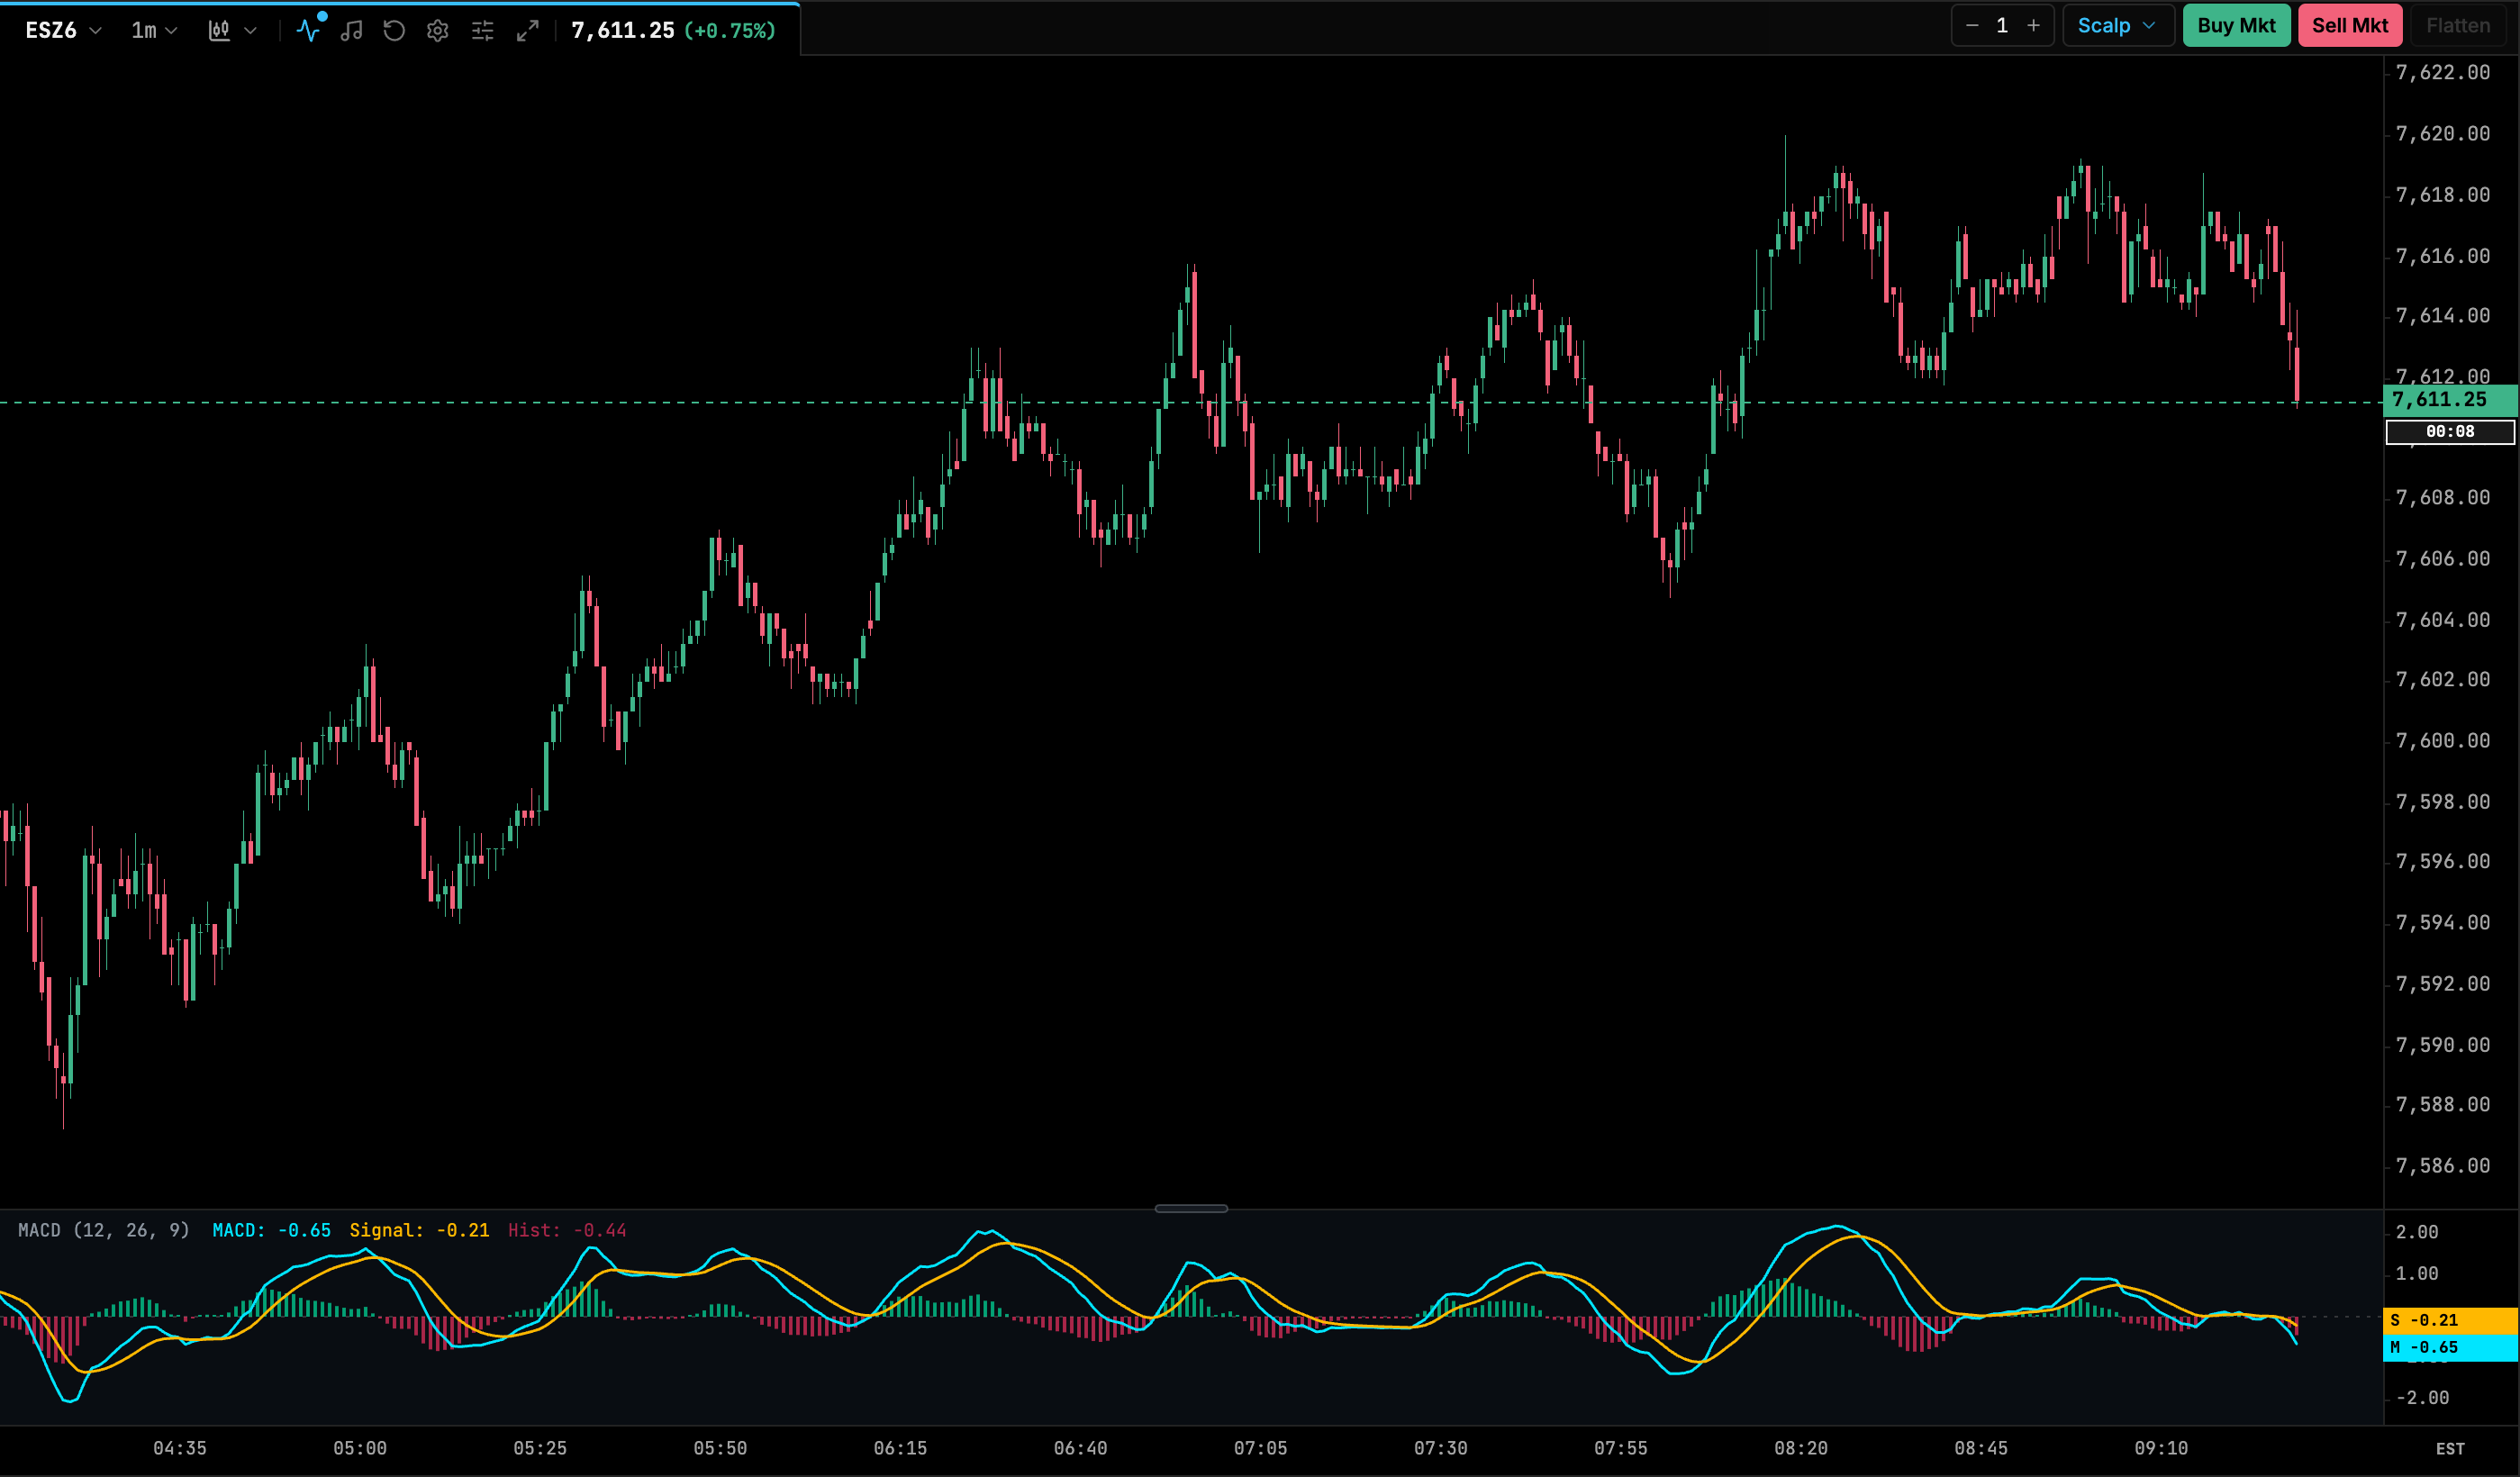
| Setting | Default | Range / options | Notes |
|---|---|---|---|
| Fast Period | 12 |
2–50 | Fast EMA length. |
| Slow Period | 26 |
5–100 | Slow EMA length. |
| Signal Smoothing | 9 |
2–50 | Signal EMA length. |
| MACD Line Color | #00E5FF |
color | |
| Signal Line Color | #FFB800 |
color | |
| Bullish Histogram Color | rgba(0, 240, 168, 0.65) |
color | Histogram above zero. |
| Bearish Histogram Color | rgba(255, 51, 102, 0.65) |
color | Histogram below zero. |
Stochastic Oscillator
Shows where the close sits within the high–low range of the last N bars, on a 0–100 scale. Raw %K is smoothed with a simple average to give %K, and %D is a simple average of %K. Crossovers of %K and %D inside the overbought or oversold zones are the classic signal.
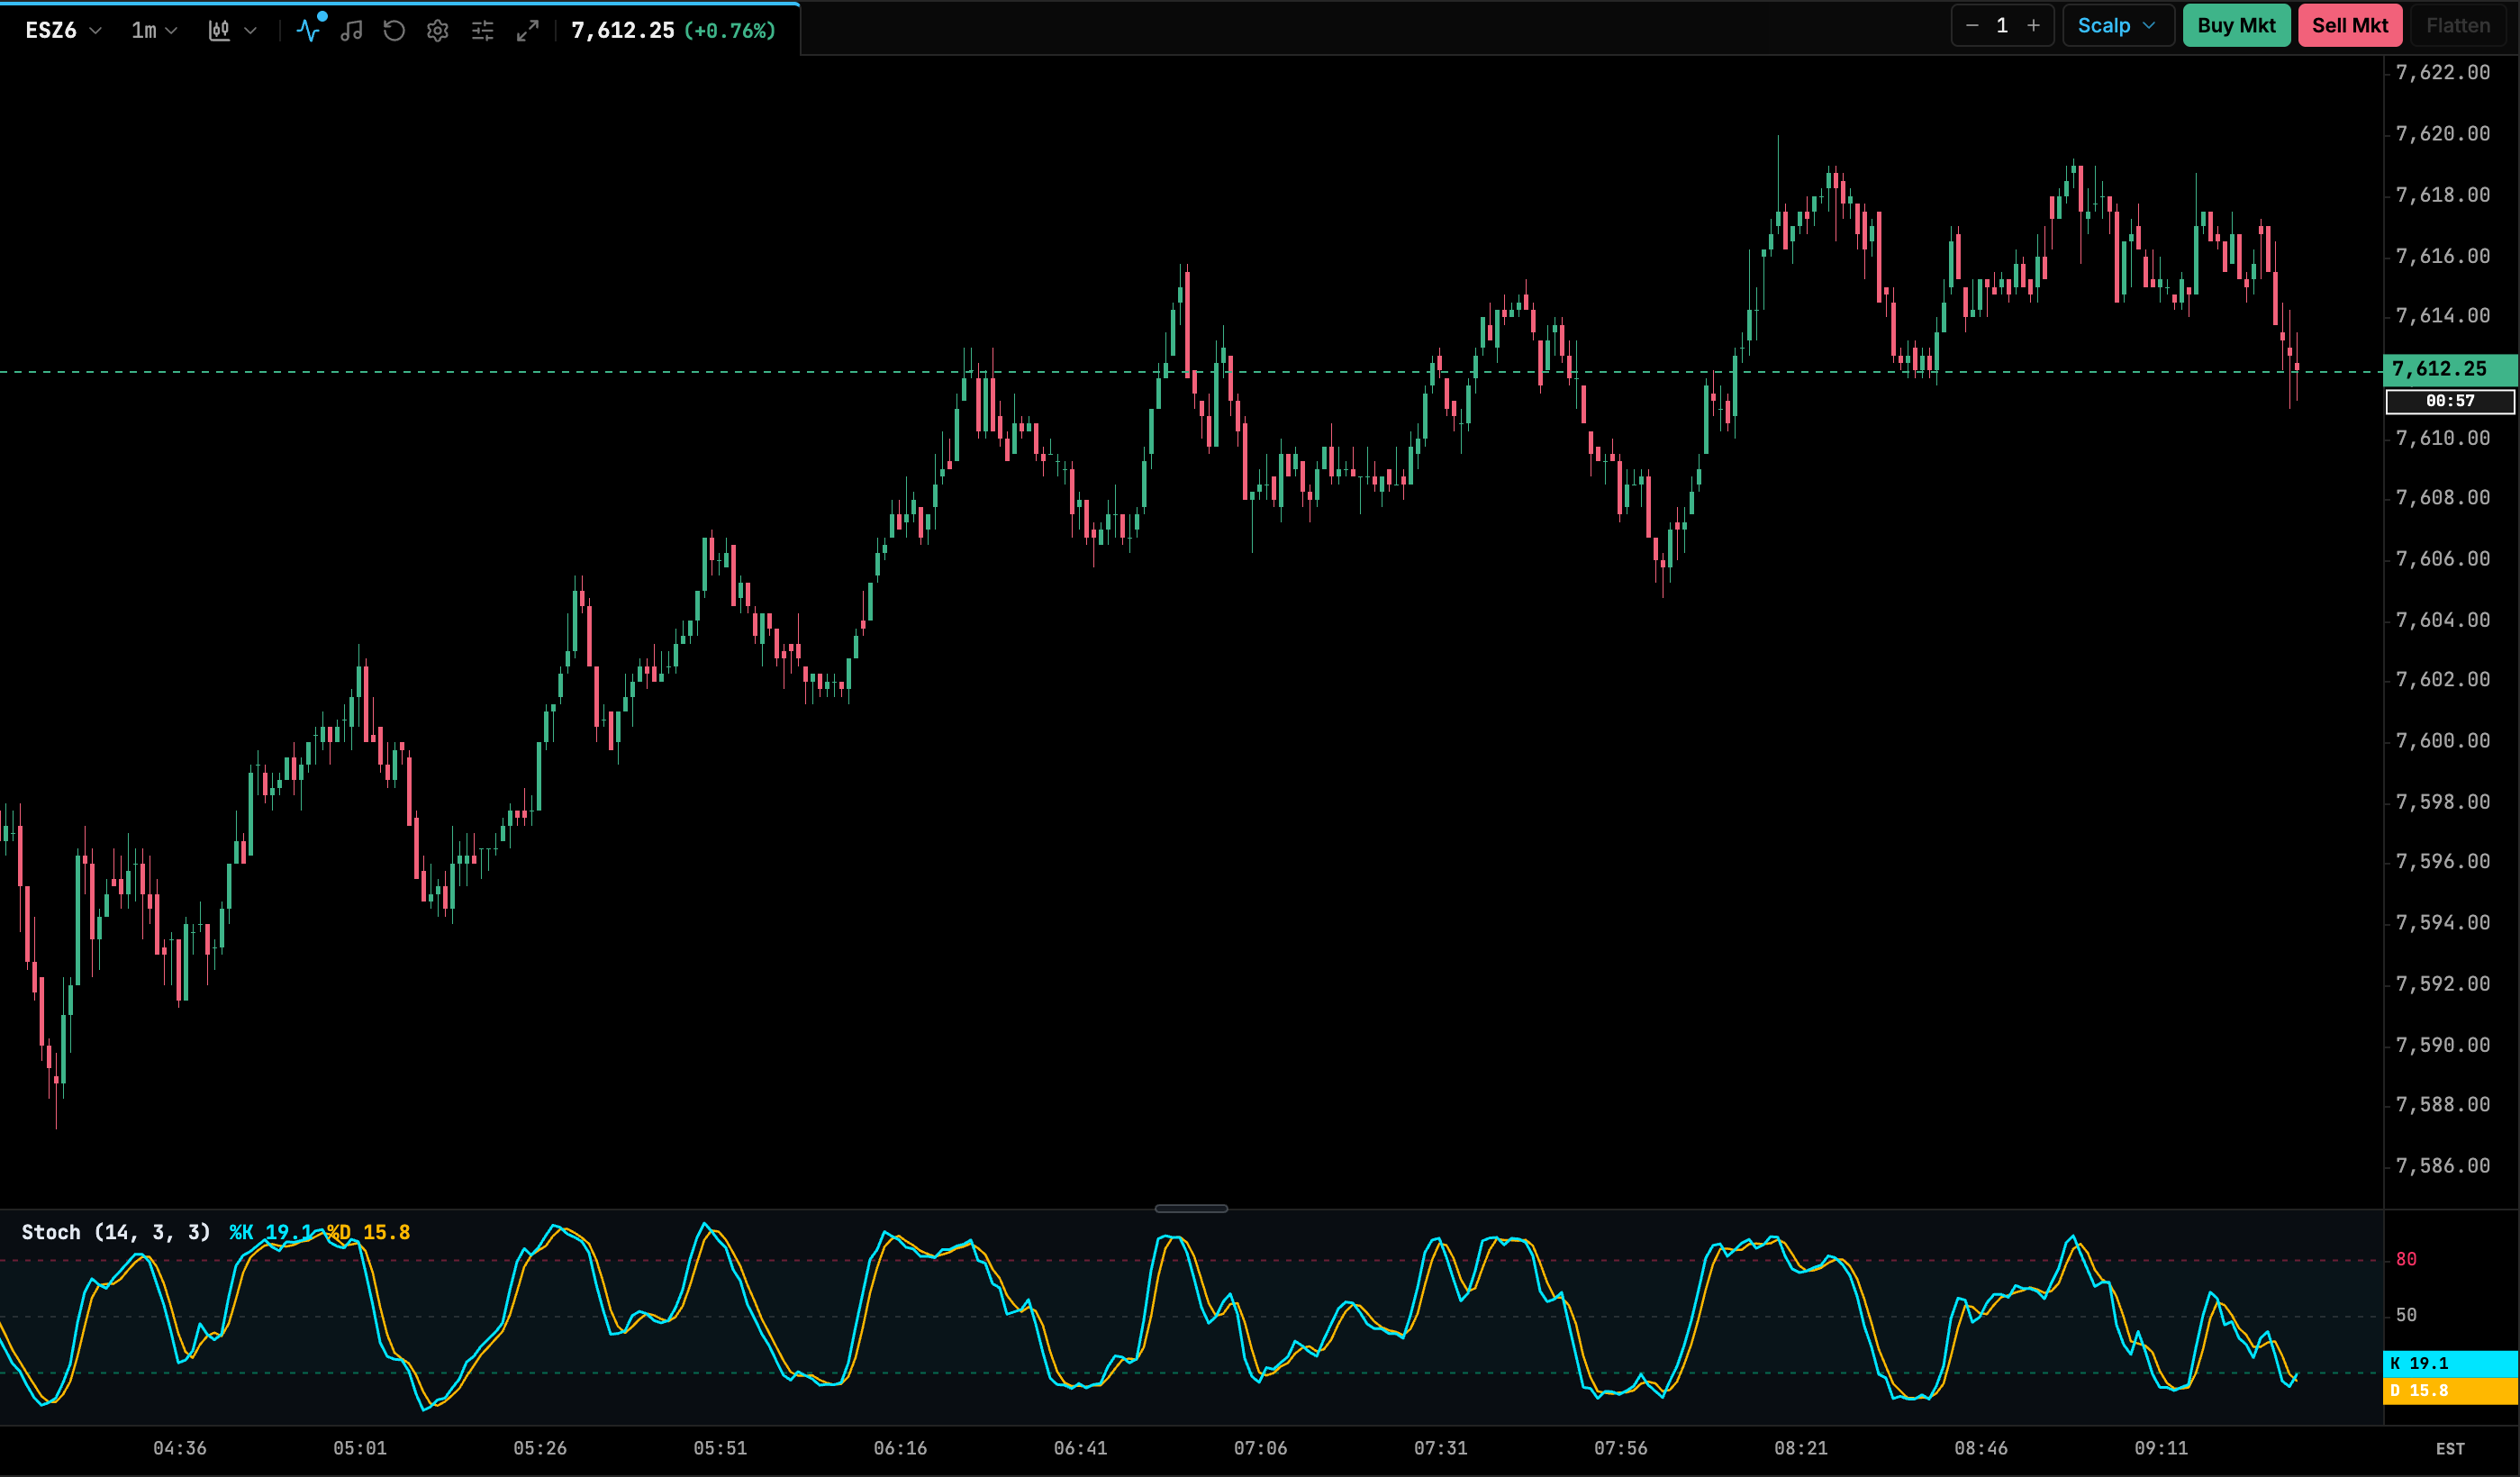
| Setting | Default | Range / options | Notes |
|---|---|---|---|
| %K Period | 14 |
1–100 | High–low lookback. |
| %K Smoothing | 3 |
1–50 | SMA applied to raw %K. |
| %D Period | 3 |
1–50 | SMA of %K. |
| Overbought Level | 80 |
50–95 (step 5) | |
| Oversold Level | 20 |
5–50 (step 5) | |
| %K Line Color | #00E5FF |
color | |
| %D Line Color | #FFB800 |
color | |
| Line Thickness | 1.5 |
1–4 (step 0.5) | %D is drawn slightly thinner. |
Stochastic RSI
Applies the stochastic formula to RSI values instead of price, measuring where RSI sits within its own recent range. It is faster and more sensitive than RSI, and is useful for timing entries within a trend.
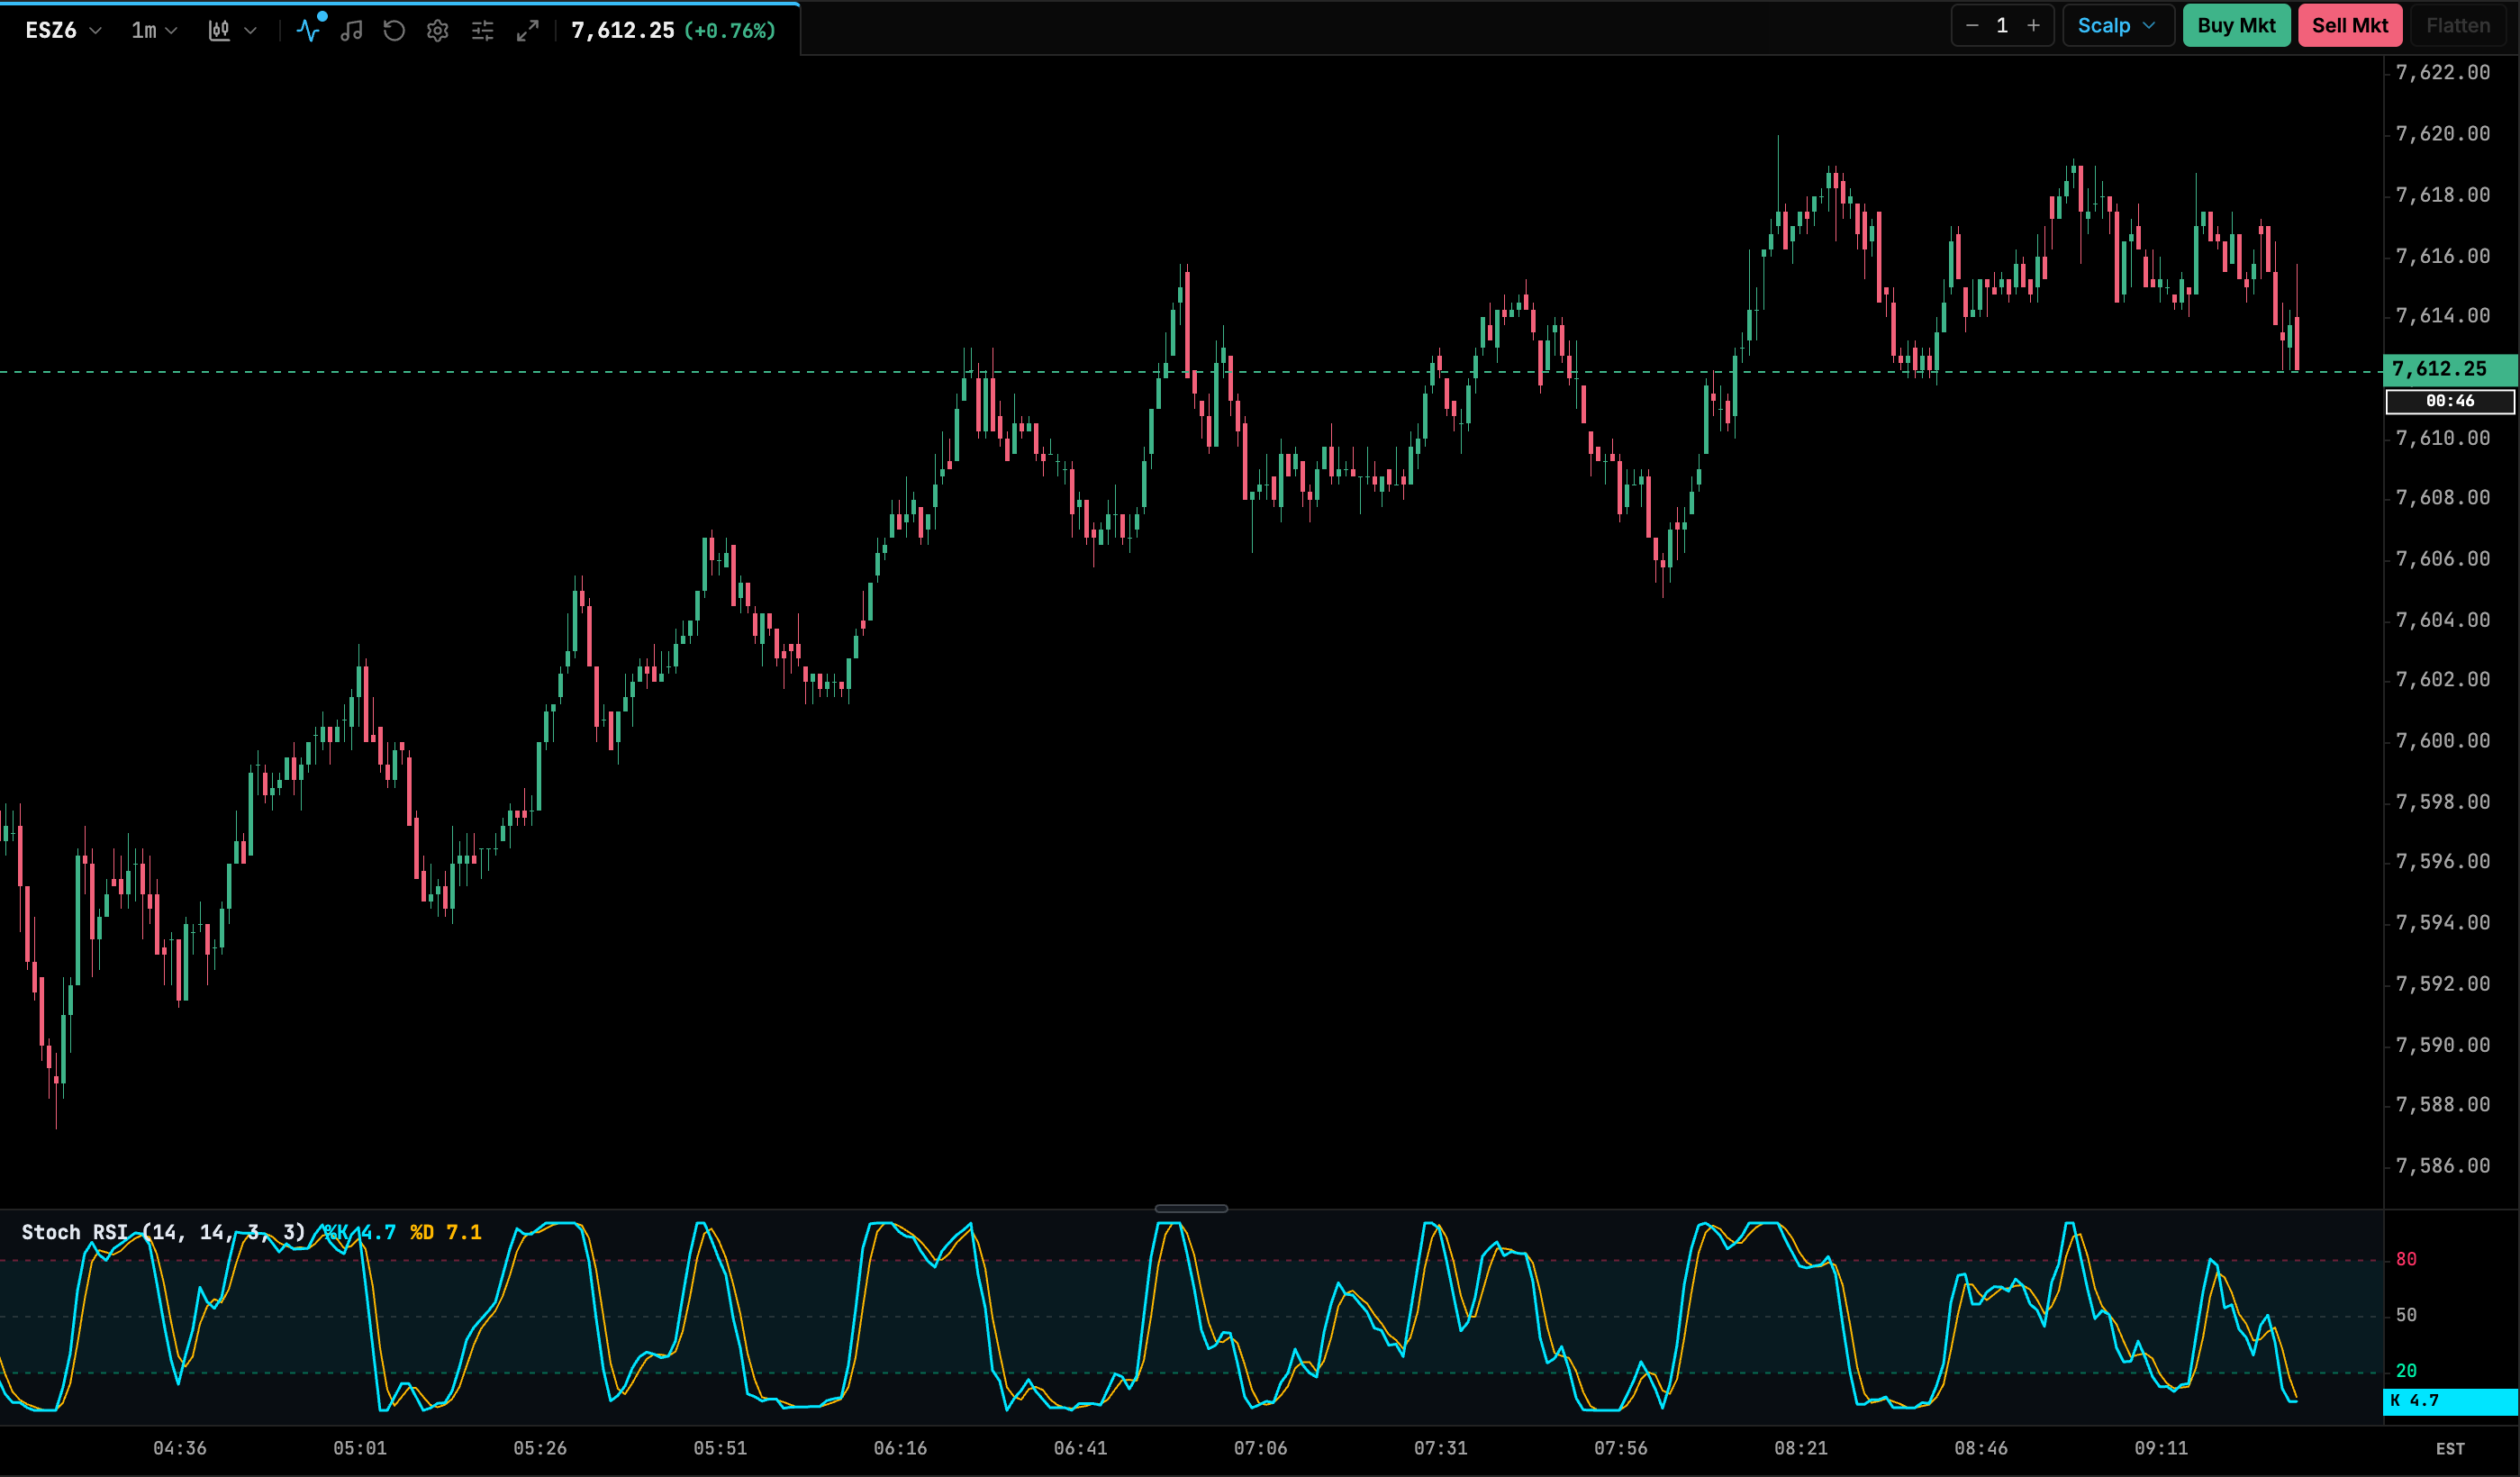
| Setting | Default | Range / options | Notes |
|---|---|---|---|
| RSI Length | 14 |
2–100 | |
| Stochastic Length | 14 |
2–100 | Lookback over RSI values. |
| %K Smoothing | 3 |
1–20 | |
| %D Smoothing | 3 |
1–20 | |
| Overbought Level | 80 |
50–95 (step 5) | |
| Oversold Level | 20 |
5–50 (step 5) | |
| %K Line Color | #00E5FF |
color | |
| %D Line Color | #FFB800 |
color | |
| Line Thickness | 1.5 |
1–4 (step 0.5) |
Commodity Channel Index
Measures how far the typical price (HLC/3) is from its moving average, scaled by mean deviation with the standard 0.015 constant. It is unbounded: readings beyond ±100 mark unusually strong moves.
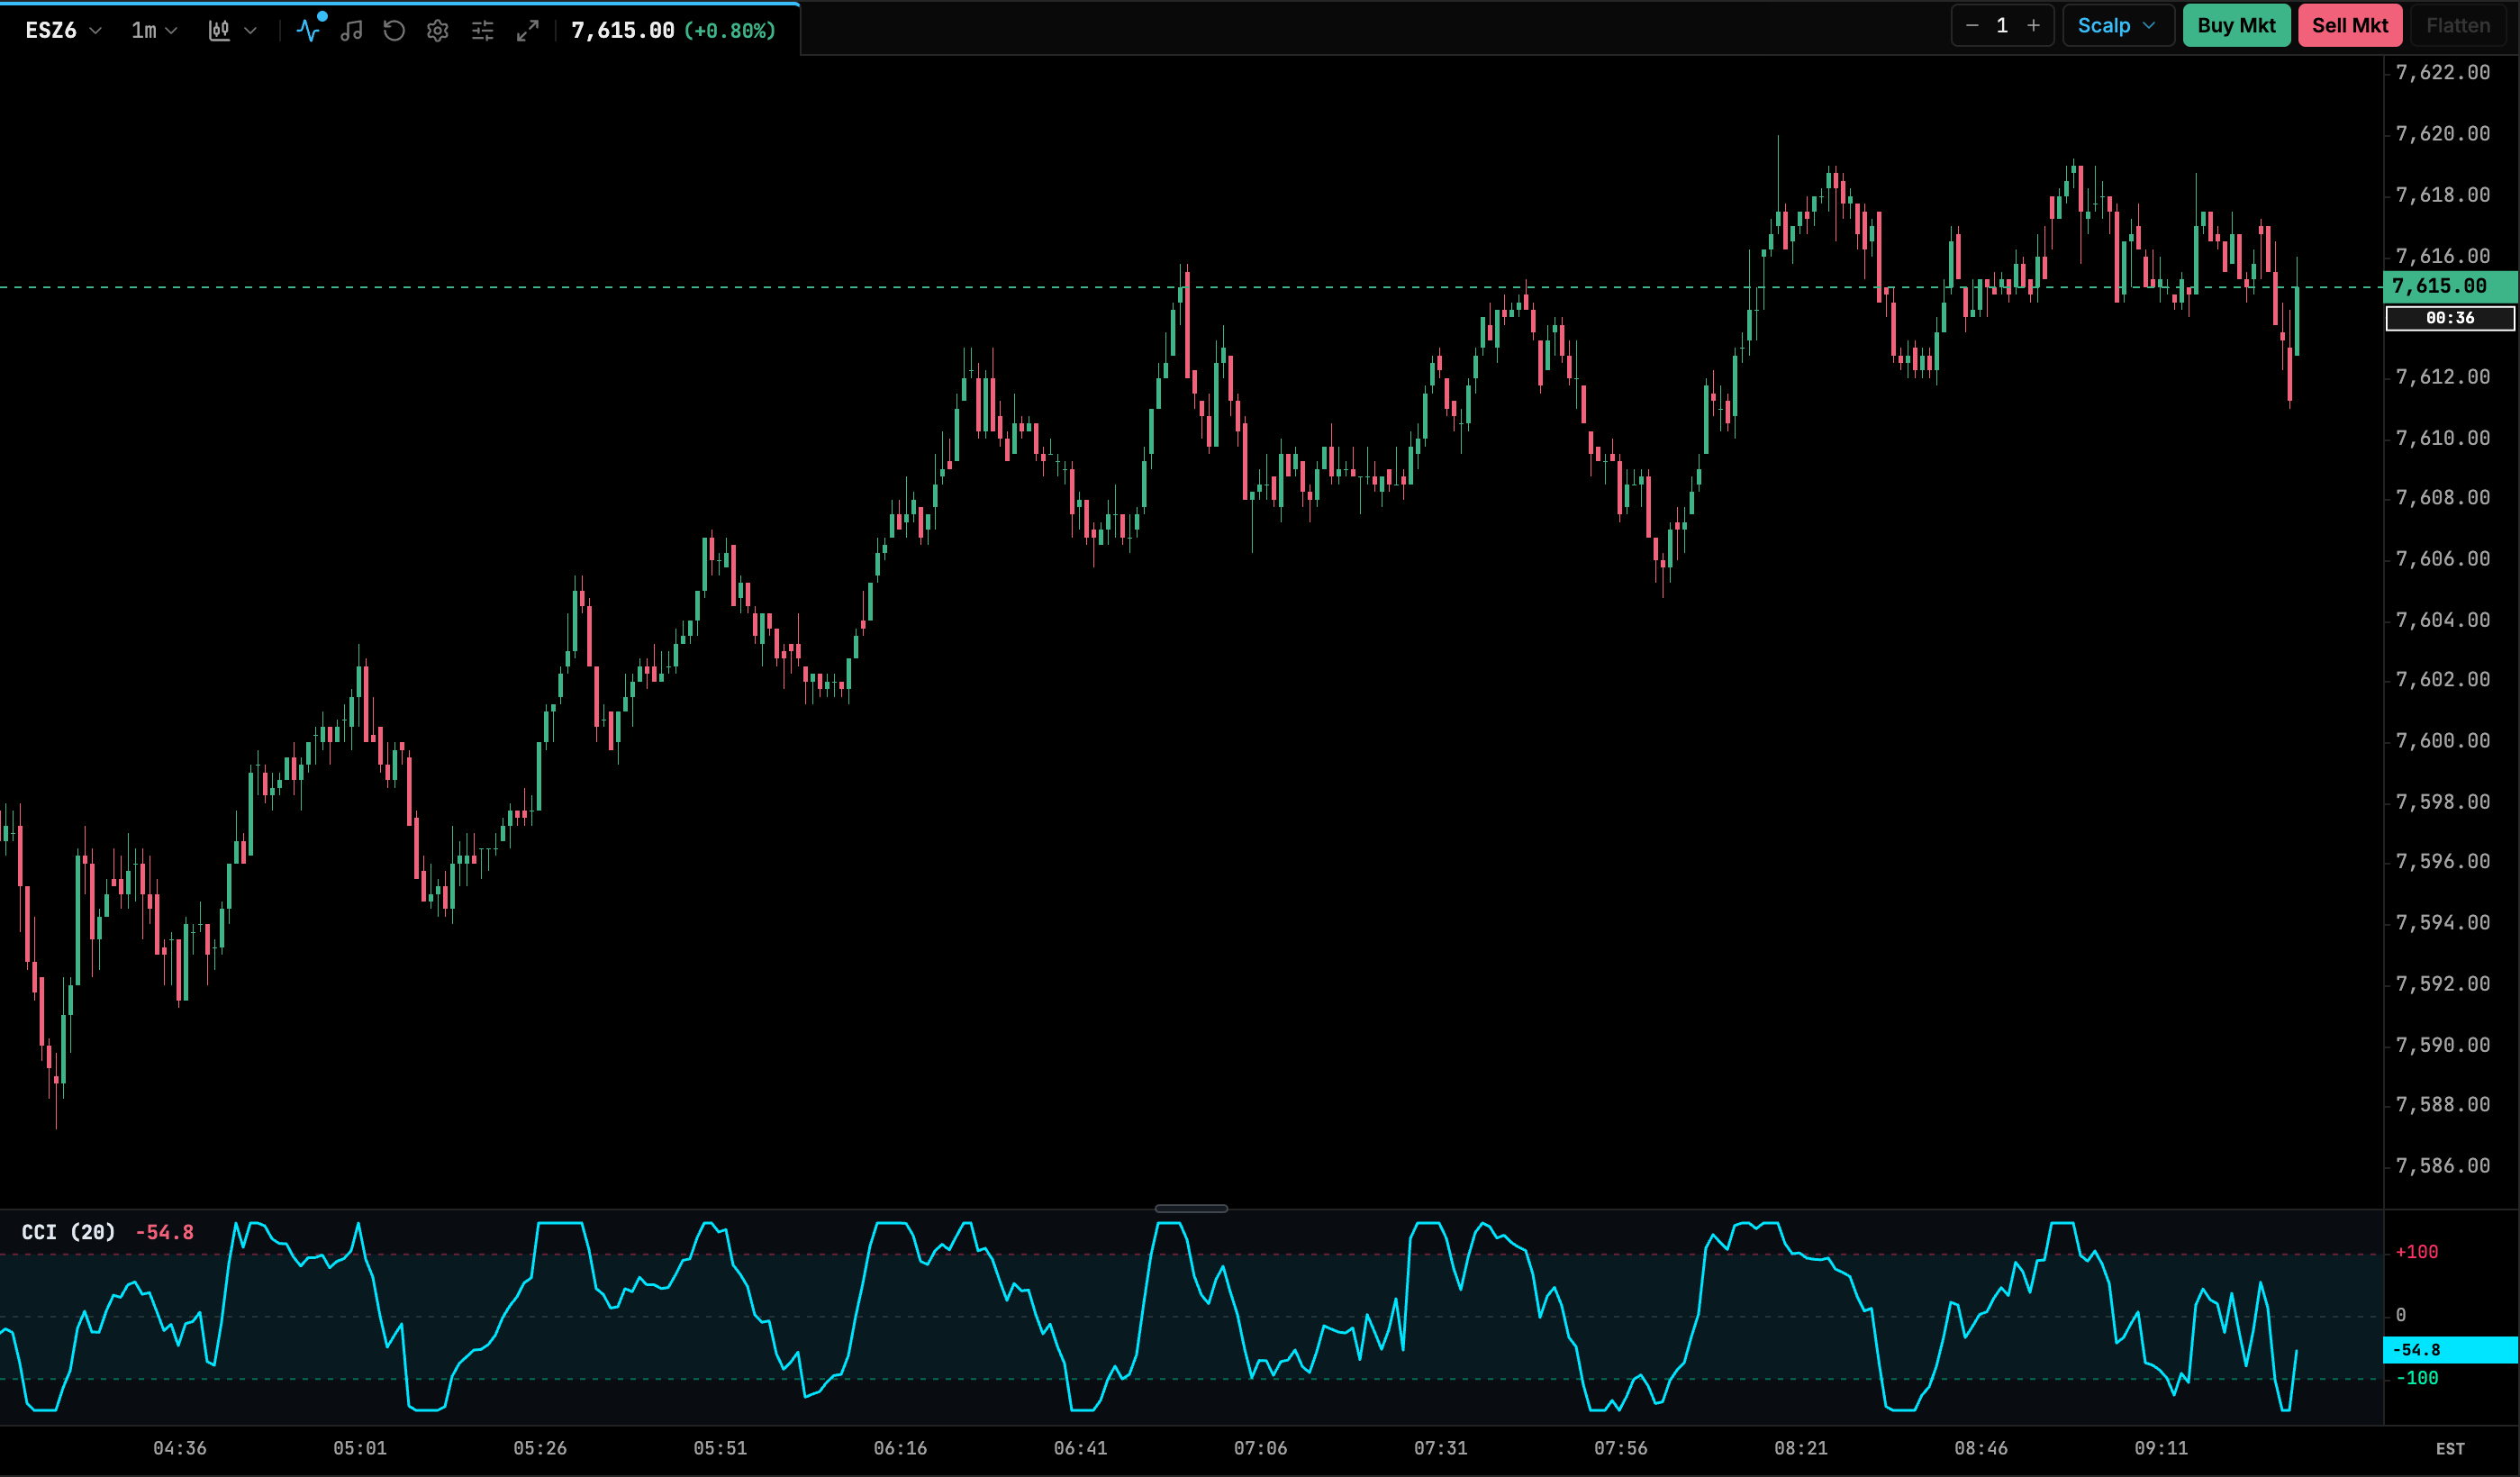
| Setting | Default | Range / options | Notes |
|---|---|---|---|
| Length / Period | 20 |
2–100 | |
| Overbought Level | 100 |
50–250 (step 10) | |
| Oversold Level | -100 |
−250 to −50 (step 10) | |
| CCI Line Color | #00E5FF |
color | |
| Line Thickness | 1.5 |
1–4 (step 0.5) |
Williams %R
Larry Williams’ momentum oscillator. It shows where the close sits relative to the highest high of the lookback, on a −100 to 0 scale. Readings near 0 are overbought and readings near −100 are oversold.
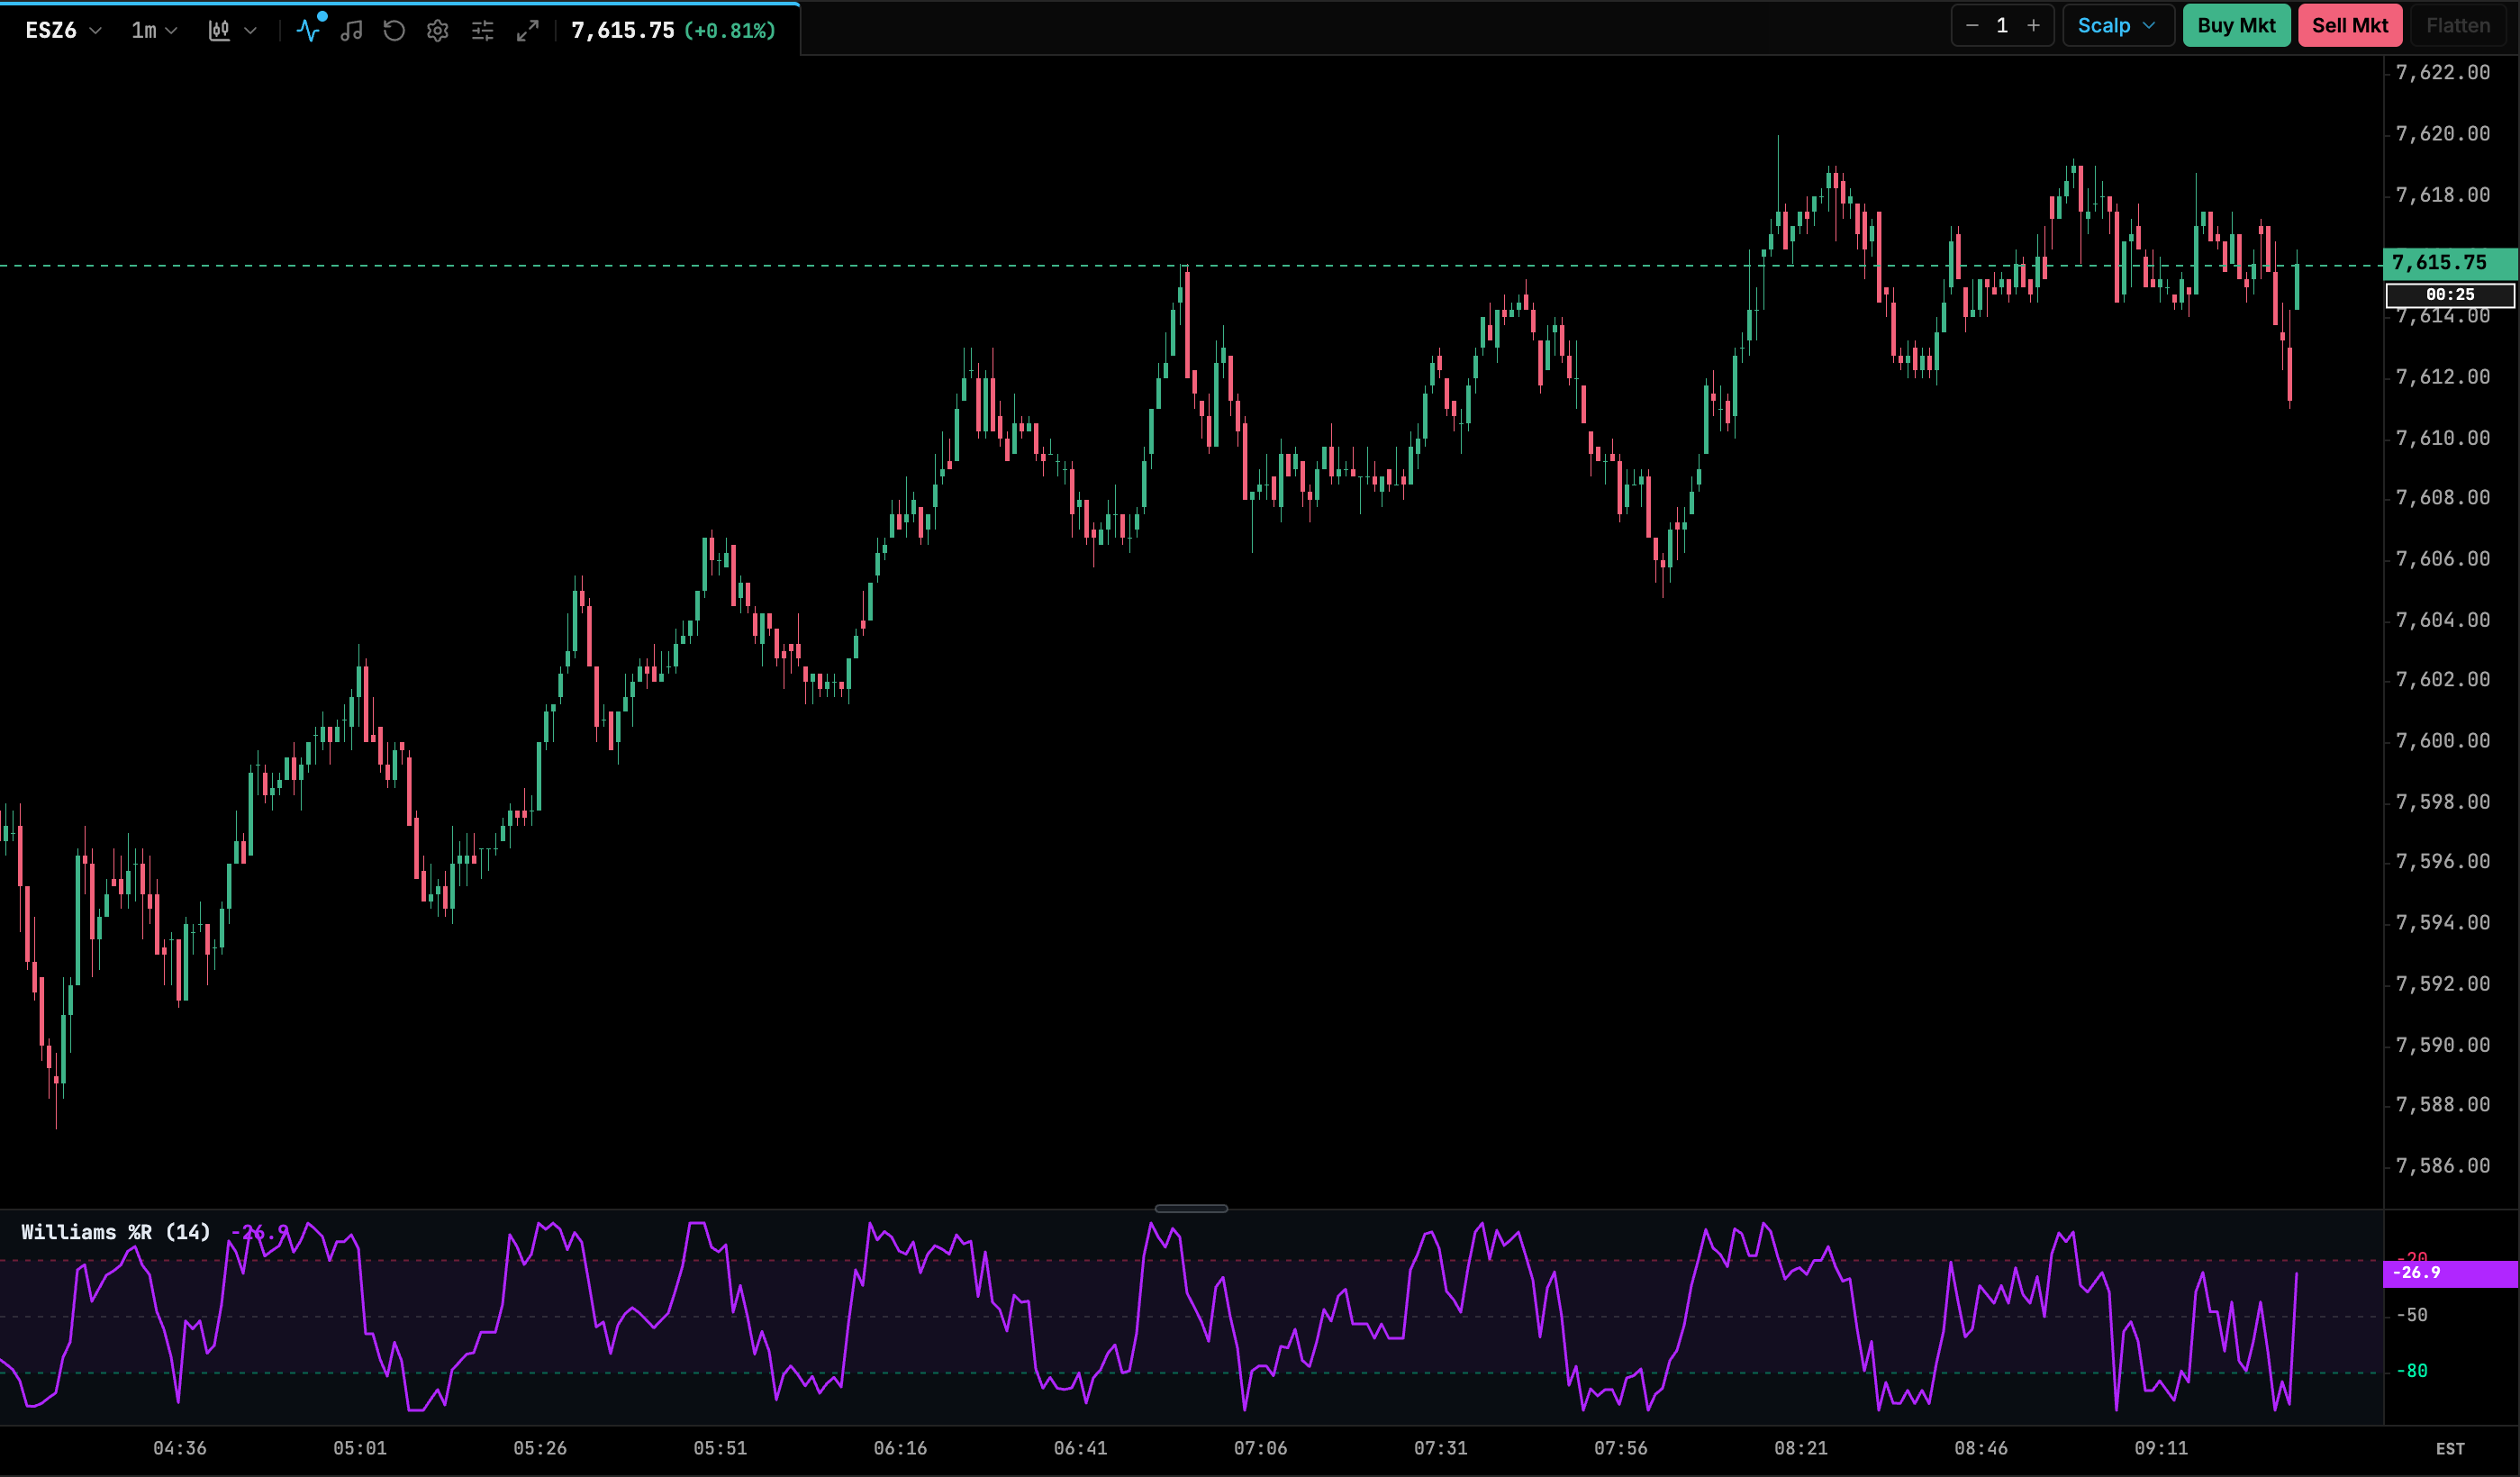
| Setting | Default | Range / options | Notes |
|---|---|---|---|
| Length / Period | 14 |
2–100 | |
| Overbought Level | -20 |
−40 to −5 (step 5) | |
| Oversold Level | -80 |
−95 to −60 (step 5) | |
| %R Line Color | #B026FF |
color | |
| Line Thickness | 1.5 |
1–4 (step 0.5) |
Money Flow Index
A volume-weighted RSI. Typical price × volume counts as positive money flow when the typical price rises and negative when it falls, and the ratio over the period is plotted on a 0–100 scale. Because it includes volume, divergences with price are often read as a sign of distribution or accumulation.
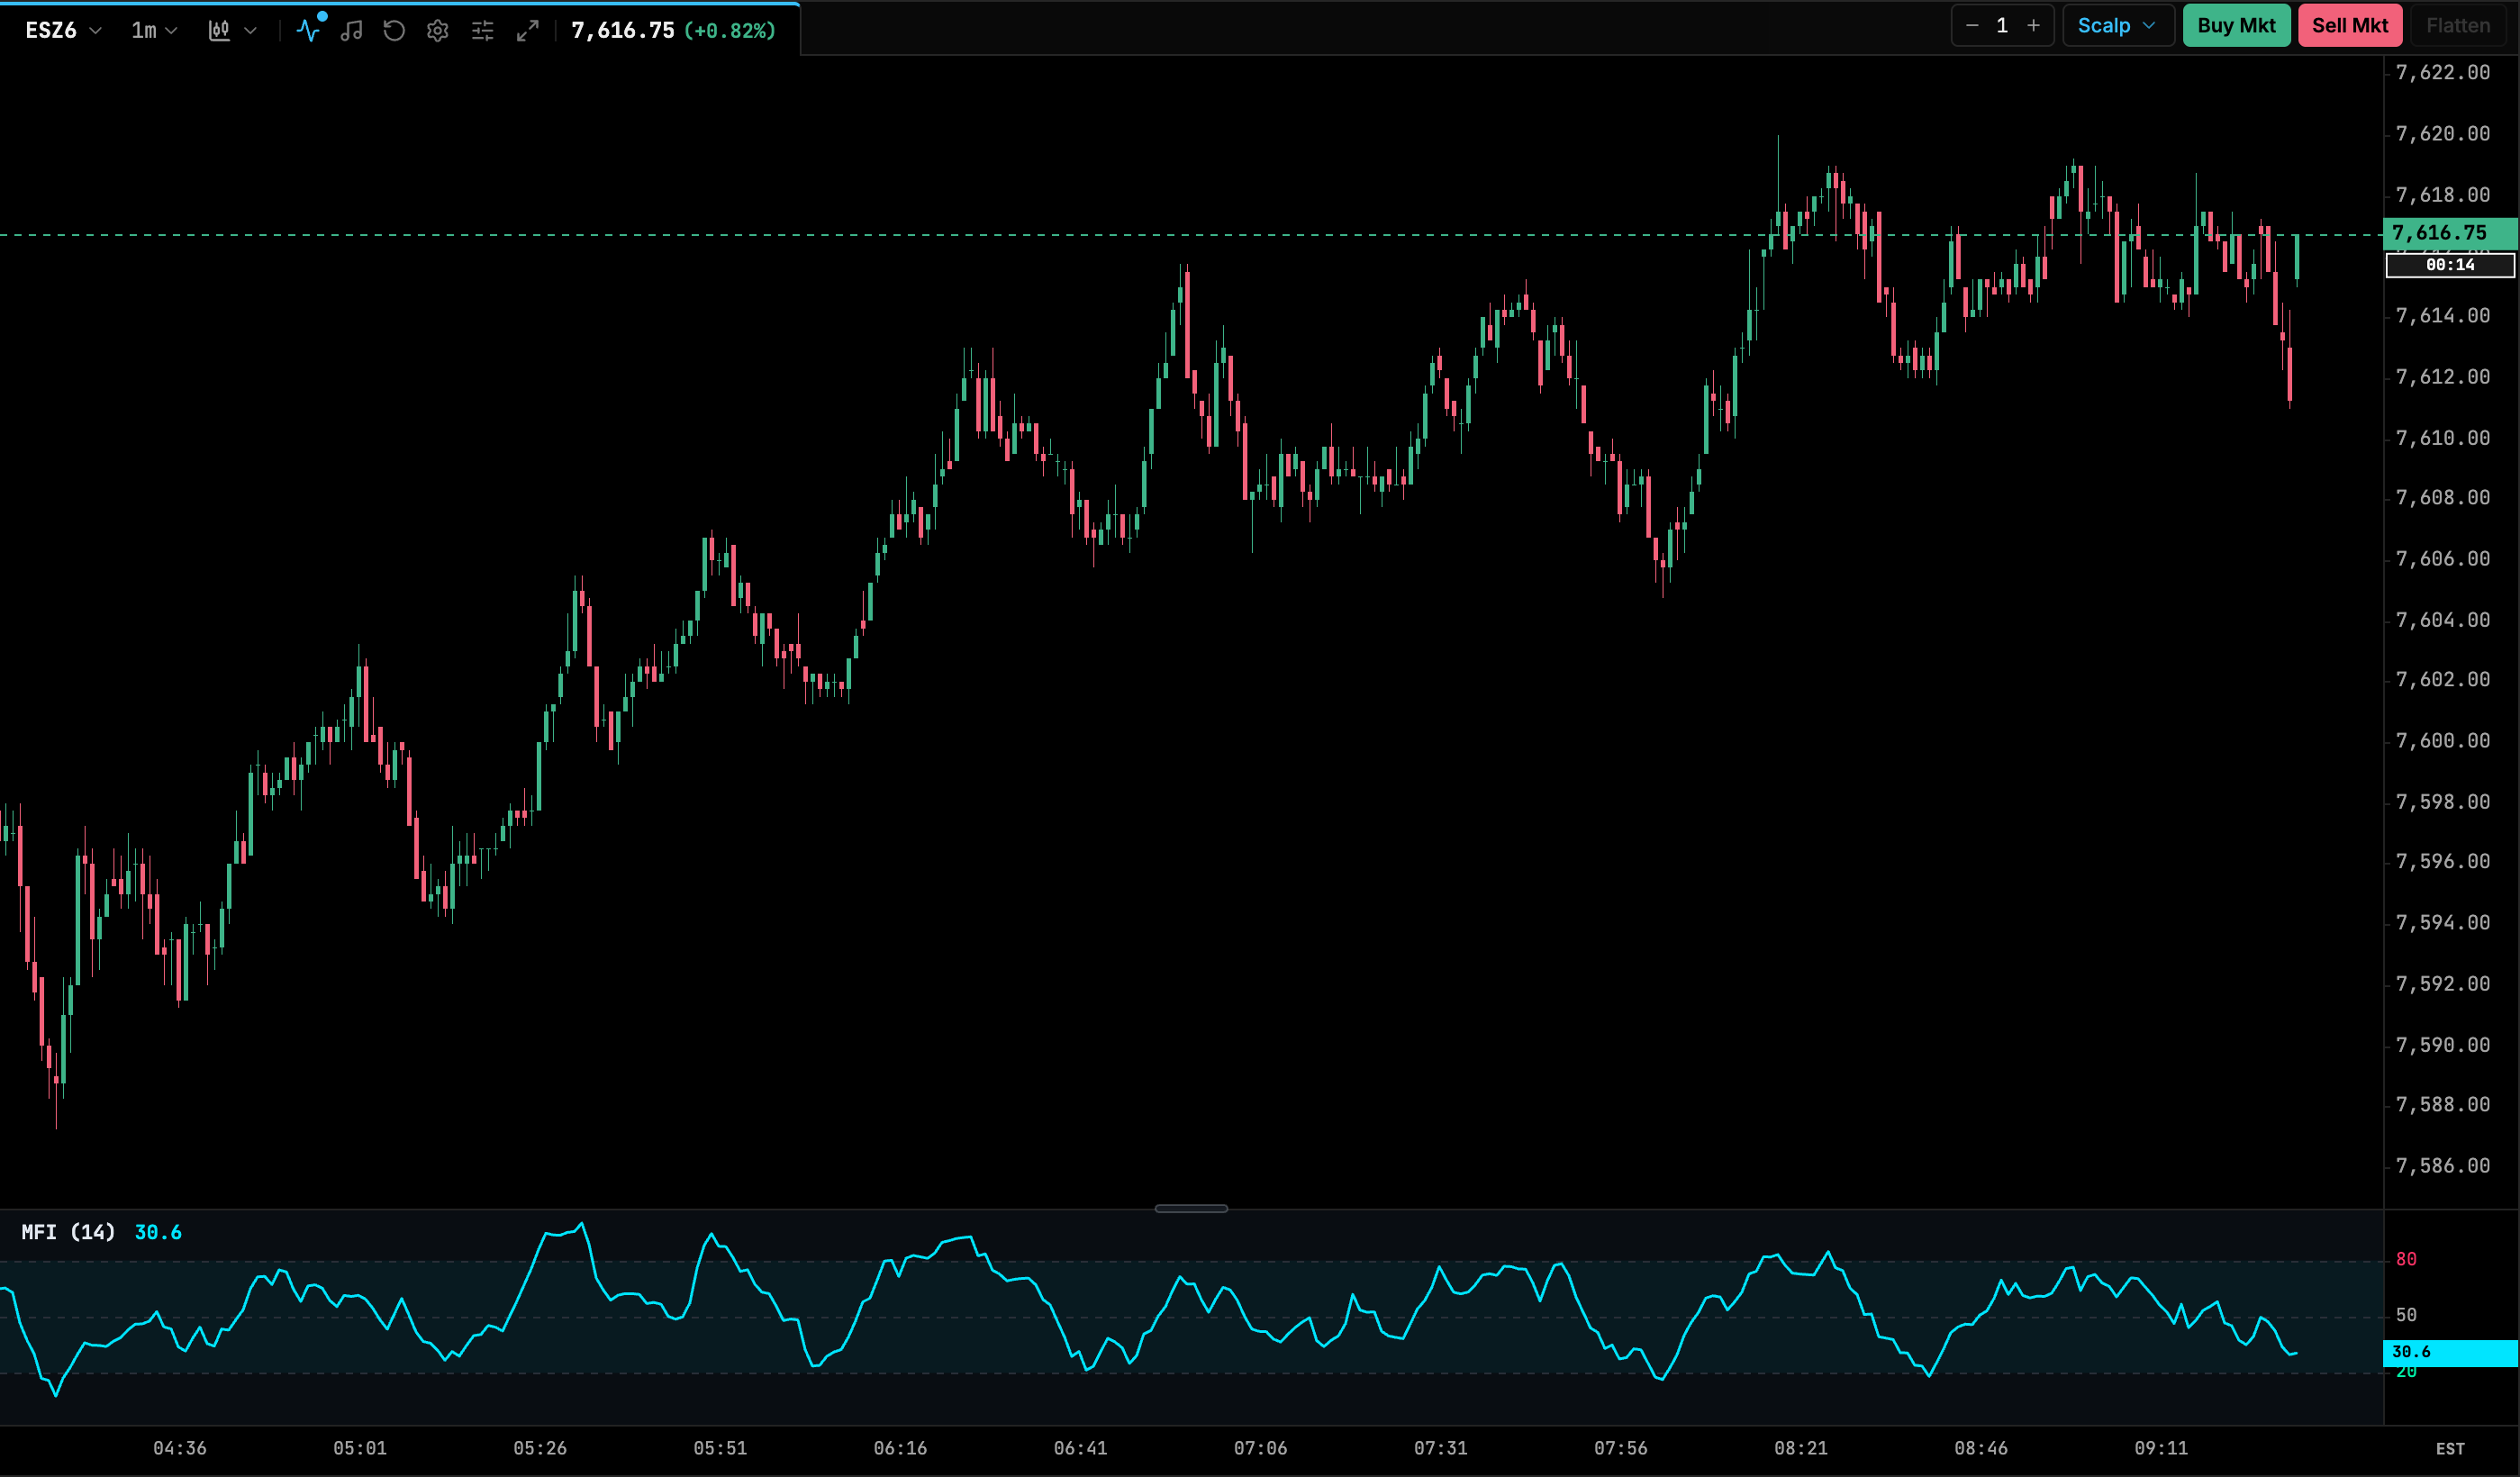
| Setting | Default | Range / options | Notes |
|---|---|---|---|
| Length / Period | 14 |
2–100 | |
| Overbought Level | 80 |
50–95 (step 5) | |
| Oversold Level | 20 |
5–50 (step 5) | |
| MFI Line Color | #00E5FF |
color | |
| Line Thickness | 1.5 |
1–4 (step 0.5) |